A protocol is described wherein CO2 mineralized from organic contaminant (derived from petroleum feedstocks) biodegradation is trapped, quantified, and analyzed for 14C content. A model is developed to determine CO2 capture zone's spatial extent. Spatial and temporal measurements allow integrating contaminant mineralization rates for predicting remediation extent and time.
Method Article
Measuring Carbon-based Contaminant Mineralization Using Combined CO2 Flux and Radiocarbon Analyses
In This Article
Summary
Abstract
A method is described which uses the absence of radiocarbon in industrial chemicals and fuels made from petroleum feedstocks which frequently contaminate the environment. This radiocarbon signal — or rather the absence of signal — is evenly distributed throughout a contaminant source pool (unlike an added tracer) and is not impacted by biological, chemical or physical processes (e.g., the 14C radioactive decay rate is immutable). If the fossil-derived contaminant is fully degraded to CO2, a harmless end-product, that CO2 will contain no radiocarbon. CO2 derived from natural organic matter (NOM) degradation will reflect the NOM radiocarbon content (usually <30,000 years old). Given a known radiocarbon content for NOM (a site background), a two end-member mixing model can be used to determine the CO2 derived from a fossil source in a given soil gas or groundwater sample. Coupling the percent CO2 derived from the contaminant with the CO2 respiration rate provides an estimate for the total amount of contaminant degraded per unit time. Finally, determining a zone of influence (ZOI) representing the volume from which site CO2 is collected allows determining the contaminant degradation per unit time and volume. Along with estimates for total contaminant mass, this can ultimately be used to calculate time-to-remediate or otherwise used by site managers for decision-making.
Introduction
Environmental cleanup costs are staggering, with numerous contaminated sites in the US and abroad. This makes innovative treatment and monitoring strategies essential to reaching Response Complete (RC) status (e.g., no further action needed) economically. Traditionally, lines of converging evidence have substantiated in situ bioremediation, abiotic contaminant conversion, or other forms of natural attenuation. Lines of evidence cannot be used to absolutely confirm degradation or to gather contaminant degradation rate information under in situ conditions1. Collecting a wide array of data to predict remediation timescale(s) has often been recommended, but linking these data cost-effectively to absolutely confirm remediation has been problematic2-4. Obtaining the most realistic and complete site conceptual model data with as little cost as possible is an ultimate site-management goal. Moreover, regulator and stakeholder demands represent additional drivers for obtaining the most timely, valuable and cost-effective information. Relatively inexpensive methods capable of providing compelling evidence for contaminant turnover rates offer the most value for meeting cleanup goals.
Because very distinct isotopic signatures are available in carbon-based contaminants, carbon isotopes have been recently applied to understanding contaminant attenuation processes at field sites5-13. Stable carbon isotopes can be used to determine if a source is attenuating based on Rayleigh distillation kinetics (c.f. 5,6 for reviews). This methodology, while convenient, may be limited when contaminants are from mixed sources — or do not represent an isotopically-unique "starting" spill (from which initial stable carbon isotope ratios can be derived). Natural abundance radiocarbon analysis represents an alternative (and perhaps complementary) isotopic strategy for measuring carbon-based contaminant degradation to CO2. Fuels and industrial chemicals derived from petroleum feedstocks will be completely devoid of 14C relative to contemporary (actively cycling) carbon, which contains 14C created by cosmic radiation reactions in the atmosphere. Radiocarbon analysis is not subject to fractionation as is stable carbon isotope analysis, and 14C decay is not significantly impacted by physical, chemical or biological processes. Moreover, the 14C signal — or lack thereof — in petroleum-derived materials is evenly distributed throughout the contaminant pool making it a fully miscible tracer. The technique described here relies on the observation that any CO2 generated from a fossil derived contaminant will be devoid of 14C while CO2 generated from microorganisms degrading NOM will contain easily-measurable amounts of 14C. Measuring 14CO2 also allows one to directly link full contaminant degradation (i.e., mineralization) to a harmless end product.
14CO2 analysis has been used to follow fossil fuel-derived contaminant degradation products7-13. This is due to the analytical resolution between end members (fossil and contemporary) which is roughly 1,100 parts per thousand (‰). Generally, accelerator mass spectrometry (AMS) is used to resolve natural abundance radiocarbon. Atmospheric CO2 (~ +200‰) living biomass (~ +150‰) and soil organic matter-derived CO2 (~ -200–+100‰) are all analytically distinct from fossil-derived CO2 (-1,000‰). This is due to the complete decay of all 14C, which has a half-life of roughly 6,000 years. Fuels and industrial chemicals derived from petroleum feedstocks, which are millions of years removed from active carbon cycling, have a distinct radiocarbon signature (-1,000‰ ≈ 0% modern — meaning no detection on AMS). The measurement is straightforward and in terms of sample contamination, almost all potential biases are toward the conservative (contaminating the sample with modern CO2). For instance, atmospheric CO2 getting into a sample would increase the radiocarbon isotopic signature and thus cause underestimating the degradation rate.
CO2 evolved from fossil-fuel based contaminant degradation will be radiocarbon-free. At a background site with no contamination, CO2 respired from natural organic matter (NOM) will be age appropriate to the NOM. Within the plume or at the fringes, contaminant-derived CO2 will have 0% modern carbon. CO2 from NOM sources and CO2 derived from fossil sources can be distinguished with a two end-member mixing model11. It is thus possible to estimate the proportion of the entire CO2 pool (respired carbon) attributable to the contaminant. Using solely this proportion, fossil-hydrocarbon or industrial chemical oxidation at field sites has been confirmed7-13. This proportion of contaminant derived CO2 can then be coupled with total CO2 mineralization rate (all CO2 collected per unit time and volume) to determine intrinsic contaminant mineralization rate. Assuming this attenuation rate would continue at given site conditions, one could then estimate time needed for site closure.
Techniques are available for determining soil horizon CO2 fluxes with methods having open- or closed-system designs14. Closed-system flux chambers and gas flux models have been used to determine net respiration in contaminated soils12,13,15-17. In these studies, spatial measurements directly associated with a contaminant plume and with background areas showed enhanced biodegradation of organic contaminants. Various modeling methods were used to scale vertical flux measurements to site volume. The goal of this study was to develop methods for collecting ample CO2 for AMS analysis (~1 mg) without influence from atmospheric CO2 contamination (sealed wells) while using the collection rate to determine contaminant respiration. Finally, modeling a zone of influence (ZOI) to ultimately scale the measurement to 3 dimensions (volume) allowed determining the chlorinated hydrocarbon (CH) conversion on a per unit volume and per unit time basis. The ZOI allows one to determine how much volume the respiration and radiocarbon measurements are taken from. The method consists of trapping evolved CO2 by recirculating well headspace gas through a NaOH trap, measuring the radiocarbon content of the collected CO2, using a two end-member model to apportion the CO2 collected to contaminant origin, then scaling the measurement to a volume calculated by a site-specific groundwater model. The well headspace gas is recirculated so that only equilibrium processes "pull" CO2 from the adjacent ZOI.
Protocol
1. Preparation and Field Installation
- Procure necessary field equipment; pumps, power (batteries, solar, transformers, etc.), tubing, well caps, fittings, sample vials and bottles, probes (pH, Eh, etc.) and low-voltage pumps.
- Seal battery-powered air pumps. Drill a hole into the pump housing (size 53) and route a short piece (3-5") of 1/16" plastic gas-impermeable tubing (for instance PFA).
- Seal all exterior portions of the pump (around the lower rubber housing) with marine sealant followed by a coat of silicone sealant.
- Pressure tests the pumps by gently blowing in the housing tubing while blocking the outflow. Check for leak visually.
NOTE: Light pressure should hold if there is no air leak (Fig. 1).
- Install monitoring wells if necessary (in this study existing wells were used — screened across the vadose:groundwater interface)18.
NOTE: One well must be a background well in a location representative of the contaminated site — but with no known petroleum-based contamination. - Obtain preliminary groundwater modeling data if they do not exist (hydraulic conductivity, aquifer porosity, soil density, specific yield, hydraulic gradient, etc.) as described18. Use this data to develop a Zone of Influence (ZOI) model (estimate of the CO2 capture zone). Prepare the ZOI model as described in the supplementary materials18.
- Prepare CO2 traps by weighing out ~25 g NaOH and transfer to a 100 ml serum bottle. Cap the serum bottle with a septum and crimp tightly. Prepare a trap for each collection well (Fig. 2), plus a field blank.
- Conduct initial groundwater sampling as needed to obtain initial pH, dissolved inorganic carbon (DIC) concentrations and cation concentrations10,18. Fill a 40 ml volatile organic analysis (VOA) vial, from the bottom to a convex meniscus with groundwater (sample via bailer, peristaltic pump, or vacuum line), add 5 drops of saturated CuSO4 solution19, cap tightly (must use septum caps) with as little headspace as possible.
- Take additional vials for other analyses (contaminant concentrations, for instance). Use an unpreserved vial for pH measurement if a meter is not available in the field. Refrigerate and transport to the laboratory.
- Route the power lines (able to carry ~ 1 amp) along the ground or other convenient means to each well. Affix a modified pump (see 1.2) and make sure the pump is operational (should be able to hear it working).
NOTE: The pumps can accommodate 12 V but use a lower voltage to save power (Fig. 3). - Cap wells with modified gas-tight well caps.
- To prepare caps, drill two holes (drill size 53) through caps in order to tightly fit 1/16" gas lines. Route two gas lines through the cap.
- Pull one line so that it rests in proximity to the groundwater table (Fig. 4). Affix a heavy stainless nut on the end in order weigh down the line.
- Route the other line just below the cap (this will be the gas return line). Coat the sealing surfaces and threads with ample vacuum grease to inhibit any air exchange. Tighten on the well cap.
- Route the lower tubing into the pump inlet. Route a gas line from the pump to the CO2 trap (NaOH) using a #16 gauge needle through the septum. Route a return line from the trap (using a second #16 needle) to the gas line ending just below the cap.
- Start the pump by supplying power and collect at least 30 well volumes (this depends on the volume of the well head-space. It can be calculated with the well radius (r) and estimated distance to the groundwater table (l), i.e., πr2l). Discard the initial traps (to clear the headspace).
- Remove and replace with fresh traps before collecting experimental CO2 by pulling out the needles from each bottle's septum and putting them in the new bottle's septum. Note time and date for pump turn-on.
2. Initial Sample Analysis
- To measure DIC by coulometry20:
- Transfer triplicate 1 ml subsamples to 40 ml serum vials capped with septa. Acidify subsamples with 1 ml 80% H3PO4. Sparge with a CO2-free air stream.
- Dry the evolved CO2 gas stream and scrub in line with sequential Mg(ClO4)2 and silica gel (230-400 mesh, 60 Å) traps. Bubble the gas stream into a coulometric cell where a colorimetric assay is used to quantify CO2. Use certified reference materials to calibrate measurements21.
- Measure pH using a standard calibrated pH meter. Measure pH on-site or on preserved samples.
- Measure dissolved cations by ion chromatography:
- Pipet 5 ml unpreserved groundwater samples to autosampler vials. Cap vials and place in an autosampler coupled to an ion chromatograph.
- Use a cation-specific column for the analysis10,18. Use 20 mM methanesulfonic acid as eluent and chromatographic flow set to ~0.7 ml min-1.
- Dilute a stock solution of 6 cation standards (containing Mg, Ca, Na, and K as a minimum) 0.5:4.5, 1:4, 2:3, 3:2, and 4:1 using purified water. Run these standards at the beginning of the analysis and after each 25 unknown samples. Run each sample three times (in triplicate). Create a standard curve by plotting cation concentration versus peak area and generating a linear regression. Analyze field samples accordingly10,18.
3. Measure CO2 Production and Mineralization Rate On-site
- After approximately two weeks to two months (will vary most likely from site to site based on in situ microbial metabolism rates), shut off power to pumps by unplugging them.
- For recirculated gas traps, remove needles and replace with a "fresh" CO2 trap. Traps are stable for long-term storage if sealed (c.f. Fig. 3).
- When ready for analysis, dissolve any remaining unspent (solid) NaOH and transfer the entire liquid contents to a volumetric device to obtain the dilution volume. Determine the full volume (for instance 200 ml to fully dissolve the remaining NaOH) and transfer subsamples (5-10 ml) to 40 ml vials with septa.
- Acidify by injecting 50% (v/v) phosphoric acid, sparge and analyze the resultant gas stream by coulometry (see 2.1).
- Manually calculate the CO2 collection rate by scaling the subsample to the entire volume and to the time of collection (i.e., X g CO2 per day). Subtract the field blank CO2 content. For instance, if the fully-dissolved NaOH is 200 ml, multiply a 10 ml subsample by 20 to reflect the total CO2 concentration.
NOTE: If that sample represented 14 days of collection, the collection rate would be the scaled CO2 concentration divided by 14 days. Plot the CO2 collection rate against the initial DIC concentration. If there is no correlation, collection rate is not a sole function of equilibrium kinetics. - In order to account for equilibrium kinetics, manually subtract the lowest collection rate from the collection rate of all other wells during the sampling period.
NOTE: For instance, if the lowest collection rate was 0.0001 mg d-1, make the conservative assumption that this represents solely equilibrium collection and subtract that value for all other collection rates to obtain the CO2 production rate due to degradation. The scaled rate is the organic carbon mineralization rate (conservative as the lowest rate might include some contaminant mineralization).
- Analyze the remaining CO2 by Accelerator Mass Spectrometry (AMS) to determine the radiocarbon content22. Use approximately 1 mg carbon for this analysis. Scale the collection time(s) to collect sufficient CO2. Subtract the radiocarbon content in the field blank by mass balance (radiocarbon measurement scaled to the amount CO2 in field blank).
NOTE: For the described test site, 2 week collections were more than adequate to obtain 1 mg carbon.
4. Model a Zone of Influence to Estimate the Soil Volume Sampled for CO2
- Use MT3DMS23 coupled with MODFLOW-200524 via the ModelMuse interface25 to simulate CO2 diffusion and equilibrium associated with the well screen (Video 1). The resolution of the model is 0.09 m 0.09 m which is approximately equal to the cross section of the well and considered reasonable for the ZOI estimation.
- Download and install MODFLOW-2005 (http://water.usgs.gov/ogw/modflow/MODFLOW.html#downloads), MT3DMS (http://hydro.geo.ua.edu/mt3d/), and ModelMuse (http://water.usgs.gov/nrp/gwsoftware/ModelMuse/ModelMuse.html).
- Configure ModelMuse with MODFLOW program location. To do so, click "Model" menu, then select "MOFLOW Program Locations…", then point the program to the MODFLOW-2005 program installation directory: /bin/mf2005.exe. Under this same dialog, configure ModelMuse with MT3DMS program location (installation directory: /bin/mt3dms5b.exe).
- Configure MODFLOW Packages and Programs (within the ModelMuse). To do so, select the "Model" menu, then "MODFLOW Packages and Programs….". Under "Flow," select LPF: "Layer Property Flow Package."
- Under "Boundary conditions," Select "Specified head," then select CHD: Time-Variant Specified-Head package." Select "MT3DMS." Select "BTN: Basic Transport package." Set the mobile species to CO2.
- Configure MODFLOW Options within ModelMuse. To do so, select "Model" menu, then MODFLOW Options. Under the "Options" tab, set model units (meters, hours, g (grams)).
- Configure MODFLOW Time by selecting "Model" menu, then "MODFLOW Time." Using a 360 length Stress period will have the simulation run for 15 days.
- Configure MODFLOW Data Sets by selecting "Data" menu, select "Data Sets." Enter data from site of interest: Hydrology (K values in 3 dimensions, Modflow Initial Head, Modflow Specified Head); MT3DMS: (Diffusion Coefficient CO2, Initial Concentration CO2, Longitudinal Dispersivity).
- Edit Global Variables. Select "Data" menu, select "Global Variables." Enter the CO2 collection rate (from site) and the initial CO2 concentration.
- Run simulation. Press the green arrow on the top icon bar to start the simulation. Save input files when prompted. Simulation will run. After run, export MT3DMS Input files: Select "File" menu, then "Export," then MT3DMS Input Files. Simulation will compile and export data.
- Observe and output model results. Click the visualize icon on icon bar. Select the simulation. Output ZOI boundary values in X, Y and Z axis
NOTE: This model represents a Zone of Influence for the CO2 collection (the full model development is described in report form available from the supporting materials)18. The ZOI, which is defined as the volume of aquifer that has a CO2 concentration of 95% or less, appears to be symmetric about the hydraulic gradient, which suggests relatively small effect of advection process with the small hydraulic gradient during the dry season. Further analysis indicates that the volume of aquifer with any CO2 depletion (i.e., < 99%) extents downgradient significantly longer.
5. Couple Radiocarbon Content with CO2 Production Rate and Scale to Volume (with ZOI)
- Convert radiocarbon ages (if necessary) to per mil notation using standard formulae22. Use the background well radiocarbon value as a known (Δ14CNOM) in equation (1). Δ14Cpetroleum is know (-1000). Use the individual well value for Δ14CO2. Solve for fractionpetroleum.
(1)Δ14CO2 = (Δ14Cpetroleum x fractionpetroleum) + [Δ14CNOM x (1 - fractionpetroleum)] - Multiply the fraction petroleum by the CO2 mineralization rate (3.1) to determine the contaminant mineralization rate (i.e., 50% x 1.0 mg d-1 = 0.5 mg contaminant carbon d-1).
- Divide the contaminant mineralization rate by the ZOI volume calculated in (4) to determine contaminant mass mineralized per unit time per unit volume (i.e., 0.05 mg C m-3 d-1).
Results
At the test site, historical CH contamination has been highest within the central well cluster (MW-25-MW-30) and near Sherman Road (Fig. 5). In 1983, large portions of contamination were removed from the landfill site (North of the test site) and additional excavation occurred in 2001. CH concentrations have decreased after source removal particularly near the former pits (Sherman Road), but a persistent plume continues to exist in the central well cluster region. Seasonal rains are known to transiently increase CH concentrations and residual contamination desorbs for soils27. Soils in the area are primarily former dredge sands. A possible interference with the described method could exist if ancient carbonate rocks are present, and groundwater pH is very low (<~5). This could lead to carbonate dissolution and an ancient signal in CO2 generated. No significant CaCO3 are known in the area, nonetheless, cations and pH were measured and subjected to regression and principal components analyses (PCA). The primary concern was that low pH might promote calcium carbonate (CaCO3) dissolution, which could bias radiocarbon analysis (ancient carbonate rocks could provide ancient CO2 if dissolved by acidic waters). Na+ content was marginally higher at the Southern side of the site (closest to the ocean), but no values were in a range indicating significant seawater intrusion. Calcium ion concentrations ranged from 8.0 to 58 mg L-1. Carbonate dissolution was not indicated when relating calcium ion concentration to pH (r2 < 0.3). PCA bi-plots did not indicate strong loadings with any variable. Between-well differences also did not indicate carbonate dissolution (Fig. 6). This conformational analysis should be considered critical when adapting the methodology to new sites — particularly those with regional geology indicating significant carbonate rock formations.
CO2 production rates ranged from 0 to 34 mg CO2 d-1. CO2 production was lowest in the central well cluster in the region where historical contamination was highest (Fig. 5). CO2 production in well MW-01 (background well — not shown, but ~500 meters Northwest of the main well cluster) was the very high at 31 mg CO2 d-1). Duplicate respiration analyses had standard errors ranging from 0.03 to 6% CO2 and averaged less than 1% (0.98). The two, 2-week periods dry season measurements were averaged for subsequent calculations. Respiration measurements did not vary considerably between individual 2-week periods. Between period respiration standard error ranged from <1 to 51% but averaged 13% (Table 1). Respiration averaging allowed calculating a single CH volume removed during a one-month period. The background well (MW-01) had a radiocarbon age of 1,280 years before present (ybp) or 85 percent modern (pMC) — within a common range for aged soil organic matter26. This well's value was used as background for the isotopic mixing model. Again, because sampling was limited to one-month total, two back-to-back periods during the same season were used to "represent" the dry season — generally thought to be the most stagnant conditions and thus conservative for extrapolated estimates. As with DIC production rates, radiocarbon measurements were similar between individual 2-week periods. The standard error between periods ranged from 0.25 to 18% and averaged 6%. CO2 radiocarbon ages ranged from ~34 to 85 pMC or ~1,340 to 8,700 ybp (Table 1). MW-27 and MW-32, suspected of being compromised by pump leaking had modern radiocarbon values and were thus confirmed as compromised. These samples were not included in further analysis.
Previous reports were used for groundwater hydraulic and CO2 solute properties to develop the ZOI model26,27 (Table 2). Weather data (2007, 2011 and 2012) from the CIMIS San Diego station (Station ID 184) were used to estimate the aquifer recharge rate. Tidal data over the same time period from the NOAA San Diego Station (Station ID: 9410170) were used to define boundary conditions. The model calibration assumed a steady hydraulic gradient and constant CO2 collection rates. Supplemental simulations varying average CO2 collection rates and initial background CO2 coupled with a 10% hydraulic gradient increase aided in parameterizing the model. A supplemental simulation using the average CO2 collection rate showed an approximately 46% increase in the estimated background CO2 (i.e., increased from 6.5 to 9.5 g m-3) if the collection rate changed from 0.00530 (+10%) to 0.00434 g hr-1 (-10%) over the 2-week collection period (Table 3). Assumptions for the ZOI model included negligible CO2 production attributable to CH degradation during the collection period and the uniform initial CO2 distribution to develop the final simulation (Fig. 7). The CO2 reaction rate may be underestimated for the study site.
Using CO2 production rate, CO2 attributable to CH degradation, and estimates from the ZOI model, the mass CH removal at each well per unit time was calculated. Data from Table 1 was used with the two end-member mixing model (eq (1)) to solve for fpet at each well. Because the site is only known to CH contamination and no other CO2 source was found within or near the site, CH degradation is assumed as the main contribute of CO2. The fpet ranged from 1 to 60% over the site (Table 4). The proportion was converted to carbon basis and multiplied by the CO2 production rate to calculate CH degradation rate (Table 4). Using the ZOI volume (Table 3), contaminant degradation rate per unit time and volume was determined (Table 4). This value ranged between 0 to 32 mg C m-3 d-1 (Table 4). CH degradation was lowest in regions of highest historical CH contamination (MW-25 - MW-30). At wells near the site periphery (near Sherman Road), the highest CH degradation was measured. CO2 production was higher in these areas, while fpet indicated significant CH turnover (Fig. 8).
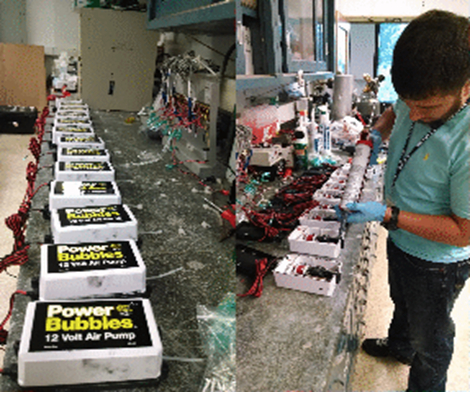
Figure 1. Sealing and preparing recirculation pumps. Sealing recirculation pumps for field deployment.
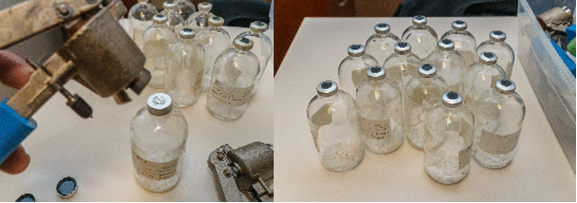
Figure 2. NaOH traps prepared for field deployment. 120 ml serum bottles with NaOH trap added and crimp sealed.
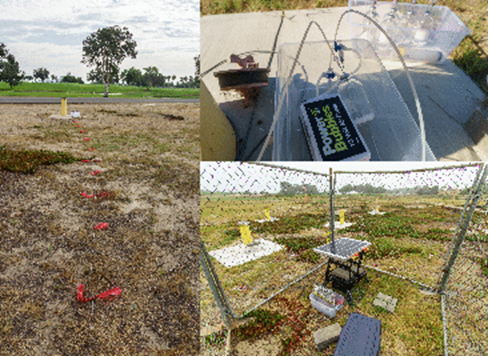
Figure 3. Field setup. Wire routed to outfitted wells (left), trap deployed at a well (upper right), and solar power distribution system (lower right). Wells are outfitted in the field with collection systems (including wiring, power distribution, and pump/traps).
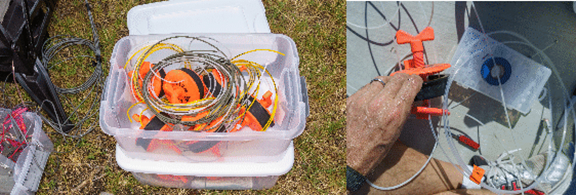
Figure 4. Modified well caps showing gas recirculation lines. This figure shows well caps modified with gas inlet and return lines.
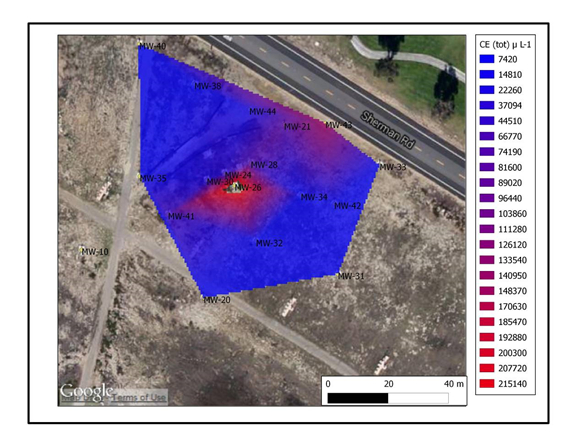
Figure 5. Historical chlorinated hydrocarbon contamination (µg L-1). This figure shows the historical chlorinated hydrocarbon contamination at the test site.
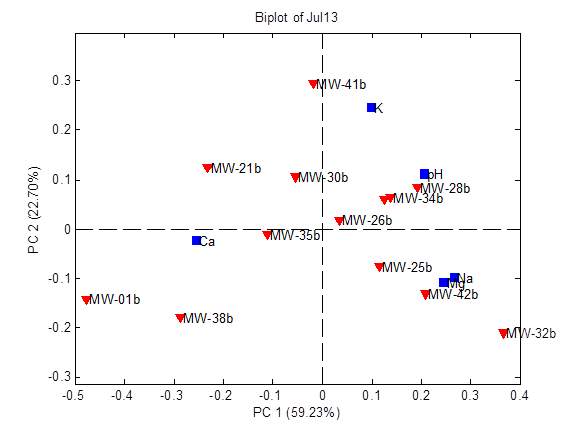
Figure 6. PCA bi-plot showing no co-correlation between dissolved cations and pH. This figure shows a bi-plot of the PCA scores and loadings created from hydrogeological data (pH and cations) for the test site.
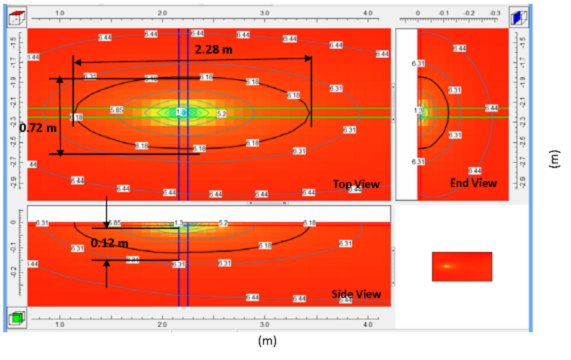
Figure 7. Calibrated ZOI model for the average CO2 collection rate (0.0048 g m-3). The calibrated background CO2 concentration was 6.5 g m-3, and the ZOI threshold concentration was 6.18 g m-3 (solid black line). Longitudinal and transverse diameters of the ZOI were 2.28 m and 0.72 m, respectively. Depth of the ZOI was 0.12 m. Modified from 18. This figure shows a graphical representation of the ZOI model in 3 dimensions.
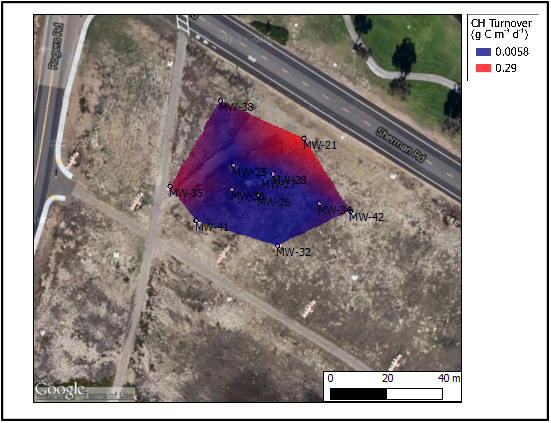
Figure 8. Contaminant degradation rate per unit time per unit area. Modified from 18. This is the interpolated degradation rate for CH over the study site over the time period sampled.
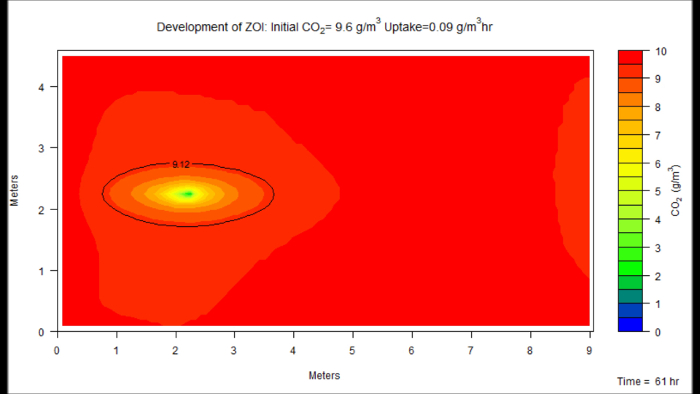
Video 1. Development of ZOI using MT3DMS23 - MODFLOW simulation (right click to download). Download, install, initialize and create simulation for the ZOI.
| Well | δ13C (‰VPDB) | Δ14C (‰) | Conventional Age (ybp) | Percent Modern C (pMC) |
| MW-01 | -34 | -147 | 1280 | 85 |
| MW-21 | -28 | -663 | 8730 | 34 |
| MW-25 | -23 | -153 | 1340 | 85 |
| MW-26 | -25 | -298 | 2845 | 70 |
| MW-27 | -18 | N.D.* | N.D.* | N.D.* |
| MW-28 | -25 | -190 | 1695 | 81 |
| MW-30 | -35 | -254 | 2365 | 75 |
| MW-32 | -20 | N.D.* | N.D.* | N.D.* |
| MW-34 | -32 | -283 | 2670 | 72 |
| MW-35 | -25 | -598 | 7320 | 40 |
| MW-38 | -32 | -354 | 3515 | 65 |
| MW-41 | -28 | -232 | 2125 | 77 |
| MW-42 | -23 | -482 | 5280 | 52 |
| *N.D. No data - pump leaking | ||||
Table 1. CO2 isotope measurements and conversions. CO2 Stable isotope and radiocarbon measurements and conversions to units used in the manuscript.
| Parameter | Units | Value | |
| Hydrology | |||
| Hydraulic Conductivity | ml hr-1 | 0.44 (aquifer) | |
| 10 (well) | |||
| Porosity (aquifer) | 0.48 (aquifer) | ||
| 0.99 (well) | |||
| Bulk Density | g cm-3 | 1.4 | |
| Specific Yield | cm3 cm-3 | 0.2 | |
| Hydraulic Gradient | m m-1 | 0.015 | |
| CO2 Solute Transport | |||
| Diffusion Coefficient | m2 hr-1 | 5.77 x 10⁻⁵ | |
| Longitudinal | m | 6.1 | |
| Dispersivity | |||
| Horizontal Transverse | m | 0.61 | |
| Dispersivity | |||
| Vertical Transverse | m | 0.061 | |
| Dispersivity | |||
| Soil Gas CO2 | % | 0.56 | |
Table 2. ZOI model parameters. Parameters used in the ZOI model and simulations.
| Collection Rate Level | Collection Rate | Background Concentration | ZOI Size | |||
| Longitudinal | Transverse | Depth | Volume | |||
| (g/hr) | (g/m3) | (m) | (m3) | |||
| Maximum | 0.0131 | 17.6 | 2.47 | 0.77 | 0.13 | 0.193 |
| Average | 0.0048 | 6.5 | 2.28 | 0.72 | 0.12 | 0.176 |
| Minimum | 0.0003 | 4 | 2.16 | 0.68 | 0.11 | 0.149 |
Table 3. ZOI model outputs. Model outputs for the ZOI. This table describes the three-dimensional volume for the ZOI.
| Well | fpet (%) | Contaminant degradation rate (mg C d-1 ±10%) | Contaminant degradation per unit time and volume (mg C m-3 d-1 ±15%) |
| MW-01 | 0 | N.A. | N.A. |
| MW-21 | 60 | 5.6 | 32 |
| MW-25¥ | 1 | 0 | 0 |
| MW-26 | 18 | 0.18 | 1 |
| MW-28 | 5 | 0.017 | 0.098 |
| MW-30 | 12 | 0.34 | 1.9 |
| MW-34 | 16 | 0.1 | 0.58 |
| MW-35 | 53 | 3.6 | 20 |
| MW-38 | 24 | 1.4 | 8.1 |
| MW-41 | 10 | 0.44 | 2.5 |
| MW-42 | 39 | 1.7 | 9.8 |
| N.A. Not applicable – MW-01 used as the background (e.g., no contamination) | |||
| ¥Assumed to be purely equilibrium-driven (e.g., no respiration) | |||
Table 4. Scaled contaminant degradation estimates. Estimates for contaminant degradation per unit time and unit volume for sampled wells.
Discussion
A protocol is described which aims to combine rate measurements, proportion mineralization from contaminant(s) and ZOI to determine overall site contaminant degradation. The critical components are, measuring CO2 production (mineralization when corrected) over time, concurrently collecting the respired CO2 in sufficient quantity (~ 1 mg) for AMS radiocarbon analysis providing amount derived from contaminant degradation, and, creating a ZOI model to relate the captured CO2 to a known volume of soil or groundwater (or both). These three main components are combined to arrive at an overall calculation at each sampling point for amount of contaminant degraded per unit volume per unit time (g m-3 d-1, for instance). Scaling the calculations, through repeated and geographically separated measurements (wells covering a site subsampled over longer time-scales), will allow site managers to estimate spatial and temporal degradation dynamics and respond appropriately to regulators and stakeholders.
The described protocol uses recirculating pumps or long-term deployed passive samplers (a strategy currently under development) to trap out CO2 from well headspace gas. The reason is several fold. Primarily, sufficient CO2 must be collected in order to obtain radiocarbon measurements (~1 mg). Respiration rates can be measured using surface soil:air exchange traps or by using soil respiration instruments (Licor flux chamber for instance). These methods suffer from the need to asynchronously gather sufficient CO2 for radiocarbon analysis — thus perhaps biasing the measurement. For instance, a flux chamber can be outfitted to measure soil:air CO2 exchange while accounting for influx of atmospheric CO217. Unless respiration rates are high, ample CO2 for radiocarbon measurements may not be trapped. In this case, samples can be taken from large soil gas samples or from groundwater (with DIC)12. Furthermore, measuring CO2 flux at the soil:air surface is subject to influx from the atmosphere lateral to the flux chamber or trap. Sampling well headspace "isolates" the signal to the region of contamination (depending on well installation to some degree) but is suitably removed from atmospheric influx (and atmospherically-generated modern 14CO2). The main difficulty is sampling from the well without having to open it in order to change traps (for temporal sampling).
Using recirculating pumps allows one to sample well headspace and change CO2 traps at regular intervals without having to expose the sample location to atmospheric 14CO2. It also allows one to sample considerable CO2 which can then be analyzed for flux and natural radiocarbon content. The recirculation protocol is not without difficulty. A major problem is delivering ample power to run pumps continuously in the field. For the initial experiment (described here), solar panels provided enough energy to run pumps for each two-week period. Voltage logs showed that after several days, solar power could not keep up with the needed power and pumps were not operational for several hours each day. This was immaterial to the flux modeling and overall collection, but highlights the difficulty in providing ample power to field-deployed hardware. In currently-running collections, power to pumps has been interrupted by ground crews mowing in the monitoring well field. Several power lines have been severed. We are currently evaluating headspace-deployed passive CO2 traps which could be lowered into the well and retrieved at a later date with absorbed CO2. A risk-benefit analysis is underway (the risk mostly derived from having to open the well head and allow in atmospheric 14CO2).
The technique's main limitations are not being able to distinguish the exact respiration source in mixed contaminant systems and not being able to account for intermediate carbon-based degradation products (i.e., DCE, VC, methane). For instance, at the current site, there was historical fuel hydrocarbon contamination in addition to CH contamination. CHs are almost exclusively made from petroleum feedstocks. At the described site, CH is primarily isolated in the region studied - while some residual petroleum evidently exists to the North. No petroleum was found in wells sampled for this work. However, at a mixed contaminant site, the overall mineralization rate might be difficult to tie to one individual or class of contaminants. Using this method, one can quantify the complete CH degradation (to CO2). If, the contaminant carbon is converted to CH4 (anaerobic conditions), the CH4 may be "lost" if it diffuses away from the ZOI. That carbon will likely be converted to CO2 within oxic portions in the vadose zone. If this does not occur within the ZOI, the reported method will not account for it. In this case, the described method can be considered a conservative estimator, which from a regulatory perspective, is desirable. Additionally, the ZOI modeling is not without uncertainty. Simulations are based on "singular" values such as porosity and bulk density which are measured in subsamples assumed to be homogenous — but in reality are heterogeneous at the macro- and microscales. A perceived limitation may be the analysis cost for natural abundance radiocarbon (which can be as much as $600 per sample). The definitive nature of the information gathered from radiocarbon makes the cost very low in reality. With several well-chosen samples, one can determine if substantial remediation is occurring. If, for instance the CO2 associated with a contaminant plume is radiocarbon-depleted relative to a background site10. A site with low ambient pH (> ~4.8) and considerable limestone (CaCO3) may be a poor candidate for applying this technique. Ancient carbonate deposits might dissolve in low pH and bias the analysis.
The technique's significance is considerable, as a sole measurement type (natural abundance radiocarbon) can immediately be used to confirm in situ conversion of contaminant to CO2. This analysis is definitive. Radiocarbon cannot become depleted except through radioactive decay - which is constant despite physical, chemical or biological alteration of any starting material. Static radiocarbon measurements (for instance DI14C) can be made on batch samples and immediately confirm if 14C-depleted CO2 is prevalent at a site (irrefutably indicating contaminant mineralization to CO2). This information alone is incredibly valuable to site managers as without it, they are required to use numerous indirect lines of evidence to infer that contaminant mineralization is occurring. No other single measurement can provide a concrete connection between carbon-based contaminant and the carbon-containing CO2 produced through complete degradation.
Future applications are currently underway in which our group will increase sampling temporal resolution to encompass an entire year. By collecting CO2 and determining the mineralization rate(s) over the spatial extent of the site, we will be able to refine models for contaminant degradation over time. This information is critically needed by site managers in order to most effectively manage contaminated sites. In limited use, regulators at three sites where the technique has been applied have recognized the methods definitive results. This has led to cost savings and helped to guide remedial alternatives.
Disclosures
The authors declare that they have no competing financial interests
Acknowledgements
Financial support for this research was provided by the Strategic Environmental Research and Development Program (SERDP ER-2338; Andrea Leeson, Program Manager). Michael Pound, Naval Facilities Engineering Command, Southwest provided logistical and site support for the project. Brian White, Erika Thompson and Richard Wong (CBI Federal Services, Inc) provided on-site logistical support, historical site perspective and relevant reports. Todd Wiedemeier (T.H. Wiedemeier & Associates) provided documentation, discussion and historical site perspectives.
Materials
| Name | Company | Catalog Number | Comments |
|---|---|---|---|
| Air pump; Power Bubbles 12 V | Marine Metal | B-15 | |
| Marine Sealant | 3M | 5200 | for sealing pumps |
| Silicone Sealant | Dap | 08641 | for sealing pumps |
| Tubing for gas recirculation | Mazzer | EFNPA2 | |
| Stopcocks (for gas lines) | Cole-Parmer | 30600-09 | for assembling gas lines |
| Male Luer lock fittings | Cole-Parmer | WU-45503-00 | for assembling gas lines |
| Female Luer lock fittings | Cole-Parmer | EW-45500-00 | for assembling gas lines |
| 4" Lockable J-Plug well cap | Dean Bennett Supply | NSN | 2" if smaller wells |
| HOBO 4-Channel Pulse Data Logger | Onset | UX120-017 | Older model no longer available. Use to monitor pump operation |
| Serum bottles 100 ml (cs/144) | Fisher Scientific | 33111-U | For CO2 traps |
| Septa (pk/100) | Fisher Scientific | 27201 | For CO2 traps |
| Coulometry | |||
| Anode solution | UIC, Inc | CM300-001 | |
| Cathode solution | UIC, Inc | CM300-002 | |
| For IC analysis | |||
| Dionex Filter Caps 5 ml 250/pk | Fisher Scientific | NC9253179 | Caps for IC |
| Dionex 5 ml vials, 250/pk | Fisher Scientific | NC9253178 | Vials for IC |
| If using solar power | |||
| Renogy Solar Panel kit(s) | Renogy | KT2RNG-100D-1 | Bundle provides 200 W |
| VMAX Solar Battery | VMAX | VMAX800S | For energy storage |
References
- In situ bioremediation: When does it work. National Research Council. , National Academy of Sciences. Washington, DC. 1-207 (1993).
- Vangelas, K. M. Summary Document of Workshops for Hanford, Oak Ridge and Savannah River Site as part of the Monitored Natural Attenuation and Enhanced Passive Remediation for Chlorinated Solvents - DOE Alternative Project for Technology Acceleration. , U.S. Department of Energy, Westinghouse Savannah River Company. Aiken, SC. 1-89 (2003).
- Wiedemeier, T. H., et al. Technical Protocol for Evaluating Natural Attenuation of Chlorinated Solvents in Ground Water. , USEPA Office of Research and Development. Washington, DC. 1-248 (1998).
- Wilson, J. T., Kampbell, D. H., Ferrey, M., Estuestra, P. Evaluation of the Protocol for Natural Attenuation of Chlorinated Solvents: Case Study at the Twin Cities Army Ammunition Plant. , USEPA Office of Research and Development. Washington, DC. 1-49 (2001).
- Elsner, M., et al. Current challenges in compound-specific stable isotope analysis of environmental organic contaminants. Analytical and Bioanalytical Chemistry. 403 (9), 2471-2491 (2012).
- Meckenstock, R. U., Griebler, C., Morasch, B., Richnow, H. H. Stable isotope fractionation analysis as a tool to monitor biodegradation in contaminated acquifers. Journal of Contaminant Hydrology. 75 (3-4), 215-255 (2004).
- Kirtland, B. C., Aelion, C. M., Stone, P. A. Assessing in situ mineralization of recalcitrant organic compounds in vadose zone sediments using δ13C and Δ14C measurements. Journal of Contaminant Hydrology. 76 (1-2), 1-18 (2005).
- Kirtland, B. C., Aelion, C. M., Stone, P. A., Hunkeler, D. Isotopic and Geochemical Assessment of in Situ Biodegradation of Chlorinated Hydrocarbons. Environmental Science and Technology. 37 (18), 4205-4212 (2003).
- Aelion, C. M., Kirtland, B. C., Stone, P. A. Radiocarbon assessment of aerobic petroleum bioremediation in the vadose zone and groundwater at an AS/SVE site. Environmental Science and Technology. 31 (12), 3363-3370 (1997).
- Boyd, T. J., Pound, M. J., Lohr, D., Coffin, R. B. Radiocarbon-depleted CO2 evidence for fuel biodegradation at the Naval Air Station North Island (USA) fuel farm site. Environmental Science: Processes & Impacts. 15 (5), 912-918 (2013).
- Coffin, R. B., et al. Radiocarbon and Stable Carbon Isotope Analysis to Confirm Petroleum Natural Attenuation in the Vadose Zone. Environmental Forensics. 9 (1), 75-84 (2008).
- Sihota, N. J., Ulrich Mayer, K. Characterizing vadose zone hydrocarbon biodegradation using carbon dioxide effluxes, isotopes, and reactive transport modeling. Vadose Zone Journal. 11, (2012).
- Sihota, N. I., Singurindy, O., Mayer, K. U. CO2-Efflux Measurements for Evaluating Source Zone Natural Attenuation Rates in a Petroleum Hydrocarbon Contaminated Aquifer. Environmental Science & Technology. 45 (2), 482-488 (2011).
- Norman, J. M., et al. A comparison of six methods for measuring soil-surface carbon dioxide fluxes. J. Geophys. Res. 102 (24), 28771-28777 (1997).
- Amos, R. T., Mayer, K. U., Bekins, B. A., Delin, G. N., Williams, R. L. Use of dissolved and vapor-phase gases to investigate methanogenic degradation of petroleum hydrocarbon contamination in the subsurface. Water Resources Research. 41 (2), 1-15 (2005).
- Molins, S., Mayer, K. U., Amos, R. T., Bekins, B. A. Vadose zone attenuation of organic compounds at a crude oil spill site - Interactions between biogeochemical reactions and multicomponent gas transport. Journal of Contaminant Hydrology. 112 (1-4), 15-29 (2010).
- McCoy, K., Zimbron, J., Sale, T., Lyverse, M. Measurement of Natural Losses of LNAPL Using CO2 Traps. Groundwater. , (2014).
- Boyd, T. J., Montgomery, M. T., Cuenca, R. H., Hagimoto, Y. Combined radiocarbon and CO2 flux measurements used to determine in situ chlorinated solvent mineralization rate. Environmental Science: Processes & Impacts. , (2015).
- Winslow, S. D., Pepich, B. V., Bassett, M. V., Wendelken, S. C. Microbial inhibitors for US EPA drinking water methods for the determination of organic compounds. Environmental Science and Technology. 35 (20), 4103-4110 (2001).
- Johnson, K. M., Sieburth, J. M., Williams, P. J. lB., Brändström, L. Coulometric total carbon dioxide analysis for marine studies: Automation and Calibration. Mar.Chem. 21 (2), 117-133 (1987).
- Dickson, A. G. Standards for ocean measurements. Oceanography. 23 (3), 34-47 (2010).
- Stuiver, M., Polach, H. A. Discussion: Reporting of 14C Data. Radiocarbon. 19 (3), 355-363 (1977).
- Zheng, C., Wang, P. P. MT3DMS: A modular three-dimensional multispecies transport model for simulation of advection, dispersion, and chemical reactions of contaminants in groundwater systems; documentation and user's guide. , DTIC. DTIC Document (1999).
- Harbaugh, A. W. MODFLOW-2005, the US Geological Survey modular ground-water model: The ground-water flow process. , US Department of the Interior, US Geological Survey. (2005).
- Winston, R. B. Ground Water - Book 6. Vol. Techniques and Methods. , U.S. Geological Survey. 6-A29 Ch. 29 (2009).
- Semi-Annual Post-Closure Maintenance Report for Calendar Year 2011 Installation Restoration (IR) Program Site 2 (Old Spanish Bight Landfill), Site 4 (Public Works Salvage Yard), and Site 5, Unit 1 (Golf Course Landfill). , Accord Engineering Inc. San Diego, CA. (2011).
- Annual Progress Report October 2010 to December 2011, Operable Unit 24. , Geosyntec Consultants. Columbia, MD. (2012).
Reprints and Permissions
