Here we present methodology for the production of a focal stroke in murine white matter by local injection of an irreversible endothelial nitric oxide synthase (eNOS) inhibitor (L-Nio). Presented are two stereotactic variations, retrograde neuronal tracing, and fresh tissue labeling and dissection that expand the potential applications of this technique.
Method Article
A Versatile Murine Model of Subcortical White Matter Stroke for the Study of Axonal Degeneration and White Matter Neurobiology
In This Article
Summary
Abstract
Stroke affecting white matter accounts for up to 25% of clinical stroke presentations, occurs silently at rates that may be 5-10 fold greater, and contributes significantly to the development of vascular dementia. Few models of focal white matter stroke exist and this lack of appropriate models has hampered understanding of the neurobiologic mechanisms involved in injury response and repair after this type of stroke. The main limitation of other subcortical stroke models is that they do not focally restrict the infarct to the white matter or have primarily been validated in non-murine species. This limits the ability to apply the wide variety of murine research tools to study the neurobiology of white matter stroke. Here we present a methodology for the reliable production of a focal stroke in murine white matter using a local injection of an irreversible eNOS inhibitor. We also present several variations on the general protocol including two unique stereotactic variations, retrograde neuronal tracing, as well as fresh tissue labeling and dissection that greatly expand the potential applications of this technique. These variations allow for multiple approaches to analyze the neurobiologic effects of this common and understudied form of stroke.
Introduction
Stroke affecting the subcortical white matter is a common clinical entity, accounting for up to 25% of clinical strokes annually in the US 1. Ischemic damage to white matter also occurs silently at a significantly higher rate and contributes to the development of vascular dementia 2,3. Presently, patients with this form of cerebral ischemia have few, if any treatment choices. Despite the clinical importance of this disease, few clinically relevant animal models exist 4,5.
The goal of this protocol is to produce a focal ischemic lesion within the murine white matter. This murine model of human disease allows the specific study of axonal injury response to stroke and how the cellular elements of white matter, namely oligodendrocytes and astrocytes along with axons, respond to and repair after stroke.
Previous reports have described a model of subcortical white matter stroke using endothelin-1 (ET-1) 6 that is similar to the one described here. Several key changes to the experimental protocol have been made thereby the potential uses of this model have expanded 7,8. This protocol provides a reliable and modifiable strategy to produce a focal stroke within mouse brain white matter.
The major advantages of this model are the use of a chemical endothelial nitric oxide synthase (eNOS) inhibitor N(5)-(1)-iminoethyl-L-ornithine HCl (L-Nio) 9 with no known paracrine effects on cellular elements of white matter which had been a complication of models using endothelin-1 10. In addition, the stereotactic targeting of white matter in the mouse allows the use of any variety of transgenic or knockout strains, greatly expanding the available tools to determine the effect of stroke on brain white matter. Here, two variations on this technique are described and demonstrate some of the additional variations that can be utilized to enhance the understanding of axonal and white matter damage and repair after stroke.
Protocol
The use of animals in this protocol has been performed in accordance with procedures approved by the University of California Los Angeles Animal Care and Use Committee.
Note: Begin by identifying the target murine population. In prior studies, only male wild-type C57/Bl6 mice have been used, however various transgenic or knockout mice can also be used. Note that stereotactic coordinates are based on C57/Bl6 anatomy. It is recommended that each user initially verify localization of the stroke to white matter.
1. White Matter Stroke Induction - Medial Angled Approach
- Begin by preparing a pulled glass pipette using 0.5 mm capillary tube such that the distal diameter is between 15-25 µm 11.
- Prepare a sterile 10 µl aliquot of L-Nio (N(5)-(1)-iminoethyl-L-ornithine HCl) at 27.4 mg/ml (130 µM) in sterile 0.9% normal saline.
- Pre-fill the pulled glass pipette with a small volume of L-Nio (2-5 µl) by affixing the glass pipette to tubing connected to a vacuum line. Lay the pipette flat on the bench top and insert the pulled end into the L-Nio solution.
- Apply the vacuum until at least 2 mm of the 0.5 mm portion of the pipette is filled. Turn off the vacuum and withdraw the pipette. Place it aside until Step 1.12.
- Place the mouse in an induction chamber and induce anesthesia of the mouse using standard 32% isoflurane flowed through a vaporizer (5 L/min inhaled with 5 L/min oxygen and 0.5 L/min N2) for 1 min or until deeply anesthesized. Transfer the mouse to a stereotactic apparatus equipped with a stereotactic microscope. Provide maintenance anesthesia using 32% isoflurane flowed through a vaporizer (2 L/min inhaled with 5 L/min oxygen and 0.5 L/min N2) and a nose cone. Check depth of anesthesia with a toe pinch.
- Adjust the injection arm to 36°.
- Affix a pulled glass pipette holder to the distal end of a low volume pressure injection system and attach it to the injection arm of the stereotactic setup.
- Coat the anesthetized animal's whiskers with petroleum jelly and place artificial tear ointment over both eyes. Prepare a sterile surgical field by placing a sterile drape over the animal's head with a 5-10 cm opening over the head. Prepare an aspetic surgical surface by shaving the fur overlying the skull. Clean the scalp with alternating betadine and 70% alcohol swabs.
- Make a 1.5 cm midline scalp incision with sterile fine scissors to expose the skull surface. Dry the skull with a sterile cotton swab and using a stereotactic microscope at 1-3X magnification, remove any overlying periosteal tissue using a sterile micro point tool.
- Mark the Bregma as a reference point using a fine point marker.
- Drill a 2 mm ellipitical craniotomy using a sterile fine stip surgical drill bit beginning posteriorly at the Bregma and extending anteriorly just left of the midline. Remove bone fragments and overlying soft tissue so that the cerebral cortex can be visualized.
- Keep the surgical field and cortical surface moist by intermittently applying drops of sterile saline.
- Affix a pulled glass pipette to the injector arm of the stereotactic apparatus. Align the distal end of the pipette with the Bregma and zero the stereotactic coordinates.
- Advance the pipette to the first anterior/posterior (A/P) and medial/lateral (M/L) coordinates provided in Table 1.
- Advance the pipette to the cortical surface and zero the dorsal/ventral (D/V) measurement.
- Slowly pass the pipette into the brain until reaching the first D/V coordinate in Table 1.
- Using a low volume pressure injection system set at 20 psi for 20 msec pulses, inject 100 nl of L-Nio into the brain and wait 5 min to prevent reflux up the pipette track.
- Use a calibrated reticle in the eyepiece of the stereotactic microscope and a magnification of 3X.
- Accordingly, displace a total of 0.100 mm3 (0.5 mm length in a 0.5 mm diameter pipette, corresponding to 100 nl) from the pulled glass pipette for each set of coordinates. By using an reticule, measure and standardize since each set up varies depending on the magnification and scales used.
- For accurate volume measurement during each injection, approach the angled pipette with the microscope from the side so that the air-fluid meniscus has a sagittal view. The meniscus should appear in the same focal plane of both the inner and outer wall of the pipette.
- Slowly withdraw the pipette and repeat steps 1.13-1.16.3 at the second and third set of coordinates provided in Table 1.
- After the final injection, remove the pipette and place enough bone wax to fill the craniotomy site. Approximate the edges of the scalp wound and bind with dermal adhesive.
- Inject 0.1 ml of 0.5% Marcaine into the wound margins using a sterile 30 G needle to prevent to prevent local pain associated with the scalp incision.
- Return the animal to housing and supply post-operative antibiotics (0.48 mg/ml trimethoprim-sulfamethoxazole, or 0.5 mg/ml Levofloxacin) in the drinking water for 5 days.
2. White Matter Stroke Induction - Posterior Angled Approach
- Perform steps 1.1-1.12 as in the medial angled approach protocol, except adjust the injection arm of the stereotactic setup to 45 degrees oriented anterior to posterior.
- Advance the pipette to the first A/P and M/L coordinates provided in Table 2.
- Complete remaining steps 1.14-1.20 as in the lateral angled approach protocol.
3. Retrograde Neuronal Labeling
- Prepare a sterile 10 µl aliquot of L-Nio at 54.8 mg/ml in 0.9% normal saline.
- Prepare a sterile aliquot of 20% Fluororuby (or 20% biotinylated dextran amine or 2% Fluorogold) in 0.9% normal saline.
- Dilute together 1:1 for final concentrations of 27.4 mg/ml L-Nio and 10% Fluororuby.
- Perform the stroke protocol as above in steps 1.3-1.23.
- Visualize the natively fluorescent tracer in tissue section by perfusion fixation, cryosectioning and microscopy as previously described8.
4. Tissue Processing for Immunofluorescence
- At an appropriate post-stroke interval ranging from 3 hr to 14 days after stroke, euthanize mice via isoflurane overdose or local IACUC approved procedure.
- Open the thoracic cavity using angled scissors and insert a 23 G butterfly needle into the left ventricle.
- Place a small cut in the right atrium using fine scissors to allow an outflow track for the perfusion fluid.
- Transcardially perfuse with 30-40 ml of cold phosphate-buffered saline followed by 30-40 ml of cold 4% paraformaldehyde at a rate of 10 ml/min at RT.
- Decapitate the mouse and remove the brain using sterile scissors to open the skull posteriorly and then gently remove the overlying skull with a spatula, place the brain into cold 4% PFA for 24 hr, and then transfer to 30% sucrose in PBS for 48 hr.
- Prepare forty micron floating sections using a cryostat and perform antibody processing as previously described 6-8. In this study, use the following antibodies: rabbit anti-neurofilament 200 (1:500 dilution); rabbit anti-vimentin (1:500); goat anti-GFAP (1:500); rabbit anti-Iba-1 (1:1,000).
5. Tissue Processing for Protein or RNA Analysis
- At an appropriate post-stroke interval ranging from 3 hr to 14 days after stroke, euthanize via isoflurane overdose or local IACUC approved procedure.
- Decapitate the mouse and remove the brain using sterile scissors to open the skull posteriorly and then gently remove the overlying skull with a spatula.
- Insert a sterile 4 mm spatula at the front of the brain to sever the olfactory bulb and optic nerves. Gently lift the brain out of the calvarium and place into ice-cold dissection buffer (1x Hank's Balanced Salt Solution, 25 mM HEPES-KOH, pH 7.4, 35 mM glucose, 4 mM sodium bicarbonate, and 0.01 mg/ml cyclohexamide).
- Using a brain block and sterile new razor blades, prepare 2-3 mm slabs containing the stroke and place into cold dissection buffer.
- Under a dissecting microscope, identify the white matter underlying motor cortex in the injected hemisphere. At longer post-stroke intervals, the region may be visually identified by focal necrosis and myelin pallor.
Note: At earlier post-stroke intervals, injection of L-Nio mixed with 1 µl of 10% Fast Green can allow visual identification of the stroke (Figure 4A). - Under guidance of a dissecting microscope and using a fresh scalpel, carefully dissect the region of white matter containing the stroke, identified by either Fast Green labeling or tissue loss. Remove overlying cortex and underlying striatum as desired.
Results
Using the model presented, the white matter underlying forelimb sensorimotor cortex can reliably be targeted. This chemically induced stroke model produces focal axonal and myelin loss, astrocytosis, and microgliosis (Figure 1), as is typically seen in human lacunar infarcts. By using three injections, a clinically useful model is established with early impairment on forelimb motor tasks 7 and a small but significant portion of brain tissue experiences ischemia that immunohistochemical, immunofluorescent, and biochemical techniques are feasible and reliable at the quantitative level. At early time points (hr) after stroke induction, changes in axonal molecular organization can be detected (Figure 2). At 7 days, the stroke completes its maturation to a circumscribed area of axonal loss (Figure 1a). In our hands, this method produces a focal white matter lesion approximately 800 µm in horizontal diameter and extending approximately 1 mm along the anterior-posterior axis of the corpus callosum. By 7 days, the average total infarct size is roughly 0.200 mm3 and will have an elliptical shape. We have observed approximately 10% variability in stroke size both between animals and between sections, dependent on where in the ellipse the section occurs. Further growth in the size of the infarct is rarely seen beyond 7 days.
The addition of a simultaneous injection of dextran amine results in significant neuronal labeling in layer 5 and layer 6 neuronal cell bodies that have axons projecting through the region of stroke (Figure 3). Overlying cortical neurons that are not damaged by the sham aspects of the procedure (passage of fine needle), undergo distal axonal damage and can be identified by the inclusion of a tracer with the L-Nio preparation. This approach was used to demonstrate dynamic changes in the axon initial segment after stroke 8.
While the small size of the region of tissue affected by the stroke limits the use of other common techniques such as 2,3,5-triphenyltetrazolium chloride (TTC) staining, the white matter stroke region can be identified in fresh tissue. The addition of a common dye such as Fast Green produces an identifiable region of tissue that can be dissected under a dissecting microscope (Figure 4). Once dissected this tissue can be used for protein analysis with western blot or immunoprecipitation, or for RNA isolation and analysis (Figure 4C). Through the use of various transgenic mouse lines, a variety of innovative approaches can be used to study the neurobiology after focal white matter stroke including cell fate mapping studies and laser capture microdissection (Figure 4C).
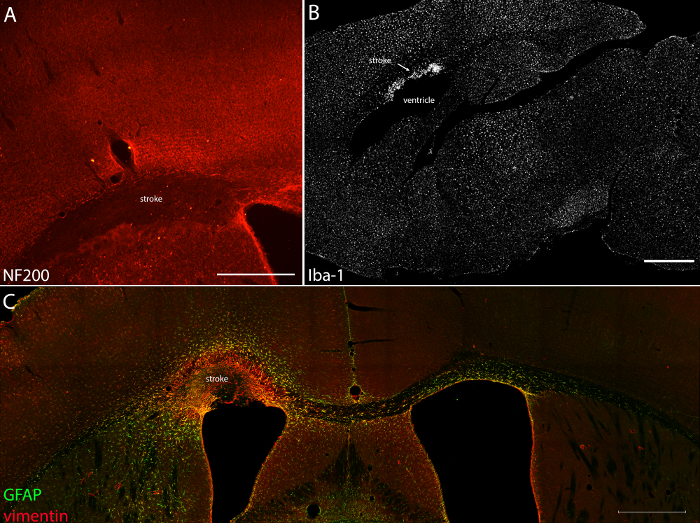
Figure 1: Focal White Matter Stroke Using Both Medial and Posterior Angled Approaches. Immunofluorescent labeling for neurofilaments (A, red) demonstrates the degree of axonal loss seven days after stroke using the medial approach. Using the posterior angled approach, the white matter stroke lesion is targeted just above the lateral ventricle (B, C) and shows intense microglial (B) and astrocytic reactivity (C). Two astrocyte intermediate filament markers, vimentin (red) and glial fibrillary acidic protein (GFAP, green), both reveal changes in morphology of white matter (fibrous) astrocytes after stroke (C). Scale bars = 500 μm. Please click here to view a larger version of this figure.
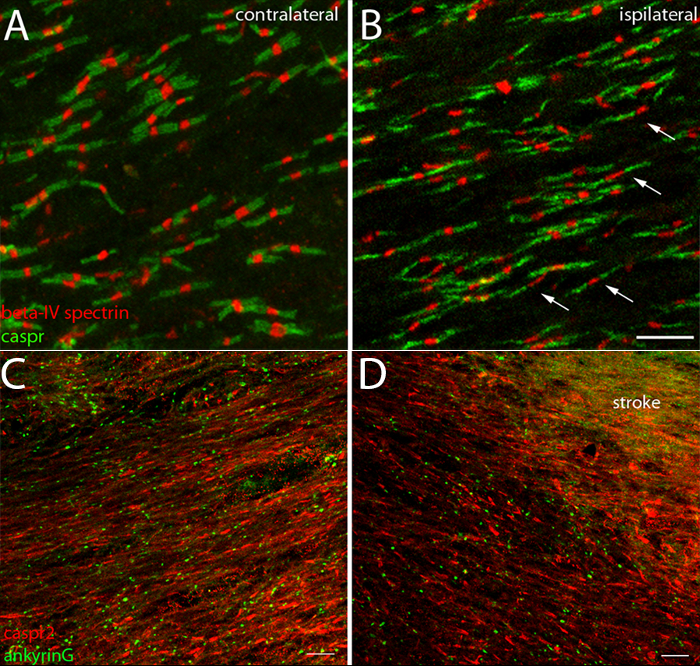
Figure 2: White Matter Stroke Alters Axonal Microdomain Organization. Within 3 hr of white matter stroke induction, axonal microdomain organization at the node, marked by beta-IV spectrin (red) and at the paranode, marked by contactin-associated protein (caspr, green), is disrupted (arrows, B). Contralateral white matter axons show regular nodal, paranodal, and juxtaparanodal organization (A and C) while the ipsilateral white matter shows nodal and paranodal elongation that is typical of axons with lost axoglial contact (B and D). Scale bar = 5 μm.
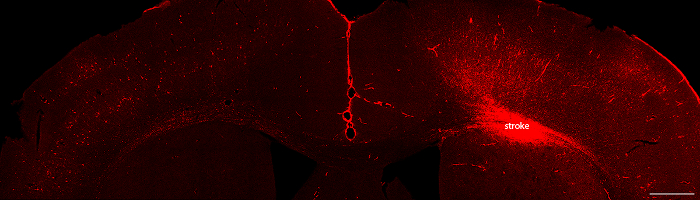
Figure 3: Retrograde Neuronal Labeling with White Matter Stroke Identifies Individual Neurons with Axonal Damage. Co-injection of fluorescent dextran amine (red) at the time of stroke induction allows identification of individual neurons with axons injured by stroke. Most of the labeling occurs in axons within Layer 5 and 6 neurons in primary sensorimotor cortices overlying the stroke. Image represents 7 days after stroke. Scale bar = 500 μm. Please click here to view a larger version of this figure.
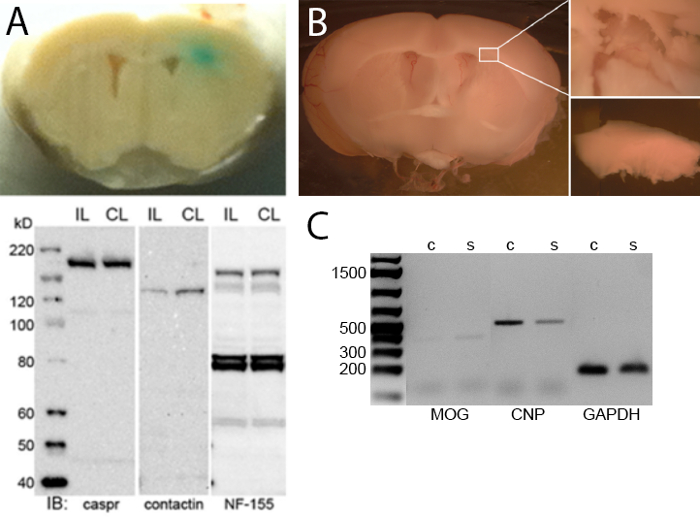
Figure 4: Microdissection of White Matter Stroke Lesions for Use in Biochemical and Transcriptional Assays. Co-injection of Fast Green at the time of stroke induction allows early identification of the injured region at 24 hr (A, upper panel). Immunoblotting for specific axonal proteins can be performed to demonstrate reductions in the region of stroke alone (A, lower panel). At longer time points, the region of white matter stroke (left panel) can be focally dissected without specific labeling (B). Right upper panel shows region of white matter after removal of dissected region while the lower right panel shows the dissected region of white matter containing the stroke (B). PCR for oligodendrocyte-specific genes using RNA isolated from dissected regions from the white matter (C). IL = ipsilateral; CL = contralateral; c = control; s = stroke.
| Injection | Anterior/Posterior | Medial/Lateral | Dorsal/Ventral |
| 1 | 0.22 | 0.22 | -2.10 |
| 2 | 0.70 | 0.15 | -2.16 |
| 3 | 1.21 | 0.15 | -2.18 |
Table 1: Stereotactic Coordinates for Lateral Angled Approach (in mm).
| Injection | Anterior/Posterior | Medial/Lateral | Dorsal/Ventral |
| 1 | -0.75 | -0.96 | -2.10 |
| 2 | -1.00 | -0.96 | -2.05 |
| 3 | -1.25 | -0.96 | -2.00 |
Table 2: Stereotactic Coordinates for Posterior Angled Approach (in mm).
Discussion
A number of prior models of subcortical stroke have been described including focal injections of endothelin-1 into the internal capsule, subcortical white matter and striatum in the rat 12-14 and mouse 6,15. More recent models of small focal strokes have utilized cholesterol microemboli injection in the carotid artery 16 and photothrombotic occlusion of a single penetrating arteriole 17. Each of these models has both advantages and disadvantages 5. The presently described model produces a lesion that has a number of characteristics that mimic human lacunar infarction including axonal abnormalities and loss, myelin degradation, a focal necrotic core and a clinical deficit that is minimal and demonstrates fairly rapid recovery dependent on age 7. Targeting murine white matter allows a wide variety of genetic manipulations that can support mechanistic studies.
The critical steps of the protocol include utilizing accurate stereotactic coordinates. Because murine white matter is small in size and varies from strain to strain, revision of the stereotactic coordinates may be needed depending on the age and strain of mouse used. Control of the volume of injection is also important as this is directly correlated to the size of the infarct. Larger injections will produce larger strokes that encroach on overlying cortex and underlying striatum.
Focal injection of ET-1 using the approach described here has been reported but endothelin-1 was shown to have direct paracrine effects on oligodendrocyte differentiation and maturation 10,18 confounding the study of post-stroke white matter biology. In contrast, the L-Nio approach targets endothelial cells alone while producing an identical lesion and eliminates any confounding paracrine effects on the cells involved in injury response. L-Nio is not directly cytotoxic and the selected dose was determined by preliminary dose escalation experiments (data not shown). The posterior angled approach was developed to more precisely undercut axons from primary motor cortex producing the maximal behavioral deficit that can be attributed to white matter injury. The medial angled approach also damages motor cortex axons but extends more laterally and involves axons underlying primary sensory cortex.
The stroke lesion expands fairly rapidly over the first 24 hr. By seven days, the size of the infarct is maximal and we have not observed significant lesion growth beyond that time. Additional cellular events and axonal degeneration will occur beyond this initial stage but the infarct size as measured by the necrotic core will not change significantly in the absence of any intervention.
Co-injection of neuroanatomical tracers at the time of stroke identifies neurons experiencing ischemic axonal injury. Using either the medial or posterior angled approach, the neuronal cell bodies with damaged axonal projections remain unharmed. This creates a useful model to study the effect of ischemic axotomy on central nervous system neurons. We have utilized primarily retrograde tracers including dextran amine and fluorogold, which both show excellent uptake by stroke-damaged axons. By employing the wide variety of transgenic and knock-out mouse lines, users of this protocol can investigate the specific role of neuronal genes involved in white matter stroke injury response and repair.
Acknowledgements
SN and MDD received support from NIH K08 NS083740 and the UCLA Department of Neurology. AJG acknowledges support by the Dr. Miriam and Sheldon G. Adelson Medical Research Foundation and the Larry L. Hillblom Foundation. KLN gratefully acknowledges support from the American Heart Association 14BFSC17760005 ASA-Bugher Stroke Center. ILL, EGS and STC were supported by NIH R01 NS071481. JDH acknowledges support from NIH K08 NS083740.
Materials
| Name | Company | Catalog Number | Comments |
|---|---|---|---|
| L-N5-(1-Iminoethyl)ornithine, Dihydrochloride | Calbiochem | 400600-20MG | |
| Isoflurane | Phoenix Pharmaceutical, Inc. | NDC 57319-559-06 | |
| Capillary tubes | World Precision Instruments | 50-821-807 | |
| Picospritzer | Parker Instrumentation | Picospritzer II | |
| Stereotactic setup | Kent Scientific | KSC51725 | |
| Pipette puller | KOPF | Model 720 | |
| Stereomicroscope SZ51 | Olympus | 88-124 | |
| Fine scissors | Fine Scientific Tools | 14084-08 | |
| Forceps | Harvard Apparatus | PY2 72-8547 | |
| Curved Forceps | Harvard Apparatus | PY2 72-8598 | |
| Blunt dissection tool | Fine Scientific Tools | 10066-15 | |
| Drill | Dremel | 8220-1/28 | |
| Drill bits | Fine Scientific Tools | 19007-05 | |
| Vetbond | 3M | 1469SB | |
| Marcaine | HOSPIRA | NDC 0409-1610-50 | |
| Trimethoprim-Sulfamethaxole | STI Pharmacy | NDC 54879-007-16 | |
| Fluororuby | Fluorochrome Inc | 30 mg | |
| Paraformaldehyde | Fisher | O4042-500 | |
| Sucrose | Fisher | BP220-10 | |
| Cryostat | Leica CM3050 S | 14047033518 | |
| Glass slides | Fisher | 12-544-7 | |
| Fast Green | Sigma | F7252-5G | |
| Dissection microscope | Nikon | SMZ1500 | |
| 23 G butterfly needle | Fisher | 14-840-35 | |
| 10x Hank's Balanced Salt Solution | Life Technologies | 14065056 | |
| 1 M HEPES-KOH, pH 7.4 | Affymetrix | 16924 | |
| D-Glucose | Sigma | G8270 | |
| Sodium bicarbonate | Sigma | S5761 | |
| Cyclohexamide | Sigma | 01810 |
References
- Go, A. S., et al. Heart disease and stroke statistics--2014 update: a report from the American Heart Association. Circulation. 129, 28-292 (2014).
- Saini, M., et al. Silent stroke: not listened to rather than silent. Stroke. 43, 3102-3104 (2012).
- Koton, S., et al. Burden and outcome of prevalent ischemic brain disease in a national acute stroke registry. Stroke. 44, 3293-3297 (2013).
- Jiwa, N. S., Garrard, P., Hainsworth, A. H. Experimental models of vascular dementia and vascular cognitive impairment: a systematic review. J Neurochem. 115, 814-828 (2010).
- Sozmen, E. G., Hinman, J. D., Carmichael, S. T. Models that matter: white matter stroke models. Neurotherapeutics. 9, 349-358 (2012).
- Sozmen, E. G., Kolekar, A., Havton, L. A., Carmichael, S. T. A white matter stroke model in the mouse: axonal damage, progenitor responses and MRI correlates. J Neurosci Methods. 180, 261-272 (2009).
- Rosenzweig, S., Carmichael, S. T. Age-dependent exacerbation of white matter stroke outcomes: a role for oxidative damage and inflammatory mediators. Stroke. 44, 2579-2586 (2013).
- Hinman, J. D., Rasband, M. N., Carmichael, S. T. Remodeling of the axon initial segment after focal cortical and white matter stroke. Stroke. 44, 182-189 (2013).
- McCall, T. B., Feelisch, M., Palmer, R. M., Moncada, S. Identification of N-iminoethyl-L-ornithine as an irreversible inhibitor of nitric oxide synthase in phagocytic cells. Brit j pharmacol. 102, 234-238 (1991).
- Gadea, A., Aguirre, A., Haydar, T. F., Gallo, V. Endothelin-1 regulates oligodendrocyte development. J Neurosci. 29, 10047-10062 (2009).
- Dean, D. A. Preparation (pulling) of needles for gene delivery by microinjection. CSH prot. , (2006).
- Hughes, P. M., et al. Focal lesions in the rat central nervous system induced by endothelin-1. J. Neuropathol. Exp. Neurol. 62, 1276-1286 (2003).
- Whitehead, S. N., Hachinski, V. C., Cechetto, D. F. Interaction between a rat model of cerebral ischemia and beta-amyloid toxicity: inflammatory responses. Stroke. 36, 107-112 (2005).
- Frost, S. B., Barbay, S., Mumert, M. L., Stowe, A. M., Nudo, R. J. An animal model of capsular infarct: endothelin-1 injections in the rat. Behav Brain Res. 169, 206-211 (2006).
- Horie, N., et al. Mouse model of focal cerebral ischemia using endothelin-1. J Neurosci Methods. 173, 286-290 (2008).
- Wang, M., et al. Cognitive deficits and delayed neuronal loss in a mouse model of multiple microinfarcts. Neuroscience. 32, 17948-17960 (2012).
- Shih, A. Y., et al. The smallest stroke: occlusion of one penetrating vessel leads to infarction and a cognitive deficit. Nat Neurosci. 16, 55-63 (2013).
- Jung, K. J., et al. The role of endothelin receptor A during myelination of developing oligodendrocytes. J Korean Med Sci. 26, 92-99 (2011).
Reprints and Permissions
