Here we present a protocol for synthesizing Zn1-xMgxO/Cu2O heterojunctions in open-air at low temperature via atmospheric pressure spatial atomic layer deposition (AP-SALD) of Zn1-xMgxO on cuprous oxide. Such high quality conformal metal oxides can be grown on a variety of substrates including plastics by this cheap and scalable method.
Method Article
Improved Heterojunction Quality in Cu2O-based Solar Cells Through the Optimization of Atmospheric Pressure Spatial Atomic Layer Deposited
Zn1-xMgxO
In This Article
Summary
Abstract
Atmospheric pressure spatial atomic layer deposition (AP-SALD) was used to deposit n-type ZnO and Zn1-xMgxO thin films onto p-type thermally oxidized Cu2O substrates outside vacuum at low temperature. The performance of photovoltaic devices featuring atmospherically fabricated ZnO/Cu2O heterojunction was dependent on the conditions of AP-SALD film deposition, namely, the substrate temperature and deposition time, as well as on the Cu2O substrate exposure to oxidizing agents prior to and during the ZnO deposition. Superficial Cu2O to CuO oxidation was identified as a limiting factor to heterojunction quality due to recombination at the ZnO/Cu2O interface. Optimization of AP-SALD conditions as well as keeping Cu2O away from air and moisture in order to minimize Cu2O surface oxidation led to improved device performance. A three-fold increase in the open-circuit voltage (up to 0.65 V) and a two-fold increase in the short-circuit current density produced solar cells with a record 2.2% power conversion efficiency (PCE). This PCE is the highest reported for a Zn1-xMgxO/Cu2O heterojunction formed outside vacuum, which highlights atmospheric pressure spatial ALD as a promising technique for inexpensive and scalable fabrication of Cu2O-based photovoltaics.
Introduction
Cuprous oxide (Cu2O) is an earth-abundant non-toxic p-type semiconductor material1. With a band gap of 2 eV, cuprous oxide can fulfill the role of light absorber in heterojunction or tandem solar cells. In heterojunction solar cells, Cu2O is known to be paired with a variety n-type large band gap semiconductors such as ZnO2 and its doped variations3,4, Ga2O35,6 and TiO27 (For a more detailed overview on Cu2O photovoltaics see Ref.8). The development of Cu2O based heterojunction solar cells is presented in Figure 1, where the method of synthesizing the heterojunction is indicated next to each data point. One can note that vacuum based methods such as pulsed laser deposition (PLD) or atomic layer deposition (ALD) allowed for higher power conversion efficiencies to be achieved (up to 6.1%9). In contrast, the efficiencies for non-vacuum synthesis methods such as electrochemical deposition (ECD) have remained low. However, for low-cost photovoltaics it is better to synthesize the heterojunction outside a vacuum. While a vacuum-free, scalable technique of heterojunction formation is a more suitable alternative, it remains challenging to produce an interface of high quality by such methods. In this work we utilize an open-air, scalable thin film deposition process called atmospheric pressure spatial atomic layer deposition (AP-SALD) to grow n-type oxides for Cu2O-based solar cells. The advancement of AP-SALD over conventional ALD is that in the former, precursors are separated in space rather than in time10. During the deposition process, a substrate oscillates back and forth on a heated platen under a gas manifold which contains precursor gas channels separated by inert gas channels, as shown in Figure 2. The nitrogen gas carrying the precursors flows vertically through the gas manifold down towards the laterally moving platen. Due to the oscillations of the platen, each point on the substrate is sequentially exposed to the oxidant and metal precursors, as illustrated in Figure 2. This allows the metal oxide film to grow layer by layer. A detailed description of AP-SALD reactor design and operation can be found elsewhere.11,12 This approach allows the deposition to occur one to two orders of magnitude faster than conventional ALD and outside vacuum, which is compatible with roll-to-roll processing. High quality conformal oxide films produced by AP-SALD can be deposited at low temperatures (<150 °C) on a variety of substrates including plastics, which enables AP-SALD films to be applied to low-cost functional devices such as solar cells13, light emitting diodes14 and thin-film transistors15.
The custom made AP-SALD gas manifold used in this work was mechanically maintained over the substrate placed on the platen. This allowed control of the substrate-manifold spacing independent of the gas flow rates. A large spacing of 50 µm was used, which resulted in intermixing between the metal precursor and oxidant in the gas phase. Therefore, the AP-SALD reactor was operated in chemical vapor deposition (CVD) mode. This was found to be advantageous over operating in ALD mode because the films were grown at a higher rate, but still with high thickness uniformity and were crystalline when deposited at the same temperatures as ALD films.12 Herein, we still refer to the reactor as an AP-SALD reactor because it has the same fundamental design principles as other AP-SALD reactors.11
We used our reactor to deposit the n-type layer for our solar cells, in particular zinc oxide and zinc magnesium oxide (Zn1-xMgxO16,17). Incorporating Mg into ZnO allows the conduction band to be tuned, which is important for reducing losses due to band-tail thermalization13 and interfacial recombination.18,19
Here we show how tuning the conditions for depositing zinc oxide and zinc magnesium oxide films on thermally oxidized cuprous oxide substrates allowed for improved interface quality and hence better solar cell performance to be obtained. This improvement was made possible through the identification of the major limiting factor in Cu2O based solar cells: recombination at the heterojunction interface due to an excessive formation of cupric oxide (CuO) on the Cu2O surface.
Protocol
1. Preparation of Cuprous Oxide Substrates
- Oxidation of copper foil
- Cut 0.127 mm thick Cu foil into 13 mm x 13 mm squares and clean by sonicating in acetone.
- Heat up copper foil to 1,000 °C while continuously flowing Ar gas through the furnace. Monitor the gas ambient in the furnace with a gas analyzer throughout the oxidation. When the temperature of 1,000 °C is reached, introduce oxygen to the furnace at a flow rate to obtain 10,000 ppm oxygen partial pressure and keep that for at least 2 hr. After 2 hr, turn off the oxygen but keep the Ar gas flowing.
- Cool down the furnace to 500 °C (keep the Ar gas flowing). Quench the oxidized samples by rapid withdrawal of the crucibles from the furnace. Dip the substrates into deionized water to cool them faster.
- Etching of Cu2O
- Etch one side of the substrates by repeatedly applying a drop of dilute nitric acid (1:1 mixture of H2O and 70% HNO3) to remove any cupric oxide from the surface. Continue etching until no grey film is visible on the Cu2O surface. CAUTION: This procedure is performed in a fume hood.
- Immediately after etching, rinse each substrate in deionized water and sonicate in isopropanol. Dry with an air gun.
- Deposit 80 nm of gold onto the etched side of the Cu2O substrates by evaporating a 1 g gold pellet placed in a tungsten boat inside a resistance evaporator. Use base pressure 8 x 10⁻⁶ mbar and current of 4 A to reach the evaporation rate of 0.8 Å/sec.
- Etch the other side of the substrates in dilute nitric acid by applying a drop of acid onto the surface. Make sure the acid does not etch the golden film on the other side. Rinse and sonicate as described in section 1.2.2.
- Cover the substrates with a black insulating paint (use high temperature engine enamel) by using a paint brush, leaving an unmasked area of approximately 0.1 cm2 as the active area of the solar cell. Cover the golden electrode on the back side with a marker pen completely.
2. Depositing Zn1-xMgxO Using AP-SALD Reactor
Note: Deposit Zn1-xMgxO films on the unmasked side of Cu2O substrates.13 In this work, a custom-made AP-SALD reactor was used, adapted from the original design developed by Kodak.11,12 Details of the reactor customization are given in Ref. 12.
- Set-up the AP-SALD system as follows:
- Use diethylzinc (DEZ) as the Zn precursor and bis(ethylcyclopentadienyl)magnesium as the Mg precursor. These are liquid precursors each contained in their separate glass bubblers. The precursors are pyrophoric and should never come in contact with air or water. The deposition system is gas-tight.
- For zinc oxide deposition, adjust the bubbling rate of nitrogen gas through the diethylzinc to 25 ml/min, which is contained at RT (20 °C). For zinc magnesium oxide deposition, adjust the gas fraction of each precursor by setting the bubbling rate through the diethylzinc to 6 ml/min and 200 ml/min through the bis(ethylcyclopentadienyl)magnesium (which is heated to 55 °C) to control to Zn to Mg ratio in the Zn1-xMgxO.
- Set the flow rate of the nitrogen carrier gas for the metal precursor mixture to 100 ml/min. Bubble nitrogen gas at 100 ml/min through deionized water, which is employed as the oxidant. This vapor is diluted with nitrogen carrier gas flowing at 200 ml/min.
- Flow nitrogen gas at 500 ml/min to the gas manifold. In the AP-SALD gas manifold, this nitrogen gas is split to four separate channels. Each channel serves to spatially separate the two oxidant channels from the metal precursor mix channel between them.
- Keep the gas manifold at a temperature of 40 °C via circulating water. Heat up the stage (moving platen) to the desired temperature (50 - 150 °C).
- Set the desired sample-to-head distance, sample size, platen speed (50 mm/sec) and number of oscillations (cycles) with the software controlling the platen. The ZnO deposition rate is 1.1 nm/sec (or per cycle) and the Zn1-xMgxO deposition rate is approximately 0.54 nm/sec at 150 °C. A typical number of deposition cycles is 200.
- Deposit the desired oxide on a glass slide for 400 oscillations or until a clear thick homogeneous film can be seen.
- Place the substrate on a glass mask if required, then place it under the gas manifold. Adjust the head (gas manifold) height to 50 µm above the substrate.
- Deposit the Zn1-xMgxO films by first opening the valves for the Mg precursor bubbler, then the Zn precursor bubbler, then start moving the platen under the gas manifold by clicking "start deposition" in the software. Open the H2O bubbler only after scanning the substrate with 5 oscillations of metal precursors in order to avoid Cu2O surface exposure to the oxidant while heated.
- When the deposition is finished, remove the Cu2O substrates from the heated platen as quickly as possible and close the bubbler valves of the metal precursors. Clean the gas channels in the manifold with a blade to remove any deposited oxide powder. Start the next deposition cycle as described in 2.6.
- When finished, purge the system for 30 min before closing the nitrogen valves.
3. Sputtering of ITO
- Sputter 175 nm of indium tin oxide (ITO) by direct current magnetron sputtering20 at the following conditions: power 20 W, base pressure <10-9 mbar, Ar pressure 2.5 Pa. At a sputtering rate of 35 nm/min, sputter ITO for 5 min for a 175 nm thick ITO film. The resulting ITO/ZnO/Cu2O heterojunction is shown in Figure 3.
4. Finishing of the Devices
- Clean the marker pen from the gold electrode with acetone to expose the golden electrode.
- Apply electrical contacts by sticking 2 thin wires with Ag paste onto the ITO and Au electrodes.
Results
Thermodynamically, CuO is the only stable phase of copper oxide in air at RT, as the Cu-O phase stability diagram reveals21-23. To verify the presence of CuO on the surface of Cu2O, absorption spectra of the etched and unetched thermally oxidized Cu2O substrates were taken with photothermal deflection spectroscopy (PDS) — a highly sensitive technique which allows for sub-band gap absorption measurement24 (Figure 4). Both spectra showed absorption above 1.4 eV, which coincides with the band gap of CuO, before saturating at 2 eV (Cu2O band gap). The unetched substrate had a higher absorption below 2 eV, suggesting a thicker layer of CuO on the surface of unetched Cu2O than on the etched substrate. The inset in Figure 4 shows a grey layer of CuO on the as-oxidized (unetched) Cu2O substrate. While no grey film could be detected visually on the etched substrate, some CuO was still present on its surface, as the PDS measurements suggests. The presence of a very thin CuO film on the surface of Cu2O substrates was also confirmed with x-ray photoelectron spectroscopy (XPS)19,25. Cupric oxide present on the Cu2O surface introduces deep level trap states (Cu2+)18 at the heterojunction interface that can act as recombination centers and, therefore, CuO presence at the p-n junction is undesirable.
Heating Cu2O substrates in the presence of oxidants (e.g., air and moisture) facilitates the oxidation of Cu2O to CuO. In order to obtain polycrystalline ZnO by AP-SALD, the substrates are heated to 150 °C. As the substrate is held at elevated temperature in open-air or under the oxidant gas during the deposition, CuO quickly forms on the Cu2O surface. Figure 5 shows scanning electron microscopy (SEM) images of an etched Cu2O substrate before and after spending 3 min on the AP-SALD platen at 150 °C under the flow of nitrogen. Multiple CuO outgrowths can be seen on the annealed substrate, with their composition being close to that of CuO as verified by energy-dispersive X-ray spectroscopy (EDX).
Photovoltaic devices were made with ZnO deposited by AP-SALD at 150 °C for 400 sec on top of the etched thermally oxidized Cu2O substrates. Figure 6A shows the surface of this standard device. One can notice numerous rod- and flower-like outgrowths present in the device. As confirmed earlier with EDX and PDS, these outgrowths are cupric oxide and occur due to Cu2O exposure to air and oxidants. Table 1 and Figure 7 ('ZnO/Cu2O standard' curve) demonstrate the relatively poor performance of this device.
In order to avoid CuO formation on the Cu2O surface, the conditions for depositing ZnO by AP-SALD on the etched thermally oxidized Cu2O substrates were optimized. The following measures were taken in order to minimize CuO growth: reduction of deposition temperature (Figure 8A); reduction of deposition time (Figure 8B); scanning the substrate surface for a few oscillations without exposure to the oxidant gas, i.e., with only metal precursors and inert channels open (Figure 8C); and finally, avoidance of unnecessary heating of naked Cu2O substrates in air just before the start of deposition. The optimal parameters of ZnO deposition on Cu2O were found to be 100 °C, 100 sec and 5 water-free cycles. The surface of the optimized device was free of CuO outgrowths, as is demonstrated in Figure 6B. The current density–voltage (J-V) characteristic of the optimized ZnO/Cu2O device is compared with the standard device in Figure 7. The photovoltaic performance of both standard and optimized ZnO/Cu2O devices is presented in Table 1. It can be seen that by following the four above-mentioned measures, a six-fold increase in power conversion efficiency of the devices was achieved.
To further elucidate the effect of optimization of AP-SALD conditions on the reduction of CuO and the heterojunction quality, external quantum efficiency (EQE) measurements were performed on devices with ZnO deposited at 150 °C and 100 °C (Figure 9). The EQE spectra of the two devices, while similar at wavelengths above 475 nm, differed significantly at wavelengths below 475 nm, which is the range of wavelengths absorbed close to the interface. For the shorter wavelength radiation, the EQE of the device with ZnO made at higher temperature was less than half that of the device with ZnO made at lower temperature. This suggests that more cupric oxide was present at the ZnO/Cu2O interface made at higher temperature, which reduced charge collection from the region close to the heterointerface due to increased recombination.
Mg was incorporated into AP-SALD ZnO films in order to raise the conduction band of ZnO and to reduce recombination further15. Zn1-xMgxO/Cu2O solar cells were made with the optimized Zn0.8Mg0.2O films, resulting in 2.2% device PCE — the highest to date for Cu2O-based solar cells with open-air fabricated heterojunctions (see the device performance in Figure 7 and Table 1).
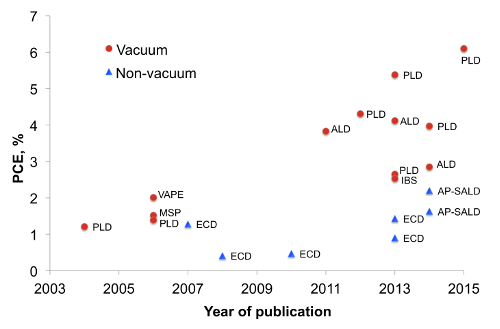
Figure 1. Cu2O-based solar cell efficiency by year of publication (This figure has been modified from Ref.8). Markers indicate whether the interface was formed in vacuum or in atmosphere (non-vacuum) and labels indicate the method of heterojunction formation. MSP - magnetron sputtering, IBS - ion beam sputtering, VAPE - vacuum arc plasma evaporation. Please click here to view a larger version of this figure.
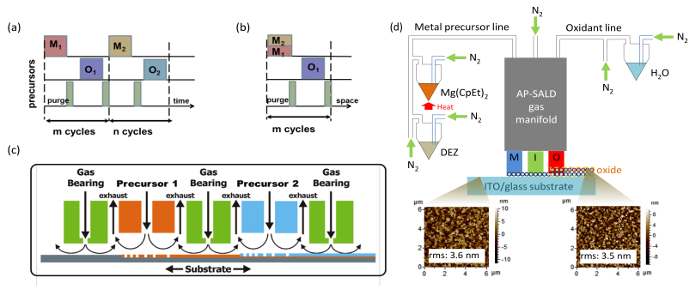
Figure 2. Schematic of AP-SALD deposition process (compared with conventional ALD) and set-up for producing multicomponent metal oxides. (A) Sequential exposure of each precursor and purge step in conventional ALD (delta-doping) (This figure has been reproduced from Ref. 11). In the context of this manuscript, M1 is diethylzinc vapor, M2 bis(ethylcyclopentadienyl)magnesium vapor, and O1 and O2 water vapor. (B) Sequential exposure of metal precursor mixture (co-injection), inert gas channels (equivalent to 'purge' step) and oxidant in AP-SALD (This figure has been reproduced from Ref. 11). (C) Schematic of a general AP-SALD reactor, showing the precursors spatially separated by inert gas channels, with the substrate oscillated beneath the different channels (This figure has been reproduced from Ref.11, which is a modification from one in Ref.26). (D) Overview schematic of the important components of an AP-SALD system with atomic force microscopy (AFM) images showing the morphology of the substrate before and after Zn1-xMgxO deposition (This figure has been reproduced from Ref. 13). Please click here to view a larger version of this figure.
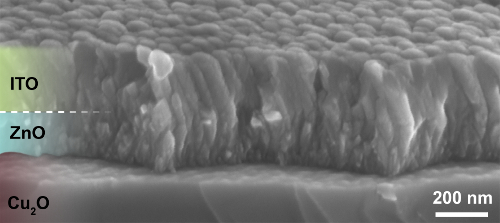
Figure 3. Cross-sectional SEM image of ITO/ZnO/Cu2O heterojunction (This figure has been reproduced from Ref.8). Conformal coating of Cu2O substrate with ZnO and ITO films can be observed. Please click here to view a larger version of this figure.
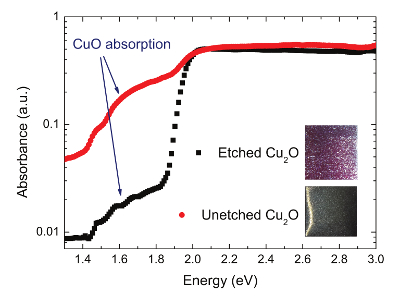
Figure 4. PDS spectra of etched and unetched (as-oxidized) Cu2O substrates (This figure has been modified from Ref.8). The insets show photographs of the etched and unetched cuprous oxide substrates. Please click here to view a larger version of this figure.
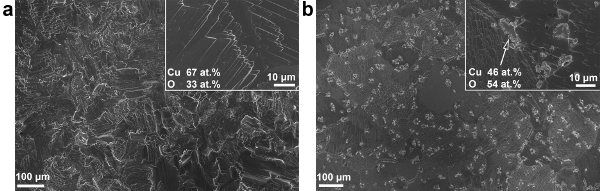
Figure 5. SEM images of the surface of a Cu2O substrate when (A) freshly etched and (B) after annealing at 150 °C in air for 3 min (This figure has been reproduced from Ref.8). Insets show surface composition acquired with EDX. Please click here to view a larger version of this figure.
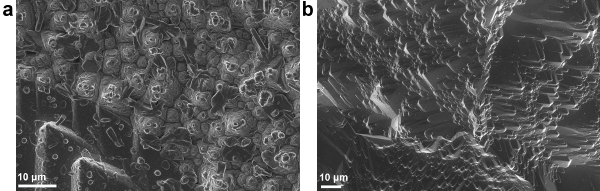
Figure 6. SEM images of the surface of ZnO/Cu2O solar cells made using (A) standard conditions and (B) optimized conditions of AP-SALD ZnO (This figure has been reproduced from Ref.8). Various outgrowths can be seen in the standard device. Please click here to view a larger version of this figure.
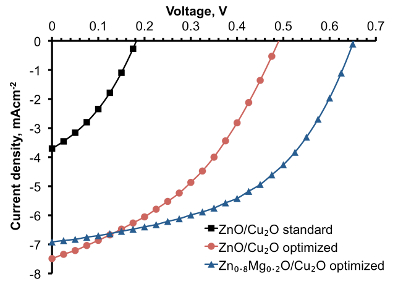
Figure 7. Light J-V characteristics for Zn1-xMgxO/Cu2O solar cells fabricated at standard and optimized AP-SALD conditions (This figure has been modified from Ref.8). The J-V curves demonstrate solar cell performance improvement when the composition and AP-SALD conditions of the Zn1-xMgxO films are optimized. Please click here to view a larger version of this figure.
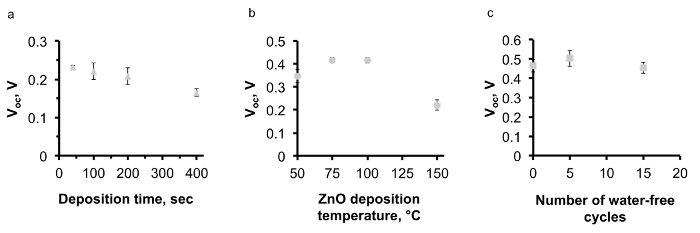
Figure 8. The effect of AP-SALD parameters on the performance of ZnO/Cu2O solar cells. (A) and (B) The effect of AP-SALD ZnO deposition time and temperature on the open-circuit voltage (Voc) of the devices (This figure has been reproduced from Ref.8), (C) correlation of water-free cycles with the Voc of the devices. Please click here to view a larger version of this figure.
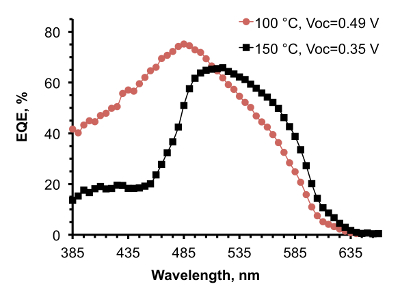
Figure 9. EQE spectra of ZnO/Cu2O solar cells with ZnO deposited at 100 °C and 150 °C. (This figure has been reproduced from Ref.8). Open-circuit voltage of the devices is indicated in the legend. Please click here to view a larger version of this figure.
| Solar cell | Deposition temperature, °C | Deposition time, sec | Jsc, mA/cm2 | Voc, V | FF, % | PCE, % |
| ZnO/Cu2O Standard | 150 | 400 | 3.7 | 0.18 | 35 | 0.23 |
| ZnO/Cu2O Optimized | 100 | 100 | 7.5 | 0.49 | 40 | 1.46 |
| Zn0.8Mg0.2/Cu2O Optimized | 150 | 100 | 6.9 | 0.65 | 49 | 2.20 |
Table 1. Standard and optimized AP-SALD Zn1-xMgxO deposition parameters and performance of the best corresponding ITO/Zn1-xMgxO/Cu2O solar cells (This table has been modified from Ref.8). JSC- short circuit current density, FF - fill factor.
Discussion
Critical steps within the protocol are stipulated by the Cu2O to CuO substrate surface oxidation. These include etching of the substrates in dilute nitric acid to remove any CuO after oxidation as well as after the evaporation of the golden electrode, minimizing the time substrates spend in open air before the Zn1-xMgxO deposition and finally, deposition of Zn1-xMgxO on Cu2O substrates by AP-SALD.
The advantage of AP-SALD compared to conventional ALD is that films can be grown outside a vacuum with a growth rate that is one to two orders of magnitude higher. However, this implies that the Cu2O substrates have to be exposed to oxidants in air at elevated temperature at least just before the deposition, which is sufficient for a thin CuO layer to form on the surface. This seemingly limits the application of the AP-SALD method to some oxidation-sensitive materials. However, by optimizing AP-SALD conditions such as temperature and time, as well as minimizing Cu2O exposure to air and moisture, a six-fold increase in the conversion efficiency of ZnO/Cu2O devices made using AP-SALD was achieved. The improvement came from the understanding that Cu2O to CuO oxidation is the major limiting factor of copper oxide as a material in heterojunction solar cells and modifying the fabrication protocol accordingly.
In order to completely avoid oxidation of cuprous oxide, the substrates have to be kept in an inert atmosphere or in vacuum all the time, which can be challenging when employing an open-air deposition technique such as AP-SALD. While the oxidation of Cu2O is avoided in vacuum based techniques3,18, for large-scale manufacturing, it is important that this problem can be minimized in atmospheric fabrication processes. In AP-SALD, the substrate surface can be exposed to reducing agents prior to the formation of the heterointerface, and by balancing the oxidation of Cu2O with the reduction of CuO by using forming gas during the deposition of the n-type oxide.25 The reducing agent used in AP-SALD could be a mixture of an inert gas with a reducing gas (e.g., N2 + 5% H225), or a number of cycles with a reducing precursor prior to the deposition, i.e., water-free cycles, in order to reduce CuO back to Cu2O just before the ZnO oxide starts to grow on its surface.
In this work, a standard protocol has been developed that minimizes CuO formation optimizing fabrication steps from Cu2O processing and etching to p-n junction formation by AP-SALD in open-air. The success of this work demonstrates the potential of AP-SALD as a promising method for application in cheap and scalable photovoltaic devices. The technique can be used for fast deposition of a variety of n- and p-type semiconducting metal oxides as well as blocking, buffer and barrier layers in solar cells on heat-sensitive substrates including plastics.
Disclosures
The authors declare that they have no competing financial interests.
Acknowledgements
The authors acknowledge the support of the Cambridge Overseas and Commonwealth Trust, the Rutherford Foundation of New Zealand, Girton College Cambridge. This work has been funded by ERC Advanced Investigator Grant, Novox, ERC-2009-adG247276 and by the EPSRC (under RGS3717).
Materials
| Name | Company | Catalog Number | Comments |
|---|---|---|---|
| Copper foil | Avocado Research Chemicals LTD T/A Alfa Aesar | 13380 | 0.127 mm thick, 99.9% (metals basis), annealed |
| Rapidox Oxygen analyzer | Rapidox | Model 2100 | |
| Alumina boat | Almath Crucibles LTD | 6121203 | Dimensions 20 mm x 50 mm x 5 mm |
| Gold pellets | KJLC | EVMAUXX40G | 99.99% pure, 1/8" x 1/8", sold by the gram |
| Diethylzinc | Aldrich | 256781 | ≥52 wt. % Zn basis |
| Bis(ethylcyclopentadienyl)magnesium | Strem Chemicals UK | 12-0510 | 5 g |
| ITO target | GoodFellow Cambridge Limited | LS 427438 | Indium Oxide/Tin Oxide target (In2O3 90 / SnO2 10). Condition: Hot-pressed. Thickness: 2.0 mm ± 0.5 mm. Size: 35.5 mm x 55.5 mm ± 0.5 mm |
| VHT engine enamel paint | Halfords | 325019 | very high temperature engine enamel black paint |
| Nitric acid HNO3, ACS reagent 70% | Sigma-Aldrich Co Ltd | 438073-2.5L | Harmful, irritant |
| 2% Oxygen/Argon 200 bar | BOC Limited | 225757-L | gas mixture for Cu foil oxidation, to be diluted with Ar |
References
- Meyer, B. K., et al. Binary copper oxide semiconductors: From materials towards devices. Phys. Status Solidi (B). 249 (8), 1487-1509 (2012).
- Mittiga, A., Salza, E., Sarto, F., Tucci, M., Vasanthi, R. Heterojunction solar cell with 2% efficiency based on a Cu2O substrate. Appl. Phys. Lett. 88 (16), 163502(2006).
- Minami, T., Miyata, T., Nishi, Y. Cu2O-based heterojunction solar cells with an Al-doped ZnO/oxide semiconductor/thermally oxidized Cu2O sheet structure. Solar Energy. 105, 206-217 (2014).
- Duan, Z., Du Pasquier, A., Lu, Y., Xu, Y., Garfunkel, E. Effects of Mg composition on open circuit voltage of Cu2O-MgxZn1−xO heterojunction solar cells. Sol. Energ. Mat. Sol. C. 96, 1-6 (2011).
- Minami, T., Nishi, Y., Miyata, T. High-efficiency Cu2O-based heterojunction solar cells fabricated using a Ga2O3 thin film as n-type layer. Appl. Phys. Express. 6 (4), 044101(2013).
- Lee, Y. S., et al. Atomic layer deposited gallium oxide buffer layer enables 1.2 v open-circuit voltage in cuprous oxide solar cells. Adv. Mater. 26 (27), 4704-4710 (2014).
- Pavan, M., et al. TiO2/Cu2O all-oxide heterojunction solar cells produced by spray pyrolysis. Sol. Energ. Mat. Sol. C. 132, 549-556 (2015).
- Ievskaya, Y., Hoye, R. L. Z., Sadhanala, A., Musselman, K. P., MacManus-Driscoll, J. L. Fabrication of ZnO/Cu2O heterojunctions in atmospheric conditions: Improved interface quality and solar cell performance. Sol. Energ. Mat. Sol. C. 135, 43-48 (2015).
- Minami, T., Nishi, Y., Miyata, T. Heterojunction solar cell with 6% efficiency based on an n-type aluminum-gallium-oxide thin film and p-type sodium-doped Cu2O sheet. Appl. Phys. Express. 8, 022301(2015).
- Munoz-Rojas, D., MacManus-Driscoll, J. Spatial Atmospheric Atomic Layer Deposition: A new laboratory and industrial tool for low-cost photovoltaics. Mater. Horiz. , (2014).
- Hoye, R. L. Z., et al. Research Update: Atmospheric pressure spatial atomic layer deposition of ZnO thin films: Reactors, doping, and devices. APL Mat. 3 (4), 040701(2015).
- Hoye, R. L. Z., Muñoz-Rojas, D., Musselman, K. P., Vaynzof, Y., MacManus-Driscoll, J. L. Synthesis and Modeling of Uniform Complex Metal Oxides by Close-Proximity Atmospheric Pressure Chemical Vapor Deposition. ACS Appl. Mater. Interfaces. 7, 10684-10694 (2015).
- Hoye, R. L. Z., et al. Improved open-circuit voltage in ZnO-PbSe quantum dot solar cells by understanding and reducing losses arising from the ZnO conduction band tail. Adv. Energy Mat. 4 (8), 1301544(2014).
- Hoye, R. L. Z., et al. Enhanced Performance in Fluorene-Free Organometal Halide Perovskite Light-Emitting Diodes using Tunable, Low Electron Affinity Oxide Electron Injectors. Adv. Mater. 27, 1414-1419 (2014).
- Hoye, R. L. Z., Musselman, K. P., MacManus-Driscoll, J. L. Research Update: Doping ZnO and TiO2 for solar cells. APL Mat. 1 (6), 060701(2013).
- Ohtomo, A., et al. MgxZn1-xO as a II-VI widegap semiconductor alloy. Appl. Phys. Lett. 72 (19), 2466-2468 (1998).
- Su, S. C., et al. Valence band offset of ZnO4H-SiC heterojunction measured by x-ray photoelectron spectroscopy. Appl. Phys. Lett. 92 (19), 1-4 (2008).
- Lee, S. W., et al. Improved Cu2O-based solar cells using atomic layer deposition to control the Cu oxidation state at the p-n junction. Adv. Energy Mat. 4 (11), 1301916(2014).
- Brandt, R. E., et al. Band offsets of n-type electron-selective contacts on cuprous oxide (Cu2O) for photovoltaics. Appl. Phys. Lett. 105 (26), 263901(2014).
- Hakimi, A. Magnetism and spin transport studies on indium tin oxide. , University of Cambridge. Doctoral Thesis, Department of Materials Science and Metallurgy http://www.dspace.cam.ac.uk/handle/1810/239351 (2011).
- Biccari, F. Defects and doping in Cu2O. , University of Rome, Department of Physics. Doctoral Thesis http://server2.phys.uniroma1.it/DipWeb/dottorato/DOTT_FISICA/MENU/03DOTTORANDI/TesiFin22/Biccari.pdf (2009).
- Schmidt-Whitley, R., Martinez-Clemente, M., Revcolevschi, A. Growth and microstructural control of single crystal cuprous oxide Cu2O. J. Cryst. Growth. 23 (2), 113-120 (1974).
- Laughlin, D. E., Hono, K. Predominance phase diagram for the Cu-O2 system. Physical Metallurgy. 1, 219(2014).
- Kronemeijer, A. J., et al. Two-dimensional carrier distribution in top-gate polymer field-effect transistors: correlation between width of density of localized states and Urbach energy. Adv. Mater. 26 (5), 728-733 (2014).
- Hoye, R. L. Z., et al. Perspective: Maintaining surface-phase purity is key to efficient open air fabricated cuprous oxide solar cells. APL Mat. 3, 020901(2015).
- Poodt, P., et al. Spatial atomic layer deposition: A route towards further industrialization of atomic layer deposition. J. Vac. Sci. Technol., A. 30 (1), 010802(2012).
Reprints and Permissions
