This protocol describes enzymatic digestion of mouse skin in nutrient-rich medium followed by gradient separation to isolate leukocytes. Cells thus derived can be used for diverse downstream applications. This is an effective, economical, and improved alternative to tissue dissociation machines and harsher trypsin and dispase-based tissue digestion protocols.
Method Article
Isolation of Infiltrating Leukocytes from Mouse Skin Using Enzymatic Digest and Gradient Separation
In This Article
Summary
Abstract
Dissociating murine skin into a single cell suspension is essential for downstream cellular analysis such as the characterization of infiltrating immune cells in rodent models of skin inflammation. Here, we describe a protocol for the digestion of mouse skin in a nutrient-rich solution with collagenase D, followed by separation of hematopoietic cells using a discontinuous density gradient. Cells thus obtained can be used for in vitro studies, in vivo transfer, and other downstream cellular and molecular analyses including flow cytometry. This protocol is an effective and economical alternative to expensive mechanical dissociators, specialized separation columns, and harsher trypsin- and dispase-based digestion methods, which may compromise cellular viability or density of surface proteins relevant for phenotypic characterization or cellular function. As shown here in our representative data, this protocol produced highly viable cells, contained specific immune cell subsets, and had no effect on integrity of common surface marker proteins used in flow cytometric analysis.
Introduction
Skin conditions ranging from contact dermatitis, eczema, psoriasis, cellulitis, fungal infections and abscesses to non-melanoma skin cancers were found to be among the 50 most prevalent diseases worldwide, and the fourth leading global cause of non-fatal diseases in 20101. Accordingly, the investigation of molecular and cellular mechanisms underlying diverse skin pathologies is a necessary and active area of research. Rodent models have been remarkably useful in the understanding of inflammatory skin conditions such as atopic dermatitis2, psoriasis3, or Staphylococcus aureus infection4. Inexpensive, efficient, and simple protocols for the enzymatic digestion of mouse skin tissue can provide preparations of cells that can be used for a variety of downstream applications to better understand the pathophysiology of skin diseases. Here, a simple and economical method is described for enzymatic digest of mouse skin tissue and isolation of skin infiltrating leukocytes that can be used for cell culture, in vivo adoptive transfer, flow cytometric analysis and sorting or gene expression studies. The overall goal of this procedure is to prepare a single cell suspension of skin-infiltrating leukocytes with high cell viability while minimizing costs typically associated with custom reagent kits and mechanical dissociators.
Existing skin tissue dissociation methods5-7 may result in low cell viability and surface marker integrity, or require custom enzyme kits and expensive tissue dissociation machines8-11. While the digestion of mouse ear skin tissue is reasonably prevalent12-13, digesting highly keratinized skin tissue (e.g. from the flank) can result in cell preparations contaminated with large amounts of non-cellular debris. In a recent study, Zaid and colleagues digested mouse flank skin for 90 min in 2.5 mg/ml dispase, followed by 45 min in 3 mg/ml collagenase7. In another study, these researchers used multiple incubations with a combined digestion of 2.5 hr, including the use of trypsin/EDTA, collagenase III, and dispase5. The use of trypsin is not recommended for enzymatic skin digestion, as treatment with trypsin from different manufacturers has been shown to measurably affect the integrity of cell surface proteins on mammalian cells14-15. Additionally, dispase can have significant effects on proliferative abilities of CD4 and CD8α T cells and affect surface abundance of at least 20 molecules, including common T cell activation markers such as CD62L16. Other protocols use RPMI 1640 in the digestion medium6. However, the presence of Mg2+ and Ca2+ in RPMI can cause extensive cell aggregation17.
An ideal protocol for tissue dissociation should aim for high cell viability, low levels of cell aggregation, and minimal damage to cell surface proteins. High quality lymph node stromal cell preparations have been accomplished with protocols that use shorter enzyme incubations, Ca2+ and Mg2+ free media, and avoid trypsin and dispase18. However, protocols of this type have not been established for the dissociation of whole mouse skin.
Here, a protocol is described to dissociate, isolate, and enrich skin-infiltrating leukocytes from allergen-challenged mouse flank skin. Briefly, excised skin is pre-incubated in Hank's Balanced Salt Solution (HBSS) with 10% fetal bovine serum for 1 hr to soften the tissue for digestion and remove any excess dead skin or fatty tissue. This is followed by a 30 min enzymatic digestion step with 0.7 mg/mL collagenase D. Collagenase D has minimal effects on density of cell surface markers, and no effect on T cell proliferation in vitro16,18, making it highly suitable for applications involving the characterization of surface proteins. Following enzymatic digestion, discontinuous density gradient centrifugation was used to remove epithelial cells and debris from the single-cell suspension and enrich for hematopoietic cells. Importantly, this procedure avoids expensive column-based magnetic cell separation reagents and tissue dissociation machines8-11, and can be performed with equipment and materials found in a basic biomedical research laboratory. Here this protocol was used to isolate leukocytes from flank skin challenged three times with the hapten oxazolone (Ox) in previously sensitized ND4 Swiss mice (adapted from 19). Cells were analyzed using multi-parametric flow cytometry. This technique yielded a cell suspension with minimal debris and >95% viability of isolated lymphocytes which were analyzed by multi-parametric flow cytometry to measure the infiltration of T lymphocytes and neutrophils into the affected skin.
Protocol
Note: 8-12 week old female ND4 Swiss Webster mice, conventionally housed with free access to food and water, were used for these studies. The experimental protocol used (B13S1) was approved by Macalester College's IACUC.
1. Sensitization and Challenge with Oxazolone
- Day 0
- Prepare anesthesia chamber by adding 3 ml isoflurane to absorbent towels placed beneath mesh at the bottom of a 4 L lidded glass jar. For the ND4 female mice used here, time in the chamber is 30-60 sec until the subject is adequately anesthetized; optimize anesthetic administration for the mouse strain being used.
- Shave each anesthetized mouse's back and flank using an animal hair trimmer.
- Day 1
- Make a 2% solution of 4-ethoxymethylene-2-phenyl-2-oxazolin-5-one (Ox) into absolute ethanol, and incubate at 50 °C for 15 min on a rotating plate in an incubator.
- Briefly anesthetize mice using isoflurane anesthesia as described in 1.1.1 and apply 100 µl of 2% Ox to the shaved back in several serial applications of about 20 µl each. Wait 5-10 sec between serial applications for the solution to dry.
- Take care to avoid spilling the 2% Ox solution on regions other than the back, and wait for the solution to dry between applications.
- Days 5-7
- Make a 1% solution of (Ox) in absolute ethanol, and incubate at 50 °C for 15 min on a rotating plate in an incubator.
- Gently but firmly immobilize the mouse at the scruff of the neck and tail base with abdomen facing up and neck slightly tilted downward (similar to a hold for an intraperitoneal injection) and apply 100 µl of 1% Ox to the shaved flank in several serial applications and taking the time to dry the skin afterwards as described above.
- For control mice, apply 100 µl of absolute ethanol vehicle to the shaved flank.
2. Flank Skin Harvest
- Euthanize mice using carbon dioxide inhalation, and carefully excise the desired area of flank skin (~25 mm x 25 mm of skin) with 10 cm surgical scissors.
- Using a clean, sharp surgical blade, scrape away the excess fat and connective tissue from the flank skin.
- Place 3 pieces of flank skin from 3 mice into a 50 ml conical tube containing 10 ml RT HBSS [with phenol red, without calcium or magnesium, 5 mM ethylenediaminetetraacetic acid (EDTA), 10 mM 4-(2-hydroxyethyl)-1-piperazineethanesulfonic acid (HEPES), and 10% fetal bovine serum (FBS)].
3. Pre-digestion Tissue Washing
- Place tube containing skin fragments on a rotating plate for 30 min in a dry non-gassed incubator maintained at 37°C.
- Vortex vigorously for 10 sec at the end of the incubation period.
- Strain the contents of the tube through a 70 µm strainer to discard the wash buffer and collect the tissue. A single strainer can be reused throughout the entire procedure within a biological treatment group.
- Using a pair of forceps, transfer the flank skin from the strainer into a new 50 ml conical tube containing 10 ml of fresh, RT HBSS media (containing EDTA, HEPES, and FBS as described above).
- With a 12.5 cm pair of surgical dissecting scissors immersed into the tube, mince each piece of flank skin so that the average piece of tissue is approximately 2.2 mm x 2.2 mm in area.
- Place tube containing skin fragments on a rotating plate for 30 min in a dry non-gassed incubator maintained at 37°C.
- Vortex vigorously for 10 sec at the end of the incubation
4. Collagenase Digestion of Skin
- Strain the contents of the tube through a 70 µm strainer, collect and transfer the flank skin pieces into a new 50 ml conical tube containing 10 ml fresh, RT HBSS media supplemented with 0.7 mg/ml collagenase D.
- Place tube containing digestion medium and skin fragments on a rotating plate for 30 min in a dry non-gassed incubator maintained at 37°C.
- Vortex contents of tube vigorously for 10 sec at the end of the incubation.
- Filter contents of tube through a 70 µm strainer into a new 50 ml conical tube; keep the flow-through containing the digested tissue and discard the strainer and flank skin debris.
- Wash the flow-through in 50 ml of HBSS media, centrifuge for 5 min at 350 g, and decant the supernatant.
5. Density Gradient Centrifugation
- Using a serological pipette, add 3 ml RT 67% density gradient centrifugation media in 1X phosphate buffered saline (PBS) into a new 15 ml conical tube for each sample.
- Resuspend the cell pellet in 5 ml RT 44% density gradient centrifugation media in HBSS with phenol red.
- Gently layer 5 ml of the 44% density gradient centrifugation media containing the cells on top of the 67% density gradient centrifugation media sample using a serological pipette. Make sure to set the pipettor to the slowest speed, and place the pipette along the wall of the conical tube. Be careful not to shake, disrupt, or invert the gradient.
- Set acceleration to the lowest setting, disengage the brake, and centrifuge the gradient at 931 x g for 20 min at RT making sure that the centrifuge is balanced.
- After centrifugation, carefully remove the gradient from the centrifuge, and gently transport to the lab bench holding the tube upright. Using a 5 ml plastic transfer pipette, remove the cell layer at the interface of the 44% and 67% density gradient centrifugation media and transfer to a new 15 ml conical tube. If the interface is not visible, simply remove about 2 ml of liquid at the 67%-44% boundary.
- Fill the conical tube containing cells from the interface with 2% FBS in 1X ice-cold PBS, centrifuge cells for 5 min at 350 x g, and decant the supernatant.
Note: This is the first time that the cells can be cooled/kept cold since digestion steps are at 37°C and density gradient centrifugation media steps are at RT. Cells can be resuspended in a 1:1 Trypan blue dilution and counts and viability information can be obtained at this point.
6. Blocking and Staining for Flow Cytometric Analysis
- Block FcγRII/III receptors on cells to prevent non-specific antibody staining. For the experiments described here, make antibody master mixes in PBS with 2% FBS containing 1:100 dilution of unconjugated antibody against CD16/32 (2.4G2) to bind and block FcγRII/III receptors.
- Incubate blocked cells with appropriate master mixes of antibodies against CD3ɛ (145-2C11), CD4 (RM4-5), CD8α (53-6.7), CD11b (M1/70), CD11c (N418), CD44 (IM7), CD45 (30-F11), CD45R (RA3-6B2), CD62L (MEL-14), and Ly-6G/Ly-6C (Gr-1) (RB6-8C5), as well as Brilliant Violet 510 live/dead stain to identify dead cells. Use all antibodies either at the dilution recommended by manufacturers or previously optimized by researchers. For the experiments described here, use all antibodies at 1:100 dilution.
- Wash cells and resuspend in 50 µl 1X PBS staining buffer with 2% FBS. Keep on ice until fluorescence data can be acquired on a flow cytometer.
Note: It is important to have compensation parameters pre-optimized with a lymphoid tissue and a common cell surface antigen (like CD4 or CD8) before acquisition of fluorescence data. - To increase the number of cells for downstream flow cytometry analysis, acquire data from entire samples of stained cells.
7. Analyze Flow Cytometry Data using Standard Methods to Accomplish the Steps Outlined Below
- First, gate on the lymphocyte region of the forward scatter (area) by side scatter (area) plot.
- Then, select single cells using the forward scatter (width) by side scatter (width), to avoid analyzing doublets. This can also be accomplished with a forward scatter height by side scatter height plot.
- Then, gate on lineage (CD11b, CD11c, and CD45R/B220)-negative and CD3-positive events, to exclude macrophages, dendritic cells, and B cells, respectively, and confine analyses to the T cell compartment, if the goal is, as it is here, to assess infiltrating T cells.
- Next, gate on live cells that exclude the live/dead stain.
- Finally, gate on the cell population of interest (see representative results section).
Results
Collagenase D treated splenocytes show similar levels of CD4 and CD8α on T cells when compared to media-treated controls
First, any potential effects of collagenase D on the frequency and surface abundance of lineage and activation markers on T cell subsets were assessed using secondary lymphoid tissue as a control. A suspension of splenocytes was obtained from ND4 mice and washed for 1 hr with HBSS media. Next, half the cells subjected to 0.7 mg/ml Collagenase D (as described in Section 4 above). The remaining cells were resuspended in control HBSS medium. Next, both splenocyte fractions were processed using a density centrifugation gradient as described in Section 5 above. Cells were then stained with antibodies against surface CD4 and CD8α, and analyzed on the flow cytometer. Single, live, CD45+, non-T lineage- (B220-CD11b-CD11c-), CD3ɛ+cells were gated for analysis, to exclude B cells, macrophages, dendritic cells. CD4 and CD8α proteins were equally detected on the surface of splenocytes that had been subjected to collagenase D digestion and those had not been exposed to enzyme with approximately 60% CD4+CD8α- cells and 30% CD4-CD8α+ cells detected with either treatment (Figure 1A). Therefore, collagenase D digest did not affect the relative frequency of CD4 and CD8α. The intensities of surface CD4 and CD8α geometric mean fluorescence units (gMFI) on these subsets were also comparable between the two treatments; gMFI values for CD4 were 2271 for enzyme-treated and 2243 for control splenocytes respectively, and gMFI values for CD8α were 536 for enzyme-treated and 520 for control splenocytes. Enzymatic treatment also had no effect on the surface density of T cell activation markers CD44 or CD62L on CD4+ T cells (Figure 1B). Geometric mean fluorescence intensity values for CD44 were 669 for enzyme-treated and 654 for control splenocytes; gMFI values for CD62L were 1523 for enzyme-treated and 1517 for control splenocytes. As Collagenase D digestion preserves the integrity of surface proteins on isolated cells, the protocol described here can be used with confidence for downstream flow cytometry analysis.
Enzyme digestion and gradient purification of flank skin cells results in high cellular viability
Cell yield and percent viability of the cell suspension obtained above were assessed using Trypan Blue dye exclusion20. This digestion and gradient separation protocol yielded about 250 viable immune cells per mm2 of flank tissue in Ox-challenged mice and about 4 viable immune cells per mm2 of tissue in vehicle-challenged mice that were previously sensitized with Ox (Table 1).
Enzyme digestion and gradient purification of flank skin cells results in robust recovery of immune cells
Next, the extent of immune infiltration in the skin was determined by analyzing the abundance of CD45 surface proteins on cells isolated from the flank of Ox-challenged and control mice to assess recovery of skin-infiltrating immune cells using the methods described here. CD45 is a pan-hematopoietic lineage marker21. 95% of low forward and side-scatter, single cells (gating not shown) in Ox-challenged mice and 71% of these cells in vehicle-challenged controls were live CD45+ cells (Figure 2). A ~67-fold increase in infiltrating CD45+ immune cells was detected in the flank skin following 3 daily Ox challenges using the procedure described herein (Table 1).
Three flank Ox challenges result in pronounced infiltration of T cells and neutrophils
Our technique yielded a cell population from flank skin that could be used to detect a variety of myeloid and lymphoid cell subsets such as Gr-1+ neutrophils22, CD4 T cells and CD8α T cells. We observed ~6-fold, ~7-fold, and ~73-fold increases in neutrophils, CD4 T cells, and CD8α T cells, respectively, following 3 daily Ox challenges (Table 1). We calculated these increases by multiplying the total number of viable cells obtained (counted using Trypan blue exclusion) by the percent of the given immune cell fragment out of the viable cells gate during flow cytometric analysis. We then divided the number of viable total immune cells, Gr-1+, CD4+, or CD8α + cells in Ox-treated mice by the corresponding numbers for vehicle control mice, giving us fold increases in lymphocyte subsets. Gr-1+ neutrophils accounted for 42% of single, live CD45+B220-CD11b-CD11c- cells in Ox-treated mice and 10% of this population in EtOH-treated mice (Figure 2B). In Ox-treated mice, ~52% of gated CD3+ T cells were CD8α+ and ~34% were CD4+, while in vehicle controls, ~9% of T cells were CD8α+ and 57% were CD4+ (Figure 2C). Therefore, with the technique described here, allergic and non-allergic flank skin can be processed to yield single cell suspensions suitable for high-resolution flow cytometric characterization of infiltrating immune cell subsets.
| Cells subsets from mouse flank skin | Ox/Ox (3) | Ox/EtOH (3) | Fold Expansion (Ox/Ethanol) |
| per mm2 tissue | |||
| Total number of cells | 262.7 | 5.3 | 49.3 |
| CD45+ immune cells | 250.7 | 3.8 | 66.7 |
| CD4+CD8- cells | 6.5 | 0.9 | 7.2 |
| CD4-CD8+ cells | 10.6 | 0.1 | 72.9 |
| Neutrophils | 8.6 | 1.5 | 5.6 |
Table 1. Cell yields from allergic flank skin in ND4 female mice. Viable cells isolated from flank skin were counted using Trypan Blue exclusion, and normalized to cells/mm2 tissue based on the area of skin isolated and the number of mice pooled per tissue preparation. We calculated total immune cell yield based on detection of the hematopoietic antigen CD45 on the cell surface, and lymphocyte subset yields based on lineage-specific surface markers. We then divided the number of cells in Ox-treated mice by the numbers for vehicle control mice, giving us fold increases in lymphocyte subsets. Data shown represent pooled data from 2-3 mice per treatment, and are representative of two independent experiments.
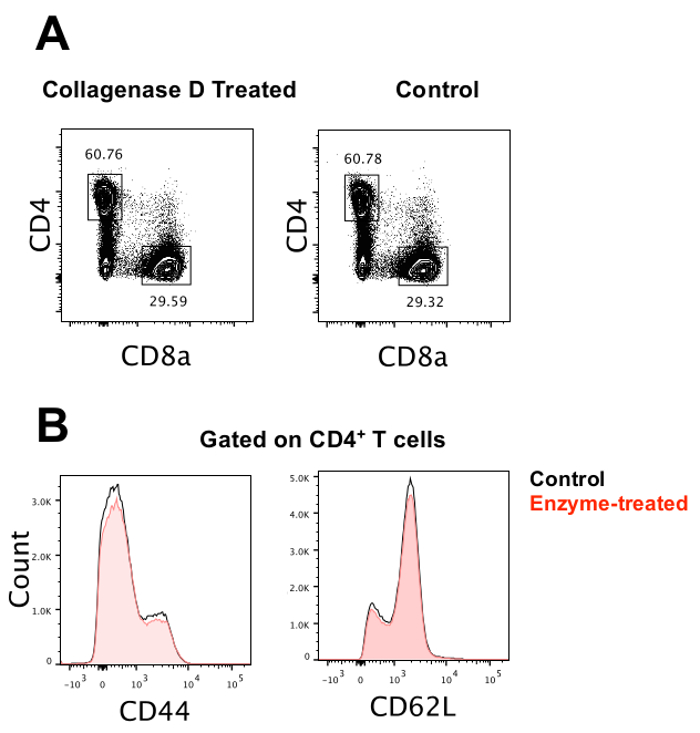
Figure 1. Enzyme digestion and gradient purification of splenocytes preserve lymphocyte subsets and cell activation markers. Splenocytes washed for 1 hr with HBSS media, incubated with either collagenase D or HBSS media alone and purified using a density gradient to remove debris and red blood cells. T cells were identified as live, CD45+, lineage (B220, CD11b, CD11c)-, and CD3ɛ+. Frequency of CD4 and CD8α T cells did not change after enzymatic digestion (A). Surface density of CD44 and CD62L on CD4+ T cells did not change following enzymatic digestion (B). Data shown represent pooled data from 2-3 mice per treatment from a single experiment. Please click here to view a larger version of this figure.
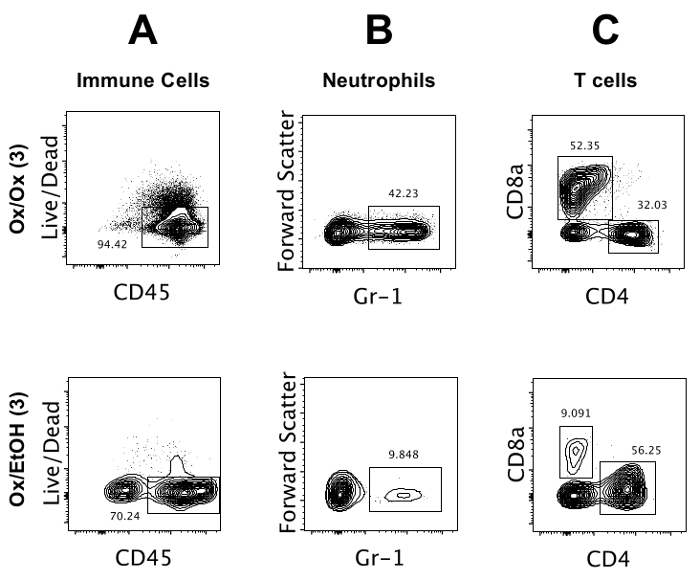
Figure 2. Enzyme digestion and gradient purification of skin cells reveal distinct immune infiltration in control vs. allergen-challenged mouse flank skin. Three flank Ox challenges produce a ~67-fold increase in skin-infiltrating immune cells in previously sensitized ND4 Swiss mice (A). Three Ox challenges also provoked a ~6-fold increase in Gr-1+ neutrophils (B), and ~73- and ~7-fold increase of CD8α+ and CD4+ T cells, respectively (C). Live CD45+ immune cells are gated from single, low forward and side scatter cells; neutrophils and T cells gated from B220- CD11b- CD11c- live single cells. Counts were performed using a 1:1 Trypan blue dilution following gradient density separation. Data shown represents pooled data from 2-3 mice in each treatment group, and are representative of two independent experiments. Please click here to view a larger version of this figure.
Discussion
Characterizing changes in skin-resident leukocytes in rodent models of skin diseases such as atopic dermatitis or psoriasis is important for understanding mechanistic connections between inflammatory cell influx and disease pathology. Here we describe an economical technique to isolate leukocytes from skin tissue with basic equipment found in most biomedical research labs. This relatively rapid technique avoids the use of expensive tissue dissociation machines and custom tubes and reagents, helping to conserve resources while minimizing hands-on time at the lab bench. Gentle enzymatic digest and discontinuous gradient separation remove the majority of epithelial cells and debris, and the isolated cells can be used for a variety of downstream applications including flow cytometric analysis, cell sorting, transfer, cell culture and in vitro stimulation assays. Enzymatic digest with Collagenase D has no effect on T cell surface marker integrity, and preserves cell viability. This protocol can be easily modified to process skin from regions other than the flank.
The most critical steps in this procedure are 1) thoroughly removing any adipose and connective tissue while harvesting the skin, 2) handling and processing tissue rapidly to maximize infiltrating cell yield while minimizing cell death, 3) gently layering the gradient, and 4) carefully extracting the interface of the gradient. Before beginning a large-scale experiment it is important to practice density gradient centrifugation media layering and interface removal. One can practice harvesting cells from a discontinuous density gradient by crushing an entire murine spleen through a 70 µm strainer into 1X PBS staining buffer and performing the density gradient as described above in step 5. It is much easier to see and extract the interface between the 44% density gradient centrifugation media and the 67% density gradient centrifugation media using splenocytes, due to the large number of immune cells present.
When working with density gradients, bubbles should be avoided while pipetting, and gradient disruptions should be minimized. The conical tube containing the gradient should be handled gently and held vertically at all times. Density gradient centrifugation media solutions should always be at RT, serological pipettors set to the slowest possible release speed, the centrifuge maintained at RT, set to low acceleration with the brake disengaged, and carefully balanced before spinning. When working with skin preparations that yield small numbers of infiltrating leukocytes, cells are not always visible at the gradient interface. Thus, it is important to make the 44% density gradient centrifugation media with HBSS containing phenol red so that the interface can be easily visualized even when a layer of cells cannot be discerned. Additionally, it is important to be gentle but swift when extracting, washing and processing skin tissue to avoid cell death before the skin is placed in the HBSS media.
If cell viability or purity is low, shorter (~20 min) digestion times, slightly lower concentrations of collagenase D (~0.5 mg/ml), or mincing the tissue more finely might be helpful. Because over-digestion and degradation of tissue may contribute to cell death, investigators will need to optimize the minimal digestion time that provides a large enough cell sample size17. The process will likely require several rounds of optimization in the hands of individual investigators to standardize the technique. Collagenase D activity level may also vary between manufacturing lots and adjustments to digestion time will have to be made for each lot of enzyme used. During optimization, it is important to stain reference cell suspensions (e.g. spleen) purified with and without an enzymatic digest step with a reliable live/dead stain as well as immune cell lineage markers (e.g. CD45, CD3ɛ, CD11b, CD11c, etc.) to make sure that cell populations and surface markers of interest are preserved through the tissue digestion process. If possible, it is helpful to perform optimizations on a flow cytometer that can measure forward and side scatter width or height as well as area, to exclude cell aggregates. Lastly, the cell suspensions should be examined under the light microscope for visual assessment of viability and general cellular morphology. The cells can be counted manually using 0.4% Trypan Blue dye exclusion under a light microscope or on a flow cytometer using counting beads. For studies that require more stringent quantification of specific cell types in the excised tissue, researchers can weigh or measure the volume of tissue fragments before and after digestion, and use the extent of digestion to more accurately estimate numbers of cell subsets present in the tissue being analyzed.
One limitation of this protocol is that it is specifically adapted to the purification of immune cells. If one is interested in isolation, purification, and analysis of another cellular population (e.g. skin epithelial cells), the density gradient set-up and the enzymatic digest protocol will both likely need to be modified and optimized to best isolate the cells of interest. However, this protocol allows for isolation and purification of both lymphoid and myeloid cell subsets and can thus be adapted to most immunological applications. Another limitation is that this protocol cannot be used to differentiate between cell populations infiltrating the dermis vs. the epidermis of the skin. To accomplish this level of differentiation, this protocol would have to be further adapted with additional steps to enzymatically separate the dermis and epidermis prior to or instead of the steps outlined here. Here, samples are pooled from ~3 mice to facilitate multi-parameter flow cytometric analysis making it difficult to detect variability between biological replicates. However, depending on the downstream application of choice, this protocol can be easily modified to yield and use samples from single subjects. Finally, the protocol presented here for young, ND4 female mice may need to be modified for mice of different ages, sex or strains according to the needs of researchers.
In summary, this combination of gentle enzymatic digest and discontinuous gradient separation provides a simple, effective and economical method of purifying immune cells from inflammatory skin lesions in mice. It can be used and adapted broadly across a diverse range of rodent models of skin pathologies as a convenient tool to assess immune infiltration and isolate a pure, viable population of leukocytes for downstream applications.
Disclosures
The authors have no financial or other interests to disclose.
Acknowledgements
The National Institutes of Health (NIH R15 NS067536-01A1 to DC), the National Vulvodynia Association (award to DC), and Macalester College supported this work. CB received a fellowship from the Macalester College Beckman Scholars Program, funded by the Arnold and Mabel Beckman Foundation. BTF and TM are supported by JDRF 2-2011-662. We thank Dr. Jason Schenkel and Dr. Juliana Lewis for technical advice, and all current and former members of the Chatterjea lab for their help and support.
Materials
| Name | Company | Catalog Number | Comments |
|---|---|---|---|
| HBSS with phenol red, without calcium, without magnesium, liquid | Sigma Aldrich | 55021C | Keep sterile until day of usage. |
| HEPES, ≥99.5% (titration) | Sigma Aldrich | H3375 | |
| EDTA disodium salt solution | Sigma Aldrich | E7889 | Keep sterile until day of usage. |
| Fetal Bovine Serum, USDA, Heat Inactivated, Premium Select | MidSci | S01520HI | Keep sterile until day of usage. |
| Percoll, pH 8.5-9.5 (25°C) | Sigma Aldrich | P1644 | Keep sterile. Percoll needs to be made isotonic with sterile 10X PBS prior to use. |
| Trimmer Combo Kit | Kent Scientific | CL9990-1201 | Use the larger trimmer for shaving the flank and back. |
| 4-Ethoxymethylene-2-phenyl-2-oxazolin-5-one | Sigma Aldrich | E0753-10G | Dissolve in 100% EtOH at 50°C for 15 minutes on a rotating plate. |
| Purified anti-mouse CD16/CD32 (2.4G2) | Tonbo Biosciences | 70-0161 | Antibody used to block non-specific antibody binding during antibody staining for flow cytometry |
| anti-CD3ε-BV650 (145-2C11) | Becton Dickinson | 564378 | Antibody used to stain cells for flow cytometry |
| anti-CD4-APC-eFluor780 (RM4-5) | eBioscience | 47-0042-80 | Antibody used to stain cells for flow cytometry |
| anti-CD8α-BV785 (53-6.7) | BioLegend | 100749 | Antibody used to stain cells for flow cytometry |
| anti-CD11b-eFluor450 (M1/70) | eBioscience | 48-0112-80 | Antibody used to stain cells for flow cytometry |
| anti-CD11c-eFluor450 (N418) | eBioscience | 48-0114-80 | Antibody used to stain cells for flow cytometry |
| anti-CD44-BV711 (IM7) | Becton Dickinson | 563971 | Antibody used to stain cells for flow cytometry |
| anti-CD45-FITC (30-F11) | Tonbo Biosciences | 35-0451-U025 | Antibody used to stain cells for flow cytometry |
| anti-CD45R-eFluor450 (RA3-6B2) | eBioscience | 48-0452-80 | Antibody used to stain cells for flow cytometry |
| anti-CD62L-PerCP-Cy5.5 (MEL-14) | BioLegend | 104431 | Antibody used to stain cells for flow cytometry |
| anti-Ly-6G/Ly-6C (Gr-1)-PE (RB6-8C5) | BioLegend | 108407 | Antibody used to stain cells for flow cytometry |
| Ghost Dye-BV510 | Tonbo Biosciences | 13-0870-T100 | Viability dye for flow cytometry |
| LSR Fortessa | Becton Dickinson | N/A | Cell analyzer (18 parameters) |
| Collagenase D from Clostridium histolyticum | Roche Applied Science | 11088858001 | Aliquot lyophilized enzyme at 5 mg/ml in HBSS with phenol red, without calcium, and without magnesium into 1 mL aliquots. Store immediately at -20°C for up to six months. |
| ND4 Swiss female mice | Harlan | 0-32 | 8-12 weeks old; conventionally housed with free access to food and water and used according to Macalester College's IACUC guidelines. |
References
- Hay, R. J., et al. The Global Burden of Skin Disease in 2010: An Analysis of the Prevalence and Impact of Skin Conditions. J. Invest. Dermatol. 134 (6), 1-8 (2013).
- Honda, T., Egawa, G., Grabbe, S., Kabashima, K. Update of immune events in the murine contact hypersensitivity model: toward the understanding of allergic contact dermatitis. J. Invest. Dermatol. 133 (2), 303-315 (2013).
- Gudjonsson, J. E., Johnston, A., Dyson, M., Valdimarsson, H., Elder, J. T. Mouse models of psoriasis. J. Invest. Dermatol. 127 (6), 1292-1308 (2007).
- Malachowa, N., Kobayashi, S. D., Braughton, K. R., DeLeo, F. R. Mouse Models of Innate Immunity. Mouse Models of Innate Immunity: Methods and Protocols. 1031, 109-116 (2013).
- Mackay, L. K., et al. Cutting Edge: CD69 Interference with Sphingosine-1-Phosphate Receptor Function Regulates Peripheral T Cell Retention. J. Immun. 194, 2059-2063 (2015).
- Schaerli, P., et al. A skin-selective homing mechanism for human immune surveillance T cells. J. Exp. Med. 199 (9), 1265-1275 (2004).
- Zaid, A., et al. Persistence of skin-resident memory T cells within an epidermal niche. Proc. Natl. Acad. Sci. U. S. A. 111 (14), 5307-5312 (2014).
- Harris, J. E., Harris, T. H., Weninger, W., Wherry, E. J., Hunter, C. A., Turka, L. A. A mouse model of vitiligo with focused epidermal depigmentation requires IFN-Γ for autoreactive CD8+ T cell accumulation in the skin. J. Invest. Dermatol. 132 (7), 1869-1876 (2012).
- Jungblut, M., Oeltze, K., Zehnter, I., Hasselmann, D., Bosio, A. Preparation of Single-Cell Suspensions from Mouse Spleen with the gentleMACS Dissociator. J. Vis. Exp. (22), e1029(2008).
- Nagao, K., et al. Murine epidermal Langerhans cells and langerin-expressing dermal dendritic cells are unrelated and exhibit distinct functions. Proc. Natl. Acad. Sci. U. S. A. 106, 3312-3317 (2009).
- Pennartz, S., Reiss, S., Biloune, R., Hasselmann, D., Bosio, A. Generation of single-cell suspensions from mouse neural tissue. J. Vis. Exp. (29), e1267(2009).
- Dudeck, A., et al. Mast cells are key promoters of contact allergy that mediate the adjuvant effects of haptens. Immunity. 34 (6), 973-984 (2011).
- Hershko, A. Y., et al. Mast Cell Interleukin-2 Production Contributes to Suppression of Chronic Allergic Dermatitis. Immunity. 35 (4), 562-571 (2011).
- Huang, H. L., et al. Trypsin-induced proteome alteration during cell subculture in mammalian cells. J. Biomed. Sci. 17 (36), (2010).
- Tabatabaei, M., et al. Isolation and partial characterization of human amniotic epithelial cells: The effect of trypsin. Avicenna J Med. Biotechnol. 6 (1), 10-20 (2014).
- Autengruber, A., Gereke, M., Hansen, G., Hennig, C., Bruder, D. Impact of enzymatic tissue disintegration on the level of surface molecule expression and immune cell function. Eur. J. Microbiol. Immunol. 2, 112-120 (2012).
- Gu, D., Fan, Q., Xie, J. Cell population analyses during skin carcinogenesis. J. Vis. Exp. (78), e50311(2013).
- Broggi, M. A. S., Schmaler, M., Lagarde, N., Rossi, S. W. Isolation of Murine Lymph Node Stromal Cells. J. Vis. Exp. (90), e51803(2014).
- Martinov, T., et al. Contact hypersensitivity to oxazolone provokes vulvar mechanical hyperalgesia in mice. PloS one. 8 (10), e78673(2013).
- Katsares, V., et al. A Rapid and Accurate Method for the Stem Cell Viability Evaluation: The Case of the Thawed Umbilical Cord Blood. Lab. Med. 40 (9), 557-560 (2009).
- Thomas, M. L., Lefrançois, L. Differential expression of the leucocyte-common antigen family. Immunol. Today. 9 (10), 320-326 (1988).
- Daley, J. M., Thomay, A. A., Connolly, M. D., Reichner, J. S., Albina, J. E. Use of Ly6G-specific monoclonal antibody to deplete neutrophils in mice. J. Leukoc. Biol. 83 (1), 64-70 (2008).
Reprints and Permissions
