Here, we present a protocol for the development and validation of a quantitative PCR method used for the detection and quantification of EHV-2 DNA in equine respiratory fluids. The EHV-2 qRT-PCR validation protocol involves a three-part procedure: development, characterization of qRT-PCR assay alone, and characterization of the whole analytical method.
Method Article
Development and Validation of a Quantitative PCR Method for Equid Herpesvirus-2 Diagnostics in Respiratory Fluids
In This Article
Summary
Abstract
The protocol describes a quantitative RT-PCR method for the detection and quantification of EHV-2 in equine respiratory fluids according to the NF U47-600 norm. After the development and first validation step, two distinct characterization steps were performed according to the AFNOR norm: (a) characterization of the qRT-PCR assay alone and (b) characterization of the whole analytical method. The validation of the whole analytical method included the portrayal of all steps between the extraction of nucleic acids and the final PCR analysis.
Validation of the whole method is very important for virus detection by qRT-PCR in order to get an accurate determination of the viral genome load. Since the extraction step is the primary source of loss of biological material, it may be considered the main source of error of quantification between one protocol and another. For this reason, the AFNOR norm NF-U-47-600 recommends including the range of plasmid dilution before the extraction step. In addition, the limits of quantification depend on the source from which the virus is extracted. Viral genome load results, which are expressed in international units (IU), are easier to use in order to compare results between different laboratories.
This new method of characterization of qRT-PCR should facilitate the harmonization of data presentation and interpretation between laboratories.
Introduction
Equid herpesvirus-2 (EHV-2) is involved in a respiratory syndrome, with potential clinical manifestations such as nasal discharge, pharyngitis and swollen lymph nodes1-3. This virus is also suspected to be associated with the poor-performance of horses, which may result in a significant and negative economic impact for the horse industry2.
Until now, the gold standard for gamma-EHV (γ-EHV) detection was the cell culture method. The first inconvenience of this procedure was the absence of discrimination between EHV-2 and other γ-EHV's (e.g., EHV-5). The second inconvenience was the slow development of the cytopathic process, which takes from 12 to 28 days to manifest4,5.
Development of a validated and normalized quantitative real-time polymerase chain reaction (qRT-PCR) method will help to rapidly detect the virus, to discriminate between EHV-2 and EHV-5 and to study the relationship between the viral genome load and the disease thanks to the quantification aspect.
Polymerase chain reaction (PCR) was described for the first time in 1986 by Mullis6 and is about to become the new gold standard in most of the fields of biological diagnosis (human, environment and veterinary). This method, which is based on the amplification of a part of the genome of pathogens, presents many advantages: specificity, sensitivity and rapidity. Moreover, the risk of amplicon contamination receded since the advent of qRT-PCR and quality assurance7. Nevertheless, the recognition of PCR as a new gold standard method necessitated more than just improved performance data but also the demonstration of the control of development and validation steps of the whole method without degradation of the performance over time.
The first molecular tools used for the detection of EHV-2 were time consuming and involved non-specific amplification with nested PCR followed by sequencing8. The targeted genes for herpes viruses were deoxyribonucleic acid (DNA) polymerase and DNA packaging9. However, nested PCR presents a high risk of contamination by amplicons. Since then, conventional PCR tests have been designed to amplify the interleukin 10-like gene or glycoprotein B gene, reviewed in 20092. More recently, real-time PCR characteristics were described for the quantification of EHV-210 but no data were available concerning validation of the whole method including the extraction process.
In this protocol, development and validation procedures are described for a quantitative PCR method for the detection and quantification of EHV-2 DNA in equine respiratory fluids according to the Association française de normalisation (AFNOR) norm NF U47-6003,11,12, which is the French representative in the international normalization committee. This norm details the "Requirements and recommendations for the implementation, development and validation of veterinary PCR in animal health analysis method"11,12, according to the NF EN ISO/CEI 17025, 200513 and to OIE (World Organization for Animal Health) recommendations, 201014. The EHV-2 qRT-PCR validation protocol involves a three-part procedure: (a) development of the qRT-PCR assay, (b) characterization of qRT-PCR assay alone and (c) characterization of the whole analytical method (from extraction of nucleic acids from the biological sample to PCR analysis).
The characterization of the qRT-PCR assay and of the whole analytical method include the definition of two limits: the limit of detection (LOD) and the limit of quantification (LOQ). The LOD95% PCR represents the lowest number of nucleic acid copies per unit volume that can be detected in 95% of all cases. The LOQ95% PCR represents the lowest quantity of nucleic acid copies that can be determined taking into account the uncertainties.
This qRT-PCR method allows the precise detection and rapid quantification of EHV-2 in respiratory fluids. Furthermore, the method could be applied in other laboratories to ensure a standardized procedure and as general template for the development of other new qRT-PCR assays.
Protocol
Note: Refer to all the different steps that are illustrated in Figure 1.
1. Extraction of Nucleic Acids
Note: Perform extraction under a fume hood to limit airway contamination with nucleic acids. Include an extraction negative control with DEPC-treated water to ensure that none of the reagents are contaminated with unwanted DNA.
- Extract nucleic acids from the biological sample according to a previously described protocol15 and manufacturer's protocol.
- Add 140 µl of biological sample to 560 µl of lysis solution (AVL buffer) and incubate for 10 min at room temperature. Add 560 µl of ethanol. Apply the first 630 µl of this solution (sample+lysis solution+ethanol) to a silica column and centrifuge.
- Apply the remaining 630 µl of this solution to the same silica column and centrifuge. Then wash the column with 500 µl of 2 different wash buffers (AW1 and AW2).
- Elute nucleic acid with 50 µl of elution buffer (AVE buffer) and equilibrate to room temperature. Close the cap and incubate at room temperature for 1 min. Centrifuge at 6,000 g for 1 min.
2. Amplification Procedure
- Prepare 22.5 µl of reaction mix for each reaction. Add 12.5 µl of PCR master mix, x µl of 20 µM forward primer, x µl of 20 µM reverse primer, y µl of 10 µM probe and z µl ultrapure water as required to reach 22.5 µl (x, y and z volumes are obtained after titration, see Sections 3.2.3 and 3.2.6).
- Aliquot 22.5 µl of the appropriate reaction mix to each reaction well in a 96-well plate.
Note: Include negative controls for extraction and for PCR to ensure that none of the reagents are contaminated with unwanted DNA. - Add 2.5 µl of the sample, 2.5 µl of extraction negative control, 2.5 µl of PCR negative control and 2.5 µl of positive sample (reference strain or plasmid) to the corresponding reaction well. After distribution, cover the plate with an adhesive plate seal. Centrifuge the plate for 10 sec at 6,000 g.
- Place the plate in a Real-Time PCR system. Select the template for the assay layout and start the run. Use the PCR program setting: 10 min at 95 °C followed by 45 cycles of 15 sec at 95 °C and 1 min at 60 °C (Table 1).
- Transfer the raw data from the Real-Time PCR system to a spreadsheet. Set the threshold in the amplification plots above the baseline and within the exponential growth region to obtain the threshold cycle for each sample. Plot each point standard set as a standard curve to obtain linearity. Calculate the copy number for the different samples based on the standard curve.
3. Development of Quantitative RT-PCR
Note: The development of a qRT-PCR test requires reference strains, a specific titrated plasmid, and different controls and entails the titration of the primers and probe.
- Preliminary Test
- Design primers and probes with specific software according to previous recommendations16.
- Extract reference strains as described in section 1.
- Amplify as described in section 2 with 900 nM for the final concentration of primers and 250 nM for the final concentration of probe. Analyze the signal as described in section 2.5.
- At the same time, perform amplification of reference strains DNA (as described in section 3.1.3) without probes. Sequence the amplicons obtained by the Sanger method17,18. Analyze the sequences by running a nucleotide BLAST19.
- Titration of Primers and Probe
- Prepare 3 different mixes with 250 nM final concentration of probe and with different final concentrations of the forward and reverse primers (50 nM/50 nM, 300 nM/300 nM, 900 nM/900 nM) for the 3 replicates of the positive sample and a negative control. For each mix, add the same appropriate volume of 20 µM forward primer and 20 µM reverse primer (0.25 µl to obtain the 50 nM final concentration, 1.5 µl to obtain the 300 nM final concentration or 4.5 µl to obtain the 900 nM final concentration), 50 µl of PCR master mix, 2.5 µl of 10 µM probe and ultrapure water as required to reach 90 µl.
- Perform the amplification procedure as described in section 2.
- Choose the best condition to obtain the highest level of amplification, earliest cycle threshold (Ct) and best repeatability between the 3 conditions. Determine the best concentration and the corresponding volume x µl of the forward and reverse primers.
- Prepare 5 different mixes for the 4 samples (3 replicates of the positive sample and a negative control) with 5 different final concentrations of probe (50 nM, 100 nM, 150 nM, 200 nM, 250 nM). For each mix, add x µl of 20 µM forward primer and x µl of 20 µM reverse primer (previously determined, in section 3.2.3), 50 µl of PCR master mix, appropriate volume of 10 µM probe (0.5 µl to obtain the 50 nM concentration, 1 µl to obtain the 100 nM concentration, 1.5 µl to obtain the 150 nM concentration, 2 µl to obtain the 200 nM concentration or 2.5 µl to obtain the 250 nM concentration) and ultrapure water as required to reach 90 µl.
- Perform the amplification procedure as described in section 2.
- Choose the best condition to obtain the highest level of amplification, earliest cycle threshold (Ct) and best repeatability between the 5 conditions. Determine the best concentration and the corresponding volume y µl for the probe.
4. Characterization of Quantitative Real-time PCR (qRT-PCR)
Note: After the development step and determination of the best conditions to use, the characterization step of the PCR includes the specificity, the limit of detection, the linearity range and the limit of quantification of qRT-PCR.
- Preparation and Titration of Plasmid
- Order commercial plasmid containing the relevant fragment of DNA target gene chosen for the PCR (in this protocol, nucleotides 2081-2381 of EHV-2 glycoprotein B gene, see Table 1).
Note: To limit the risk of airway contamination with synthetic DNA, perform serial dilutions of plasmids under a fume hood in a separate room and work with diluted DNA during all the steps of development and validation procedure. - Re-suspend the plasmid with ultrapure water to prepare a stock solution at 50 ng/ml. Vortex and centrifuge briefly the plasmid stock solution.
Note: Determine the real concentration of the plasmid stock solution after re-suspension in order to calculate the copy number of the plasmid. - Add 1 µl of plasmid to the spectrophotometer. Read the optical density (OD) at 230 nm, 260 nm and 280 nm. Read off the DNA concentration on the spectrophotometer software (OD, 260 nm).
- Calculate the copy number of the plasmid using Avogadro's number (NA) and the formula:
Copy number/µl = (NA [plasmid in ng/µl])/(plasmid length x 109 x average weight of a base pair) = (6,022 x 1023 x [plasmid])/(plasmid length x 109 x 660)
- Order commercial plasmid containing the relevant fragment of DNA target gene chosen for the PCR (in this protocol, nucleotides 2081-2381 of EHV-2 glycoprotein B gene, see Table 1).
- Testing the Specificity (Inclusivity and Exclusivity) of qRT-PCR
- Test the inclusivity of the PCR system. Select EHV-2 positive DNA samples, previously characterized by sequencing (established positive status).
- Perform the amplification procedure as described in section 2.
- Analyze the PCR data for each sample as described in section 2.5. Check the presence of an exponential curve for all samples chosen in section 4.2.1 and confirm inclusivity of PCR.
- Test the exclusivity of the PCR system using DNA extracts from pathogens with genetic similarities to the target (in this case, other equid herpesviruses such as EHV-1, EHV-4, EHV-3, EHV-5 and asinine herpesvirus-5 as described in Table 2) and other pathogens involved in respiratory diseases of the host (in this case, equine arteritis virus, equine influenza virus, Coxiella burnetii, Rhodococcus equi, Streptococcus equi equi, Streptococcus equi zooepidemicus, Chlamydophila abortus and Klebsiella pneumoniae, see Table 2).
- Perform the amplification procedure as described in section 2.
- Analyze the PCR data for each sample as described in section 2.5. Check for the absence of an exponential curve for all samples chosen in section 4.2.4 to confirm the exclusivity of the PCR.
- Limit of Detection of qRT-PCR
- Dispense 90 µl of ultrapure water into 6 tubes.
- Perform 6 ten-fold serial dilutions of the plasmid to target the abatement zone (loss of Ct detection). Transfer 10 µl from the plasmid working dilution to the tube with 90 µl of ultrapure water. Vortex and centrifuge briefly the tube. Repeat step 4.3.2 until the last tube in the serial dilution has received the plasmid.
- Perform the amplification of the 6 ten-fold serial dilutions of the plasmid as described in section 2.
- Determine the abatement zone: the zone between the last dilution of plasmid presenting a positive signal and the first dilution without detection (see Figure 2).
- To start the 6 two-fold serial dilutions, choose the last dilution of plasmid which gives a positive signal (see section 4.3.4).
Note: Perform 3 independent trials to determine the limit of detection of qRT-PCR (LOD95% PCR) - Dispense 25 µl of ultrapure water into 6 tubes.
- Perform 6 two-fold serial dilutions of the plasmid. Transfer 25 µl from the plasmid working dilution, as determined in section 4.3.5, to the tube with 25 µl of ultrapure water. Vortex and centrifuge briefly the tube. Repeat step 4.3.7 until the last tube in the serial dilution has received the plasmid.
- Perform the amplification of the 6 two-fold serial dilutions of the plasmid as described in section 2. Repeat steps 4.3.7 to 4.3.8 twice, to obtain 3 trials with 8 replicates (24 replicates) of each of the 6 ten-fold serial dilutions of the plasmid.
Note: The limit of detection of qRT-PCR (LOD95% PCR) is defined as the lowest DNA copies number by volume unit that is detected in 95% of cases. - Calculate the number of positive replicates out of 24 replicates for each level of plasmid concentration.
- Determine the LOD95% PCR. The LOD95% PCR is the level which results in the detection of 23 positive replicates out of 24 replicates.
- Linearity Range and Limit of Quantification of qRT-PCR
Note: Perform 4 independent trials with 6 ten-fold serial dilutions of the plasmid to ensure that the lowest concentration used in the range corresponds to the LOD95% PCR determined previously in 4.3.10.- Dispense 45 µl of ultrapure water in 6 tubes.
- Start the 6 ten-fold serial dilutions with the concentration of plasmid working dilution corresponding to 107 LOD95% PCR.
- Perform 6 ten-fold serial dilutions of the plasmid. Transfer 5 µl from the plasmid working dilution (determined in section 4.4.2) to the tube with 45 µl of ultrapure water. Vortex and centrifuge briefly the tube. Repeat step 4.4.3 until the last tube in the serial dilution has received plasmid.
- Amplify the 6 ten-fold serial dilutions of the plasmid as described in section 2.
- Trace the linear regression y = ax + b with a for the slope and b for the intercept (Figure 3).
- Calculate the amplification efficiency (E) from the slope a of standard curve (see 4.4.5) using the equation:
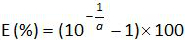 .
.
Repeat steps 4.4.1 to 4.4.6 thrice.
Note: Amplification efficiency represents the amount of PCR product increase after each cycle. An ideal reaction reaches efficiency close to 100%. In practice, E (%) was between 75% and 125%. Higher E can indicate amplification of non-specific products or a pipetting error in the serial dilution. Lower E can also indicate a pipetting error in the serial dilution, poor primer design or non-optimal reaction conditions. - Calculate the bias (Table 3). Verify for each plasmid level that the absolute bias value is less than the critical bias value (0.25 log10). Determine the mean bias and the linearity uncertainties (ULINi) for each plasmid level (Table 3) to evaluate the performance of linear regression for EHV-2 qPCR (Figure 4). U LINi is the linearity uncertainty determined for each i plasmid level calculated from standard deviation (SD'i) and mean bias. Determine the combined linearity uncertainty (ULIN) of EHV-2 qPCR given by the formula:
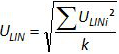
Note: Acceptance of bias is specified by the laboratory (in general absolute bias 0.25 log10) and correspond to the difference between the lowest value and the highest value of 0.5 log10 (quantity measured in log10 copy number). ULIN value could help to compare performance of qPCR from different laboratories. - Determine the limit of quantification of the qRT-PCR (LOQPCR): LOQPCR is the lowest concentration with a bias 0.25 log10 used for the linearity range (Table 3).
5. Characterization of the Whole Analytical Method (from DNA Extraction to the qRT-PCR Result)
Note: The characterization of the whole method is the validation of all steps necessary to obtain qRT-PCR data (i.e., from the extraction of DNA from the respiratory sample (see section 1) to the amplification and quantification of the target (see section 2)).
- Establish correspondence between the copies number in the PCR reaction and the copies number present in the biological sample with the formula:
 .
.
The is the number of plasmid copy in the PCR reaction,
  is the volume of sample added to PCR mix for amplification,
  is the volume of Buffer AVE used to elute nucleic acids and
  is the volume of the extracted sample.
 - Test the Sensitivity and Specificity of the Whole Analytical Method
Note: Only known EHV-2 positive (or negative) samples are used in this section.- Test the "sensitivity" of the qRT-PCR method by analyzing positive samples for the target (EHV-2).
- Select EHV-2 positive DNA samples, previously characterized (positive status).
- Extract the nucleic acid as described in section 1. Perform an amplification procedure as described in section 2.
- Determine the number of real positives (positive samples which are positive with this RT-PCR) and the number of false negatives (known positive samples which are negative with this RT-PCR).
- Test the "specificity" of the qRT-PCR method by analyzing negative samples
- Select EHV-2 negative DNA samples (negative status).
- Extract the nucleic acid as described in section 1. Perform an amplification procedure as described in section 2.
- Determine the number of real negatives (negative samples which are known to be negative with this RT-PCR) and the number of false positives (known negative samples which are positive with this RT-PCR).
- Calculate the "diagnostic sensitivity" (Se) and "diagnostic specificity" (Sp) of the whole method (Table 4) as follows: Se = number of real positives/(number of real positives + false negatives) and Sp = number of real negatives/(number of real negatives + false positives) (see Table 4).
- Calculate the 95% confidence interval for sensitivity and specificity of the whole method with the formula of Greiner and Gardner relation12,20:
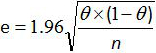
where e is the estimated error, θ is the Se (or Sp) and n the number of samples analyzed.
Note: For a small number of samples, use the Schwartz table according to AFNOR norm12 to calculate the 95% confidence interval for sensitivity and specificity of the whole method.
- Test the "sensitivity" of the qRT-PCR method by analyzing positive samples for the target (EHV-2).
- Preparation of Negative Resource Material for Characterization of the Whole Analytical Method
CAUTION: To determine the limits of detection and quantification of the whole method (LODMethod and the LOQMethod), add known concentrations of plasmid to the biological samples that are known to be free of the target (EHV-2 in this case). These samples, along with the quantified plasmid, constitute positive standards with which to determine the LODMethod and the LOQMethod.- Confirm the absence of target (EHV-2) in the biological samples used to construct positive standards.
- Choose different known negative biological samples.
- Extract biological samples as described in section 1. Perform the amplification procedure as described in section 2.
- Confirm the absence of target by absence of PCR signal in these samples.
Note: Use the same negative resource material for all steps between 5.4 and 5.5.
- Pool the different negative samples to obtain 15 ml of negative resource material (a volume necessary for the complete validation). Dispense 135 µl of this negative resource material into 100 tubes. Keep tubes at +4 °C or at -80 °C for long storage.
- Confirm the absence of target (EHV-2) in the biological samples used to construct positive standards.
- Limit of Detection of the Whole Analytical Method
- Determine the abatement zone of the whole method.
- Dispense 45 µl of ultrapure water in 6 tubes.
- Perform 6 ten-fold serial dilutions of the plasmid. Transfer 5 µl from the plasmid working dilution corresponding to 107 LOD95% PCR (as determined in section 4.3.10) to the tube with 45 µl of ultrapure water. Vortex and centrifuge briefly the tube. Repeat step 5.4.1.2 until the last tube in the serial dilution has received plasmid.
- Transfer 5 µl from each dilution of plasmid to 2 tubes with 135 µl of the negative resource material to obtain 2 replicates for the 6 positive standards. Vortex and briefly centrifuge.
- Perform extraction of the 2 replicates for the 6 positive standards as described in section 1. Perform the amplification procedure as described in section 2.
- Determine the abatement zone: the zone between the last concentration of plasmid giving a positive signal and the first concentration that shows no signal.
- Limit of Detection of the Method (LOD Method) Determined by 2 Independent Trials
Note: Perform 2 independent trials to determine the limit of detection of the whole method (LODMethod).- Start the 6 two-fold serial dilutions with the plasmid working dilution that is 4 times more concentrated that the last concentration of the plasmid that gave a positive signal (see section 5.4.1.5).
- Dispense 25 µl of ultrapure water in 6 tubes.
- Perform 5 two-fold serial dilutions of the plasmid. Transfer 25 µl from the plasmid working dilution (as determined in section 5.4.2.1) to the tube with 25 µl of ultrapure water. Vortex and centrifuge briefly the tube. Repeat step 5.4.2.3 until the last tube in the serial dilution has received plasmid.
- Transfer 5 µl from each dilution of plasmid to 4 tubes with 135 µl of the negative resource material to obtain 4 replicates of the 5 positive standards. Vortex and briefly centrifuge the tubes.
- Perform extraction of the 4 replicates for the 5 positive standards as described in section 1. Perform the amplification procedure as described in section 2.
- Repeat steps 5.4.2.1 to 5.4.2.5 once to obtain 8 replicates for each level of plasmid concentration.
- Count the number of positive replicates out of 8 replicates for each level of plasmid concentration.
- Determine the LODMethod. The LODMethod is the last level at which 8 replicates out of 8 replicates are positive (as described in section 5.4.2.7).
- Determine the abatement zone of the whole method.
- Linearity Range and Limit of Quantification of the Whole Analytical Method
Note: To determine the limit of quantification of the whole method (LOQMethod), add known concentrations of the plasmid to biological samples that are known to be free of the target (EHV-2 in this case). These samples constitute positive standards to determine the LOQMethod.- Dispense 45 µl of ultrapure water in 6 tubes.
- Perform 6 ten-fold serial dilutions of the plasmid. Transfer 5 µl from the plasmid working dilution corresponding to 107 LODMethod (as determined in section 5.4.2.8) to the tube with 45 µl of ultrapure water. Vortex and centrifuge briefly the tube. Repeat step 5.5.2 until the last tube in the serial dilution has received the plasmid.
- Transfer 5 µl from each dilution of the plasmid to 2 tubes with 135 µl of negative biological resource material to obtain 2 replicates of the 6 positive standards. Vortex and briefly centrifuge.
- Perform extraction of the 2 replicates for the 6 positive standards as described in section 1. Perform the amplification procedure as described in section 2. Repeat steps 5.5.1 to 5.5.4 thrice.
- Define an Accuracy Profile in Order to Evaluate and Validate the Quantitative Performance of the Method.
- Define the acceptability limits of the whole method for the laboratory. In this protocol, the acceptability limits are defined as ± 0.75 Log10 by the LABéO Frank Duncombe.
- For one trial, trace a first linear regression y = ax+ b (a is the slope and b is the intercept) with one replicate of Ct values corresponding to each estimated value of the standard curve. With this first linear regression, calculate the experimental value of the copy number for the replicates of Ct values used for this first standard curve. Repeat step 5.5.5.2 with the second replicates of Ct values to obtained a second linear regression and calculate the experimental value of the copy number for the second replicates of Ct values used for the second standard curve.
- Repeat step 5.5.5.2 with the second and third trials.
- Calculate the precision, trueness and accuracy limits for each plasmid level according to NF U47-600-212.
- Create a spreadsheet to compile the information for all standard points (5.5.5.4) and create an accuracy profile with the previously defined acceptability limits in 5.5.5.1 and the trueness of the data along with the lower and the upper accuracy limits as calculated in 5.5.5.4 (Figure 5).
- Determine the LOQMethod: this corresponds to the lowest concentration of a standard curve with trueness 0.75 log10 as used for the linearity range calculated in 5.5.5.5.
- Evaluation of Repeatability and Reproducibility
Note: Check the repeatability and reproducibility by using the ratio between the standard deviation and the mean of replicate measurements (coefficient of variation, or CV = standard deviation/mean).- Evaluate the Repeatability of the Whole Method by 1 Analyst:
- Choose 3 biological samples with 3 distinct viral genome loads (previously tested in PCR for example).
- Extract 8 replicates of the 3 samples as described in section 1. Perform the amplification procedure as described in section 2.
- Calculate the mean and standard deviation of the Ct value collected for each sample.
- Calculate the intra-assay CV using the formula CV = standard deviation/mean.
- Evaluate the Reproducibility of the Whole Method by 3 Analysts:
- Choose 3 biological samples with 3 distinct viral genome loads (previously tested in PCR for example)
- Extract 2 replicates of the 3 samples chosen in 5.6.2.1 (as described in section 1). Perform the amplification procedure as described in section 2. Repeat steps 5.6.2.2 by 2 independent analysts.
- Calculate the mean and standard deviation of the Ct value collected for each sample.
- Calculate the inter-assay CV using the formula CV = standard deviation/mean.
- Evaluate the Repeatability of the Whole Method by 1 Analyst:
Results
The quantitative RT-PCR method, as described above, was implemented to detect and quantify equid herpesvirus-2 in respiratory fluids. Figure 1 illustrates a schematic workflow chart for the development and validation of a quantitative RT-PCR method according to the AFNOR norm NF U47-600. Specificity of the primers and probes were validated during the step-by-step development of the PCR. Only EHV-2 strains were amplified in this system. Subsequently, the performance of the qRT-PCR had to be characterized.
Firstly, to estimate the LODPCR, a 6 ten-fold serial dilution was performed to establish the abatement zone (Figure 2). In this example, 6 ten-fold serial dilutions were made between 10-5 and 10-10 (between 26,000 and 0.26 copies/2.5 µl sample) to estimate the LODPCR. The abatement zone lies between dilutions of 10-9 and 10-10 (between 2.6 and 0.26 copies/2.5 µl sample). To determine the LODPCR value in this case, 6 two-fold serial dilutions of the plasmid were made in this abatement zone between 5.2 and 0.16 copies/2.5 µl sample. The LODPCR value was 2.6 copies/2.5 µl sample.
To determine the linearity range and LOQPCR, the LODPCR value was used to start the range of 6 ten-fold serial dilutions, between 2.6 (LODPCR) and 260,000 copies/2.5 µl sample. Figure 3 illustrates a linear regression for the EHV2 qRT-PCR from one trial. The performances of linear regression (Figure 4) are validated in quadruplicate using the calculations described in Table 3. The calculations are performed to define the linearity range according to the criteria absolute Biasi value ≤0.25 log10, whatever the level i of plasmid load. In this case, the linearity range lay between 2.6 and 260,000 copies/2.5 µl sample. The LOQPCR is the lowest concentration in the linearity range (i.e., 2.6 copies/2.5 µl sample in this case). ULIN was determined to be 0.12 log10 in the range 2.6-260,000 copies/2.5 µl of DNA.
After development (Figure 1, blue) and characterization of the qRT-PCR (Figure 1, yellow), the AFNOR NF U47-600 norm recommends characterization of the whole analytical method from DNA extraction to qRT-PCR (Figure 1, orange). The diagnostic sensitivity and specificity were calculated as described in Table 4. The quantitative performances of the qRT-PCR whole analytical method was evaluated and validated with an accuracy profile (Figure 5).
This protocol, which uses state-of-the-art molecular technology, allowed us to detect and quantify the EHV-2 viral genome load in 172 nasal swab samples obtained from horses with respiratory disorders and/or clinical suspicion of infection. The incidence of EHV-2 from field (biological) samples was 50% (86/172) in this population. The quantitative analyses showed that viral genome loads of EHV-2 were significantly higher in young horses and the repartition of viral genome loads decreased with age (Figure 6). In the present study, the highest EHV-2 viral genome load (1.9 x 10¹¹ copies/ml) was detected in foals (Figure 6).

Figure 1: Workflow chart for the development (blue), the characterization of the quantitative RT-PCR (yellow) and the characterization of the whole analytical method from DNA extraction to qRT-PCR (orange) according to the AFNOR norm NF U47-600-2. The workflow chart resumes the different steps for the development, the characterization of the quantitative RT-PCR and the characterization of the whole analytical method from DNA extraction to qRT-PCR. For each step, the workflow chart indicates the number of required runs, dilutions to be perform and the number of required analysts. Please click here to view a larger version of this figure.
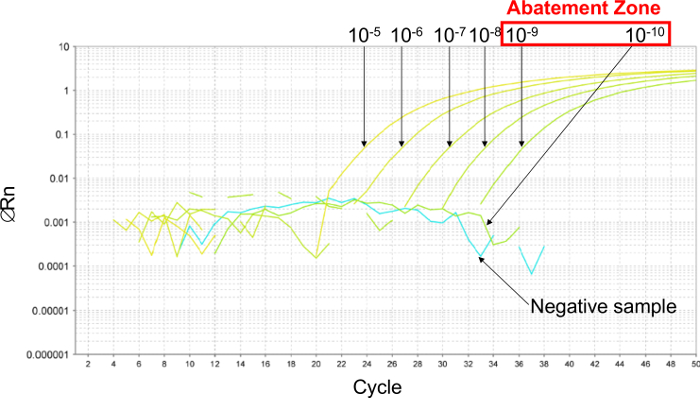
Figure 2: Determination of the abatement zone with representative results from real-time PCR curves obtained with 6 ten-fold serial dilutions of plasmid. To estimate the abatement zone, 6 ten-fold serial dilutions are made between 10-5 (26,000 copies/2.5 µl sample) and 10-10 (0.26 copies/2.5 µl sample). The abatement zone lies between dilutions of 10-9 (2.6 copies/2.5 µl sample) and 10-10 (0.26 copies/2.5 µl sample). In this case, 6 two-fold serial dilutions of plasmid were made in this abatement zone to determine the LOD 95% PCR, between 5.2 and 0.16 copies/2.5 µl sample. Please click here to view a larger version of this figure.
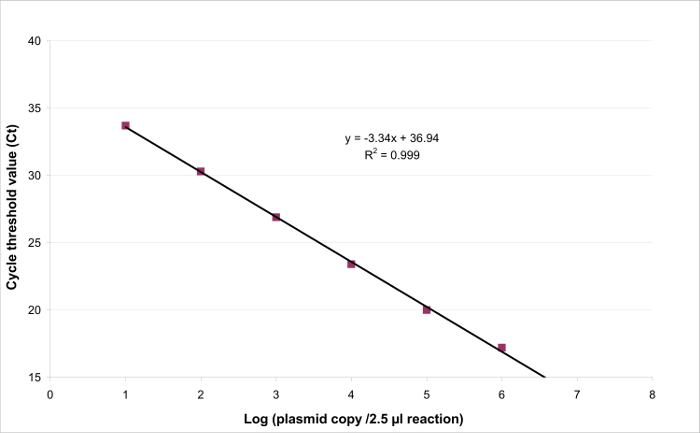
Figure 3: Linear regression for EHV2 qRT-PCR. The linearity of quantitative testing is the ability to generate results which are proportional to the concentration of the target present in a specific range. This can be modeled by linear regression (y = ax + b) between the instrumental response (Cycle threshold or Ct) and the logarithm of the quantity of the target (number of target copies/2.5 µl sample). Please click here to view a larger version of this figure.
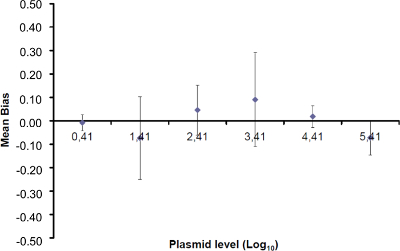
Figure 4: Performance of linear regression of EHV-2 qPCR. Mean bias represent the mean difference between the measured plasmid quantity ( ) and the theoretical plasmid quantity (x'i) for each plasmid level. Vertical bars represent the linearity uncertainty (ULINi) given by the formula

where SD'i is the standard deviation of measured plasmid quantity. Please click here to view a larger version of this figure.
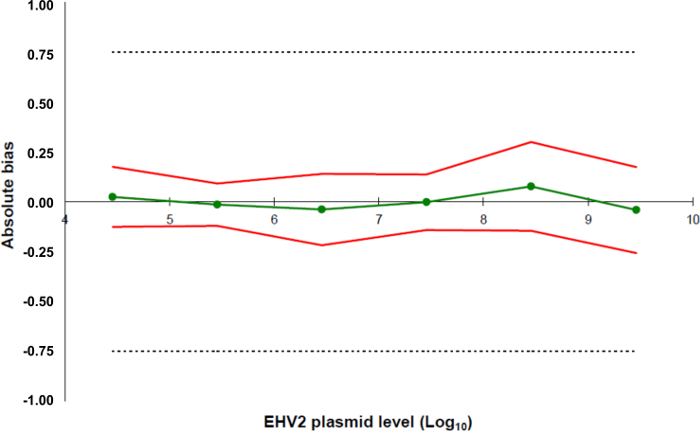
Figure 5: Accuracy profiles based on the validation results of the EHV-2 qRT-PCR method. The green line (circles) represents the trueness of the data (systematic error, or bias). The acceptability limits are defined at ± 0.75 Log10 by the laboratory (dashed lines). The lower and the upper accuracy limits were determined for each plasmid load level from the mean bias ± twice the standard deviation of the reliability data (red lines). Please click here to view a larger version of this figure.
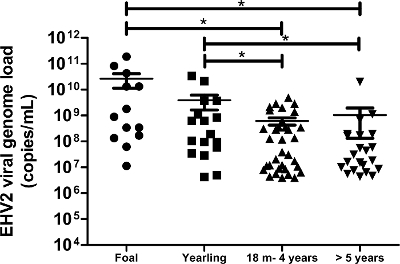
Figure 6: Quantification of viral genome loads of EHV-2 according to age. The viral genome load distribution of EHV-2 detected in nasal swab samples is represented for the different age groups. The horizontal lines represent the median values within the standard deviation (m = months). * Significantly different by ANOVA with Newman-Keuls post-hoc test (p <0.05). Please click here to view a larger version of this figure.
| Target gene | Primers, probe and plasmide sequences (5'-3') | Nucleotide position | Product size (nucleotides) | Thermal cycling conditions | References | |||
| EHV2 gB (HQ247755.1) | Forward: GTGGCCAGCGGGGTGTTC | 2113-2130 | 78 | 95 °C 5 min | 11 | |||
| Reverse: CCCCCAAAGGGATTYTTGAA | 2189-2170 | 95 °C 15 sec | 45 cycles | |||||
| Probe: FAM-CCCTCTTTGGGAGCATAGTCTCGGGG-MGB | 2132-2157 | 60 °C 1 min | ||||||
| Plasmid: ACCTGGGCACCATAGGCAAGGTGGTGGTCA ATGTGGCCAGCGGGGTGTTCTCCCTCTTTG GGAGCATAGTCTCGGGGGTGATAAGCTTTTT CAAAAATCCCTTTGGGGGCATGCTGCTCATA GTCCTCATCATAGCCGGGGTAGTGGTGGTG TACCTGTTTATGACCAGGTCCAGGAGCATAT ACTCTGCCCCCATTAGAATGCTCTACCCCGG GGTGGAGAGGGCGGCCCAGGAGCCGGGCG CGCACCCGGTGTCAGAAGACCAAATCAGGA ACATCCTGATGGGAATGCACCAATTTCAG | 2081-2381 | |||||||
Table 1: Sequences of primers, probes and positive synthetic DNA controls used in this protocol. The sequence of plasmid (positive synthetic DNA) corresponds to nucleotide positions 2081-2381 of EHV2gB sequence (HQ247755.1). The design of primers and probes used in this protocol was obtained by using specific software.
| PATHOGENS | Reference (origin) | Number of strains | RESULTS |
| EHV-2 | |||
| EHV-2 | VR701 (ATCC) | 20 | Positive |
| 20 samples (FDL collection) | |||
| EHV-5 | KD05 (GERC) | 20 | Negative |
| 20 samples (FDL collection) | |||
| EHV-3 | VR352 (ATCC) | 2 | Negative |
| T934 WSV (GERC) | |||
| EHV-1 | Kentucky strain Ky A (ATCC) | 3 | Negative |
| 2 samples (FDL collection) | |||
| EHV-4 | VR2230 (ATCC) | 1 | Negative |
| Asinine herpesvirus AHV5 | FDL Collection | 1 | Negative |
| Equine Influenza Virus | A/equine/Jouars/4/2006 (H3N8) | 1 | Negative |
| (Accession Number JX091752) | |||
| Equine Arteritis Virus | VR796 (ATCC) | 2 | Negative |
| Rhodococcus equi | FDL Collection | 1 | Negative |
| Streptococcus equi subsp. Zooepidemicus | FDL Collection | 1 | Negative |
| Streptococcus equi subsp. equi | FDL Collection | 1 | Negative |
| Coxiella burnetii | ADI-142-100 (Adiagene) | 1 | Negative |
| Chlamydophila abortus | ADI-211-50 (Adiagene) | 1 | Negative |
| Klebsiella pneumoniae | FDL Collection | 1 | Negative |
Table 2: Analytical specificity of qRT-PCR for EHV-2.
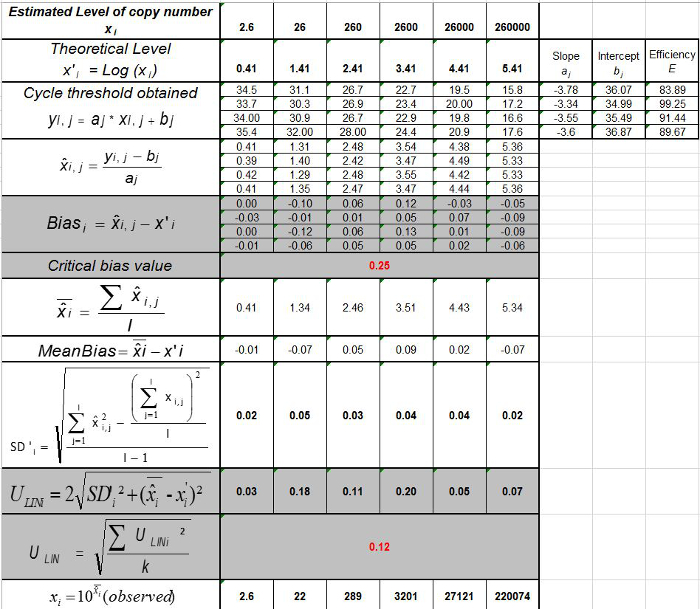
Table 3: Calculation of the bias and linearity uncertainty (adapted from NF U47-600-212). For each trial, the performances of linear regression (y = ax+b) are validated using the table where y is the cycle threshold obtained; a is the slope obtained; x is the plasmid level and b is the intercept. i is the plasmid level (i varies from 1 to k levels); k is the number of plasmid levels used (e.g, k = 6 in this table); j is the trial (j varies from 1 to I trials); I is the number of trials, comprised between 3 and 6 trials (e.g. I = 4 in this table). xi is the estimated plasmid quantity for each i plasmid level. x'i is the theoretical plasmid quantity obtained with equation x'i = log10(xi) for each i plasmid level. During each j trial, the cycle threshold obtained for each i plasmid level is calculated with the linear regression yi,j = ajxi,j + bj.  is the measured plasmid quantity during the trial j. Biasi is the difference observed between the measured plasmid quantity and the theoretical plasmid quantity for each trial and each plasmid level.
  is the mean value of
  by each i plasmid level; SD'i is the standard deviation of measured quantity
  for each i plasmid level; Mean bias is the mean of Biasi; ULINi is the linearity uncertainty determined for each i plasmid level calculated from SD'i and mean bias. Please click here to view a larger version of this figure.
| Real status of sample | |||
| Positive | Negative | ||
| Results obtained with whole method | Positive | RP (real positive) | FP (false positive) |
| Negative | FN (false negative) | RN (real negative) | |
| Total | RP+FN | FP+RN | |
| Se = RP/(RP+FN) | Sp = RN/(RN+FP) | ||
Table 4: Calculation of diagnostic sensitivity (Se) and specificity (Sp) of the whole method. A Schwartz table was used to calculate the confidence interval at 95% of sensitivity and specificity of the whole method as described in NF U47-600-2.
Discussion
Since the 2000s, real-time PCR has been replacing gold standard techniques (cell culture and bacteria culture methods) in an increasing number of laboratories. Implementation of the technique is relatively easy. However validation of laboratory methods is essential for molecular detection and quantification of pathogens to ensure accurate, repeatable and reliable data.
Since the extraction step is the primary source of loss of biological material, it may be considered the main source of error of quantification between one protocol and another. As such, the creation of a standard curve of DNA plasmid during qRT-PCR, mainly reported in the literature, indicates the viral genome load but does not take into account the extraction step.
Description of a de novo strategy for a whole method validation process in the AFNOR norm NF U47-600-2 represents a significant progress in this area. As illustrated in this paper for EHV-2 in horses, or by others in bees21, this necessitates clear differentiation between the development step and the validation step with characterization of the PCR and characterization of the whole method. One limitation in this interesting approach is that any change in the protocol will result in the obligation to revalidate the complete process which could be very costly. This limitation was also highlighted by the fact that the confines of quantification depend on the source from which the virus is extracted (e.g., respiratory fluids, organs, blood or urine). In fact, each matrix presents different specificities in their physico-chemistry characteristics and it is important to define independently each different matrix used for viral detection and quantification by qRT-PCR. Thus, the viral genome load of each biological sample can be quantified more precisely from the extraction. The characterization also takes into account the thermocycler model and when the use of a previously well-characterized method (e.g., the EHV-2 qPCR method described in this paper) necessitates a new type of machine in the parent laboratory or another laboratory, one must confirm the performance of that instrument. The confirmation of the performance of a qPCR assay is a prerequisite for all tests bring into a laboratory. This is normally achieved by analyzing a reference sample with known properties. Such a check is a prerequisite and considered mandatory as requested by the NF 47-600-1 AFNOR norm in order to validate the performance of the qPCR (LOD, LOQ efficiency) and the robustness of the whole method (LOD, LOQ). Not only during the development and characterization steps but also when used in research or for diagnostic purposes, the risk factors can be identified and well controlled to ensure standardization of the protocol. Of particular concern is adequate staff training, highly qualified personnel, quality control of the consumables used and their storage, control of the immediate environmental conditions and awareness of metrological conditions that may affect the performance of the scientific instruments involved in the assay. Use of reference samples for inter-laboratory comparisons could also help control the uncertainties. In this manner, comparison of data between laboratories may be facilitated. Indeed, inter-laboratory proficiency tests are essential to evaluate and confirm the reproducibility of the method.
Viral genome load results which are expressed in international units (IU) of the analyzed biological matrix (IU: copies/ml for fluids or copies/g for tissues) are easier to use in order to compare results between different laboratories. All the results above the LOQ are expressed as copies/ml and a result between the LOD and LOQ is taken as a non-quantifiable positive result. Presenting quantificational data of the genome in this manner conforms more precisely to the process of analyses (amplification of the genome). In fact, in cell culture experiments, expression of the viral load by TCID50 (median tissue culture infective dose) is dependent on the nature of the cells and virus strains. Each strain line possesses its unique infection kinetics and some viruses like EHV-2 can take several days before the first cytopathogenic effect is apparent.
In conclusion, this new method of characterization of qRT-PCR should facilitate the harmonization of data presentation and interpretation between laboratories. This will be very useful for potential new applications of qRT-PCR in the future like the establishment of a cut-off value for declaration of the disease status instead of merely the presence or absence of the pathogen.
Disclosures
The authors declare that they have no competing financial interests.
Acknowledgements
The authors would like to thank Sophie Castagnet and Nadia Doubli-Bounoua for their technical support. This work received financial support from the General Council of Calvados and the agreement of Region Basse-Normandie and French Government (CPER 2007-2013; project R25 p3). The authors would like to thank the experts of the AFNOR group and particularly Jean-Philippe Buffereau and Eric Dubois.
Materials
| Name | Company | Catalog Number | Comments |
|---|---|---|---|
| AB-1900 natural color ABgene 96 well plate | Dutsher | 16924 | |
| Adhesive film qPCR Absolute | Dutsher | 16629 | Adhesive film used for sealing the plate prior to the qRT-PCR run |
| 0.5 ml microtubes, skirted, caps | Dutsher | 039258 | |
| Ethanol 98% | Sodipro | SAF322941000 | |
| Primers | Eurofins | Custom order | |
| Probe | Life Technologies | Custom order | |
| Plasmid | Eurofins | Custom order | |
| QIAamp RNA viral Mini Kit (containing: QIAamp Mini column, AVL buffer, AW1 buffer, AW2 buffer, AVE buffer, collection tubes) | Qiagen | 52906 | AVL buffer: pre-warm 5 min at 72 °C |
| Sequencing by Sanger method | Eurofins | Custom order | |
| Taqman Universal PCR Master Mix | Life Technologies | 4364340 | |
| Tris-EDTA buffer solution | Santa Cruz | sc-296653A | |
| NanoDrop 2000c Spectrophotometer | Thermoscientific | ND-2000C | |
| StepOnePlus Real-Time PCR systems | Life Technologies | 4376600 | pre-warm 15 min |
References
- Brault, S. A., et al. The immune response of foals to natural infection with equid herpesvirus-2 and its association with febrile illness. Vet.Immunol.Immunopathol. 137 (1-2), 136-141 (2010).
- Fortier, G., Van Erck, E., Pronost, S., Lekeux, P., Thiry, E. Equine gammaherpesviruses: pathogenesis, epidemiology and diagnosis. Vet.J. 186 (2), 148-156 (2010).
- Hue, E. S., et al. Detection and quantitation of equid gammaherpesviruses (EHV-2, EHV-5) in nasal swabs using an accredited standardised quantitative PCR method. J Virol.Methods. 198 (1), 18-25 (2014).
- Diallo, I. S., et al. Multiplex real-time PCR for the detection and differentiation of equid herpesvirus 1 (EHV-1) and equid herpesvirus 4 (EHV-4). Vet.Microbiol. 4 (1-3), 93-103 (2007).
- Williams, K. J., et al. Equine multinodular pulmonary fibrosis: a newly recognized herpesvirus-associated fibrotic lung disease. Vet.Pathol. 44 (6), 849-862 (2007).
- Mullis, K., et al. Specific enzymatic amplification of DNA in vitro: the polymerase chain reaction. Cold Spring Harb.Symp.Quant.Biol. 51 (1), 263-273 (1986).
- EPA Office of Water (4607). EPA-815-B-04-001. Quality Assurance/Quality Control Guidance for Laboratories Performing PCR Analyses on Environmental Samples. , (2004).
- Telford, E. A., et al. Equine herpesviruses 2 and 5 are gamma-herpesviruses. Virology. 195 (2), 492-499 (1993).
- Fortier, G., et al. Identification of equid herpesvirus-5 in respiratory liquids: A retrospective study of 785 samples taken in 2006-2007. Vet.J. 182 (2), 346-348 (2009).
- Brault, S. A., Bird, B. H., Balasuriya, U. B., MacLachlan, N. J. Genetic heterogeneity and variation in viral load during equid herpesvirus-2 infection of foals. Vet.Microbiol. 147 (3-4), 253-261 (2011).
- Association Francaise de Normalisation. NFU 47-600-1. Animal health analysis methods-PCR-Part 1: Requirements and recommandations for the implementation of veterinary PCR. , (2015).
- Association Francaise de Normalisation. NFU 47-600-2. Animal health analysis methods-PCR-Part 2: Requirements and recommendations for the development and the validation of veterinary PCR. , (2015).
- ISO. EN ISO-CEI 17025. General requirements for the competence of testing and calibration laboratories. , (2005).
- Manual of Diagnostic Tests and Vaccines for Terrestrial Animals 2010. Chapter1.1.1.4/ 5. Principles and Methods of Validation of Diagnostic Assay for Infectious Diseases. , This thoroughly revised chapter replaces Chapter 1.1.4 Principles of validation of diagnostic assays for infectious diseases and Chapter 1.1.5 Validation and quality control of polymerase chain reaction methods used for the diagnosis of infectious diseases from the sixth edition of the OIE Terrestrial Manual (2009).
- Apaza, S., et al. Detection and genogrouping of noroviruses from children's stools by Taqman One-step RT-PCR. J Vis.Exp. (65), e3232(2012).
- Lorenz, T. C. Polymerase chain reaction: basic protocol plus troubleshooting and optimization strategies. J Vis.Exp. (63), e3998(2012).
- Sanger, F., Coulson, A. R. A rapid method for determining sequences in DNA by primed synthesis with DNA polymerase. J Mol.Biol. 94 (3), 441-448 (1975).
- Sanger, F., Nicklen, S., Coulson, A. R. DNA sequencing with chain-terminating inhibitors. Proc.Natl.Acad.Sci.U.S.A. 74 (12), 5463-5467 (1977).
- NCBI. BLAST Homepage and Selected Search Pages. Introducing the BLAST homepage and form elements/functions of selected search pages. , (2015).
- Greiner, M., Gardner, I. A. Application of diagnostic tests in veterinary epidemiologic studies. Prev.Vet Med. 45 (1-2), 43-59 (2000).
- Blanchard, P., Regnault, J., Schurr, F., Dubois, E., Ribiere, M. Intra-laboratory validation of chronic bee paralysis virus quantitation using an accredited standardised real-time quantitative RT-PCR method. J Virol.Methods. 180 (1-2), 26-31 (2012).
Reprints and Permissions
