This procedure describes how to encapsulate cytochrome c (cyt. c) in silica (SiO2) sol-gels, process these gels to form bioaerogels, and use these bioaerogels to rapidly recognize nitric oxide (NO) through a gas-phase reaction. This type of protocol may aid in the future development of biosensors or other bioanalytical devices.
Method Article
Encapsulating Cytochrome c in Silica Aerogel Nanoarchitectures without Metal Nanoparticles while Retaining Gas-phase Bioactivity
Opens in a new tab
In This Article
Summary
Loading...
$$\rightleftharpoonup{xx}$$
$$\longleftharp{xx}$$,
$$\longrightharp{xx}$$,
Abstract
Loading...
$$\rightleftharpoonup{xx}$$
$$\longleftharp{xx}$$,
$$\longrightharp{xx}$$,
Applications such as sensors, batteries, and fuel cells have been improved through the use of highly porous aerogels when functional compounds are encapsulated within the aerogels. However, few reports on encapsulating proteins within sol–gels that are processed to form aerogels exist. A procedure for encapsulating cytochrome c (cyt. c) in silica (SiO2) sol-gels that are supercritically processed to form bioaerogels with gas-phase activity for nitric oxide (NO) is presented. Cyt. c is added to a mixed silica sol under controlled protein concentration and buffer strength conditions. The sol mixture is then gelled and the liquid filling the gel pores is replaced through a series of solvent exchanges with liquid carbon dioxide. The carbon dioxide is brought to its critical point and vented off to form dry aerogels with cyt. c encapsulated inside. These bioaerogels are characterized with UV-visible spectroscopy and circular dichroism spectroscopy and can be used to detect the presence of gas-phase nitric oxide. The success of this procedure depends on regulating the cyt. c concentration and the buffer concentration and does not require other components such as metal nanoparticles. It may be possible to encapsulate other proteins using a similar approach making this procedure important for potential future bioanalytical device development.
Introduction
Loading...
$$\rightleftharpoonup{xx}$$
$$\longleftharp{xx}$$,
$$\longrightharp{xx}$$,
Cytochrome c (cyt. c) is a key electron-transfer protein involved in the body's cellular respiration reactions. It has been shown to be involved in apoptosis, a controlled form of cell death, and it can detect such small toxic molecules as nitric oxide and carbon monoxide1-3. Nitric oxide (NO) plays a role in a variety of physiological processes taking place in the nervous, cardiovascular, and immune systems. While cyt. c typically requires an aqueous environment buffered to pH-neutral values to remain structurally intact and active, research has shown that cyt. c can retain its structure and function in solid materials known as aerogels under certain conditions4-9.
Aerogels are highly porous materials often formed by synthesizing sol-gel metal oxides(While metal oxide aerogels are very common, carbon and other types of aerogels have been synthesized. One example is InP aerogels)10 and drying these sol-gels in such a way that the porous solid matrix is left unchanged11-14. All of the pores in solid aerogels result in much available surface area making aerogels extremely useful for any applications where surface reactions are important. When chemical or biochemical functionality is assembled within the aerogel nanoarchitecture, it has been shown that the physical porosity and enhanced surface area of the aerogels help to improve sensors, as well as electrodes for battery, fuel cell, and supercapacitor applications11,15-23. In order to dry aerogels in a way that leaves the porous solid matrix unchanged, it is typical to remove the solvent that remains in the pores after sol-gel synthesis through supercritical solvent extraction. Any pore collapse that may be caused by surface tension forces as a solvent evaporates from the gel are minimized because in supercritical drying, a liquid-vapor interface never forms.
There are many reports of heme proteins such as cyt. c being encapsulated in sol-gels that have been kept wet or that have been dried ambiently24-30. Reports of encapsulating biomolecules in sol-gels that are then dried supercritically to form aerogels are rarer due to the necessary processing that can be detrimental to the structure of many proteins. In the case of cyt. c, certain conditions make it possible to retain the ability of cyt. c to detect and respond to gas-phase nitric oxide within aerogels. Once stabilized in the aerogel, the high-quality pore structure of the aerogel facilitates the reaction between cyt. c and nitric oxide4,8,9. Cyt. c can be encapsulated within aerogels by first associating it in multiple layers around gold or silver nanoparticles in solution4-8. These multilayered superstructures serve to protect the protein within the aerogel matrix. In the most recent approach that we have developed, when the protein concentration and buffer strength are controlled along with other synthetic conditions, cyt. c retains integrity within the aerogels even without metal nanoparticle initial association9.
The synthesis begins as many aerogel syntheses begin by mixing silica sol–gel precursors for a set period of time. It is after a set mixing time that cyt. c is added as a buffered solution into the mixture. Gelation then occurs to form a porous silica solid structure in which the pores are filled with water, methanol, remaining reactants and byproducts. This liquid that fills the pores can be rinsed out with various solvents through a series of solvent exchanges, the last exchanges with liquid carbon dioxide taking place within a critical point drying apparatus kept at low temperature. Bringing the gels above the critical temperature (31.1 °C) of carbon dioxide facilitates the formation of a supercritical fluid inside the pressurized apparatus that can be vented to form dry, highly porous aerogels. The relatively low temperature required for carbon dioxide to form a supercritical fluid is advantageous compared to other solvents because it keeps the protein below a temperature at which it could denature.
Our metal nanoparticle-free approach to encapsulating cyt. c in aerogels is advantageous because it is a simple procedure that may lead to the development of a more generally applicable protocol for encapsulating other proteins as well. Many proteins may not interact with metal nanoparticles in the same way that cyt. c does and metal nanoparticle synthesis or purchase adds additional time and expense to the procedure. The few reports on encapsulating proteins in aerogels make the development of this procedure a significant step forward to finding a more general procedure for encapsulating other proteins in aerogels that may aid in potential future bioanalytical devices.
The protocol section of this manuscript outlines how to synthesize silica sol-gels, encapsulate cyt. c into these sol-gels, dry these composite sol-gels to form aerogels, characterize these bioaerogels using UV-visible and circular dichroism spectroscopy and detect the presence of gas-phase nitric oxide with these bioaerogels. Cyt. c has been successfully encapsulated in aerogels when first dissolved in 4.4 to 70 mM aqueous solutions of phosphate buffer. However, optimized protein structure in aerogels has been found to result when encapsulating 40 mM phosphate buffered solutions of cyt. c producing loaded aerogel cyt. c concentrations in the range of 5 to 15 μM9. Therefore, the protocol given below is to synthesize aerogels using 40 mM phosphate buffered solutions of cyt. c resulting in a loaded cyt. c concentration in the aerogels of 15 μM.
Protocol
Loading...
$$\rightleftharpoonup{xx}$$
$$\longleftharp{xx}$$,
$$\longrightharp{xx}$$,
Safety glasses or goggles, laboratory coat, and laboratory gloves should be worn at all times during the procedure. Never operate the critical point drying apparatus without safety glasses or goggles. All solutions containing tetramethoxysilane, methanol, ethanol, acetone, and ammonia should be processed within a fume hood.
1. Make Buffer and Cyt. c Solutions
- To make ~750 ml of pH 7, 40 mM potassium phosphate buffer, first prepare 500 ml of 0.04 M potassium phosphate monobasic by weighing out 2.72 g of potassium phosphate monobasic and dissolving in water using a 500 ml volumetric flask.
- Prepare 500 ml of 0.04 M potassium phosphate dibasic by weighing out 3.48 g of potassium phosphate dibasic and dissolving in water using a 500 ml volumetric flask.
- Pour the dibasic salt solution into a large beaker with a stir bar and begin stirring the solution on a stir plate.
- Slowly add portions of the monobasic salt solution to the dibasic salt solution while monitoring the pH with a pH electrode and meter until the pH is 7.00. Approximately 250-300 ml of the monobasic salt solution will be used.
- Weigh out approximately 0.023 g of cyt. c and place in glass scintillation vial. Add 2,000 μl of prepared potassium phosphate buffer using a micropipette and then gently swirl the solution to mix until all of the solid, red cyt. c has dissolved into the solution and no particulate matter remains.
- Take 20 μl of the prepared cyt. c solution and add to a 1-cm path length plastic cuvette. Add 3 ml of prepared buffer.
- Take UV-vis spectrum from 300-700 nm using buffer in the reference cell. Use the cyt. c absorbance (A) at 409 nm, the extinction coefficient31 (ε) of 106,100 M-1cm-1, the cuvette path length (l), and the Beer-Lambert law to determine the concentration (c) of the solution (A = εlc).
- Back calculate the concentration of the original prepared solution. The 2 ml prepared cyt. c solution is typically between 0.7 to 0.9 mM in concentration.
- Dilute the original prepared cyt. c solution to 800 μl of 0.105 mM by pipetting 117 μl of 0.72 mM prepared cyt. c solution into a scintillation vial. Then add the balance of the 800 μl (683 μl in this case) of prepared buffer. Swirl to mix. The exact volumes will vary depending on the exact concentration of the original prepared cyt. c solution as the volume of cyt. c to pipet is calculated as (800 μl * 0.105 mM)/(original cyt. c concentration in mM).
- Store original prepared and diluted cyt. c solutions at 2-8 °C in a refrigerator until ready to use for up to two weeks.
2. Synthesize Silica (SiO2) Sol
- Label a disposable 50 ml polypropylene beaker 'Beaker A'. Place beaker on the pan of an analytical balance and use a glass Pasteur pipette to add 1.88 g tetramethoxysilane into the beaker. Zero the balance and then pipette 2.88 g of methanol into 'Beaker A'.
- Cover 'Beaker A' with Parafilm.
- Label a disposable 50 ml polypropylene beaker 'Beaker B'. Add a magnetic stir bar and place on the pan of an analytical balance. Use a glass pipette to add 0.75 g water and 3.00 g methanol.
- Cover 'Beaker B' with Parafilm.
- Begin stirring the contents of 'Beaker B' on a stir plate inside a fume hood, then use a syringe to insert 5 μl of 28.0-30.0% ammonium hydroxide solution through the Parafilm cover into the mixture while stirring.
- As soon as step 2.5 is complete, add the contents of 'Beaker A' to 'Beaker B'. Stir the mixture for 20 min while covered in Parafilm.
3. Prepare Gel Molds
Note: There is time to prepare the gel molds while the silica sol mixture is stirring in step 2.6.
- Acquire 8-9 polypropylene scintillation vials (16 mm x 57 mm, volume size 6.5 ml, with bottoms sliced off) and corresponding caps. Put plastic wrap over the cap end of the vial to create a flat surface for the gel to form on and place the cap over it making sure that the plastic wrap stays intact inside the cap.
- Line up the vials with cap-end down on the bench top and opened bottoms facing up.
4. Prepare Cyt. c-silica Sol-gels
- Upon completion of sol mixing (step 2.6), add 3 ml of the sol mixture to a clean disposable 50 ml polypropylene beaker.
- Use a glass Pasteur pipette to slowly drop 500 μl of the 0.105 mM diluted cyt. c solution (made in step 1.9) to the 3 ml sol mixture over the course of ~1 min. Make sure to gently swirl the mixture while adding the cyt. c to avoid formation of large red clumps. Assuming the volumes are additive, by diluting 500 μl of the 0.105 mM cyt. c solution to 3,500 μl, the cyt. c concentration now in the sol is, in theory, 15 μM.
- Pipet 0.5 ml of the resulting cyt. c silica sol into each prepared mold. Also pipet 0.5 ml of remaining 'plain' silica sol into one or two molds to use as control samples during the supercritical drying process.
- Cover the face-up openings of the molds with Parafilm and put in refrigerator (~2-8 °C) overnight or for at least 12 hr to produce sol-gels.
- Take the molds out of the refrigerator. Remove the Parafilm from the top of one mold containing a cyt. c sol-gel; also remove the cap and plastic wrap from the bottom.
- After adding some ethanol from a wash bottle into the mold, use the circular disk end of a syringe plunger to carefully push the gel out of the mold and into a clean 20 ml glass scintillation vial containing approximately 5 ml of ethanol.
- Repeat this gel removal procedure (steps 4.5 and 4.6) until all of the cyt. c gels are added to the vial and all of the silica gels are added to a separate vial. If more than one concentration of cyt. c gel has been made, be sure to store like gels together within separate vials. Then fill the vials to the top with ethanol, cap and store between 2-8 °C.
- Every four hours throughout the day, remove the gels from the refrigerator, decant the ethanol off the gels and replace with fresh ethanol.
- During an additional three days, submerge the wet sol gels in acetone, decanting and adding fresh acetone three times a day.
5. Supercritically Dry Cyt. c-silica Sol-gels
- Cool a critical point drying apparatus (see Figure 1) to 10 °C by setting the temperature of an attached circulator to 8 °C.
- Once the apparatus has reached 10 °C, perform a leak test on the apparatus by filling a transfer boat with acetone and sealing it inside of the apparatus.
- Open the fill valve of the apparatus and add carbon dioxide until the apparatus is half-full.
- Close the fill valve and listen carefully for hissing at the doors and valves where O-rings or seals may be deteriorating.
- Replace any O-rings or seals if a leak is found.
- After completing the leak test, open the drain valve to release the acetone and carbon dioxide into the drain of a fume hood. Then remove the transfer boat from the apparatus.
- After ensuring that the apparatus is leak-free, carefully pour the wet gels from the scintillation vials, along with most of the acetone, into the transfer boat's three long sections (specimen baskets or gauze covers are not necessary). Delicately push and move the gels within the boat with forceps to ensure that all gels are completely submerged in acetone. Add more acetone if needed before sealing the boat inside of the apparatus.
- Open the fill valve of the apparatus to add carbon dioxide, then open the drain valve to release acetone for five minutes as soon as the acetone mixing with the carbon dioxide is observed to be sinking to the bottom of the apparatus through the apparatus window. This seeping of the acetone to the bottom will occur before the apparatus is completely filled with carbon dioxide, so the fill valve should remain open to the extent necessary during the draining so that the apparatus will continue to fill even while the drain is open.
- Close the drain valve. Keep the fill valve cracked open slightly.
- Five minutes later, open the drain valve for five minutes again and adjust the fill valve to be opened enough so that the apparatus remains full during the whole draining time. Close the drain valve, keep the fill valve cracked open, then repeat this draining step one more time five minutes later.
- Following these first three drainage steps, open the drain for 5 min at a time approximately every 40 min over the span of at least six hours to ensure complete replacement of acetone by liquid carbon dioxide within the gels. Always adjust the fill valve to be open enough during each draining so that the liquid level in the apparatus never drops below the top of the boat during draining.
- Once draining steps are complete, close the fill valve, and drain the liquid carbon dioxide so that the level remains visible just above the prongs on the boat by looking through the apparatus window.
- Set the temperature of the apparatus attached circulator to 40 °C to ensure that the liquid carbon dioxide rises above its critical temperature and pressure (Tc = 31 °C; Pc = 7.4 MPa).
- After approximately 15 min, observe the transition from liquid to supercritical fluid through the apparatus window as the liquid meniscus above the prongs of the boat disappears. Allow at least 15 min of equilibration time, then open the vent valve a small amount to begin to release the supercritical fluid.
- Over the course of approximately 45 min, continue to incrementally open the vent valve wider and wider so that a steady, but very low hiss of releasing fluid can be heard and the pressure gauge is observed to slowly decrease to zero.
- After the pressure of the apparatus has gone to zero, open the apparatus door, remove the boat, and use forceps to place the newly dried aerogels in clean glass scintillation vials.
6. Characterize Cyt. c-silica Aerogels with UV-visible and Circular Dichroism (CD) Spectroscopy
- Prepare a cardboard platform to hold the aerogel monoliths in the beam path of the UV-Visible spectrophotometer or CD spectrometer.
- Cut out a 2.5 cm x 2.5 cm piece of lightweight cardboard (such as cardboard from a box of laboratory tissue), fold it in half, cut halfway up on the fold, then fold the two flaps, created by cutting, back.
- Cut out a 5 cm x 5 cm piece of lightweight cardboard, with a 1.5 cm x 1.5 cm square hole in the middle. Then use black electrical tape to decrease the size of the hold to 0.5 cm x 0.5 cm.
- Tape the flaps of the folded and cut cardboard against the 5 cm x 5 cm piece of cardboard so that a small bent surface is created for an aerogel monolith to sit on directly in front of the 0.5 cm x 0.5 cm hole (see Figure 2). Then tape the back piece of cardboard to the UV-visible spectrophotometer so the hole is in line with the beam path.
- Measure the thickness of the gels, which will be used for path lengths, with a micrometer.
- Place one gel on the cardboard platform and measure a spectrum from 300-800 nm with air in the reference compartment of the UV-visible spectrophotometer.
- Fit a polynomial, A = aλn, to the wavelength (λ) region where the absorbance (A) is mainly due to background scattering, ~700-800 nm. The a coefficient is typically fit to a number between ~1 x 10⁸ and 1 x 10⁶ and the n coefficient is typically fit to a number between ~2 and 3.
- Calculate the scatter at other wavelengths, using the coefficients, a and n, obtained from the fit.
- Subtract this calculated scatter background absorbance from the raw spectrum to obtain a scatter corrected spectrum.
- Fit the scatter subtracted spectrum with a Gaussian curve in the region of 370 to 490 nm using appropriate software (GRAMS/AI 8.0) to determine the peak height, peak center, and peak width of the Soret peak of the aerogel.
- Apply the Beer-Lambert Law using the measured thickness of the gel for path length (l), the extinction coefficient31 (ε) of 106,100 M-1cm-1 and the Soret peak height (A) to compute the concentration (c) of cyt. c in the aerogel (A = εlc).
- Compare the calculated cyt. c concentration to the concentration theoretically in the gel (15 μM) to ascertain the viability of cyt. c within the aerogel. Typical percent viabilities are close to 100%, but it should be noted that these viabilities are just estimates because the calculation is based on the extinction coefficient of cyt. c in solution31 which is presumed to be slightly different than the extinction coefficient of cyt. c in the aerogels that is not known.
- Run nitrogen in the CD instrument at least 5 min before turning the lamp on.
- Tape the cardboard holder to the CD spectrometer so the hole is in line with the beam path.
- Measure a continuous wavelength blank spectrum with nothing in the cardboard holder from 350-500 nm at 100 nm/min, taking an average of three scans.
- Place one gel (thickness previously measured in step 6.2) on the cardboard platform and measure a spectrum from 350-500 nm at 100 nm/min, taking an average of three scans.
- Repeat the UV-visible and CD measurements for all aerogel monoliths of interest.
7. Detect Presence of Nitric Oxide (NO) Gas with Cyt. c-silica Aerogels
CAUTION: Working with NO is dangerous and all NO gas should be handled in a fume hood or exhausted into a fume hood. Sustained exposure to NO is toxic to tissues as highly poisonous nitrogen dioxide and/or nitrogen tetroxide will form when NO comes in contact with air. Heat and corrosive fumes are also produced when NO comes in contact with water.
- Place an 8 L nitric oxide cylinder (10% nitric oxide, 90% nitrogen) in a well-ventilated fume hood and adjust the pressure to 4 psi.
- Connect tubing to both the nitric oxide cylinder and to a nitrogen cylinder (pressure set to 6 psi) and link up the ends of the tubing to a T-valve (see Figure 3a).
- Choose an aerogel monolith for the experiment and measure the thickness (or path length) with a micrometer.
- Place the aerogel (~3 mm thick) in a disposable cuvette with plastic cap and put the cuvette into the spectrophotometer. Cut the aerogel slightly if necessary to fit in the cuvette.
- Insert two syringe needles into the plastic cap of the cuvette, one connected to the output of the T-valve, and one connected to a tube to serve as exhaust into the fume hood (see Figure 3b). Use Parafilm to seal the needles to the tubing and the cap to the cuvette.
- Place an empty disposable cuvette in the reference cell.
- Adjust the aerogel cuvette position to ensure that the aerogel lies in the beam path prior to starting the experiment.
- Take an initial spectrum from 800 to 300 nm.
- Monitor the difference between the absorbance at 414 nm and the absorbance at 408 nm while turning the T-valve to switch between nitrogen and the nitric oxide/nitrogen mixture at set time intervals making sure that at no time is the flow rate of nitrogen or nitric oxide/nitrogen mixture so high that the aerogel moves around in the cuvette.
- Take a final spectrum from 800 to 300 nm, once the exposure cycles are finished.
- Repeat the procedure with three to four monoliths to obtain an average sensing response.
Results
Loading...
$$\rightleftharpoonup{xx}$$
$$\longleftharp{xx}$$,
$$\longrightharp{xx}$$,
The described procedure results in aerogels containing viable cyt. c. As specified at the end of the introduction, cyt. c can be encapsulated from aqueous buffer solutions that range from 4.4 to 70 mM phosphate. Examples of cyt. c-silica (cyt. c-SiO2) aerogels made from solutions containing different buffer concentrations are shown in Figure 4. All gels are relatively translucent, with the gels made from 70 mM buffer the most opaque.
A comparison of the spectroscopy of cyt. c under different conditions is shown in Figure 5. A typical spectrum (Figure 5c) shows the large Soret peak around 408 nm for cyt. c-SiO2 aerogels and is very similar to the spectrum of cyt. c in solution (Figure 5a). In addition, a spectrum of cyt. c encapsulated within aerogels with metal nanoparticles is also shown (Figure 5b) and the cyt. c-SiO2 aerogel spectrum is similar to this spectrum as well. When the cyt. c-SiO2 aerogel is exposed to nitric oxide, a typical shifting of the Soret peak is observed (Figure 5d).
The UV-vis spectra for gels made from cyt. c solutions in varying buffer concentrations are shown in Figure 6. All of these gels show characteristic UV-visible spectroscopic features indicating that cyt. c is not in a denatured state within the gels. However, the decreased translucency of the gels made from 70 mM buffer results in a lower signal-to-noise ratio for these spectra.
The CD spectra of cyt. c-SiO2 aerogels are similar to the spectra of cyt. c encapsulated within aerogels with metal nanoparticles, while both types of aerogel spectra differ from a spectrum of cyt. c in buffered solution (Figure 7).
Figure 8 shows a typical nitric oxide monitoring response for cyt. c-SiO2 aerogels and corresponding aerogels that also contain metal nanoparticles in addition to cyt. c. The difference between the absorbance at 414 nm and that at 408 nm is seen to increase and then decrease when the gels are exposed to nitric oxide and then nitrogen respectively in succession.
If the supercritical carbon dioxide is not released at a slow enough rate, the viability of the cyt. c within the formed aerogels will be compromised. This is revealed by comparing resulting UV-visible spectra after forming gels by releasing the carbon dioxide at different rates (Figure 9).
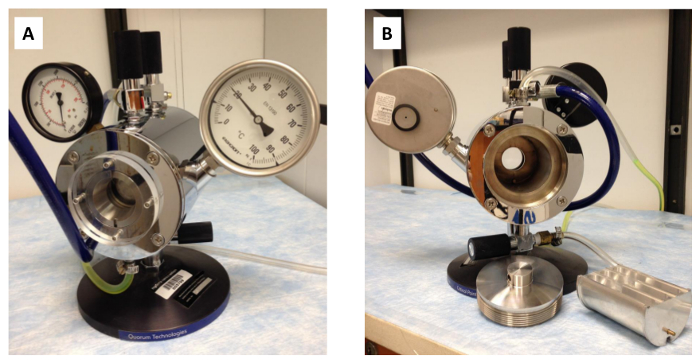
Figure 1: Critical point drying apparatus. The critical point drying apparatus shown from the (A) front and (B) back with the transfer boat and apparatus door shown next to the back of the apparatus.
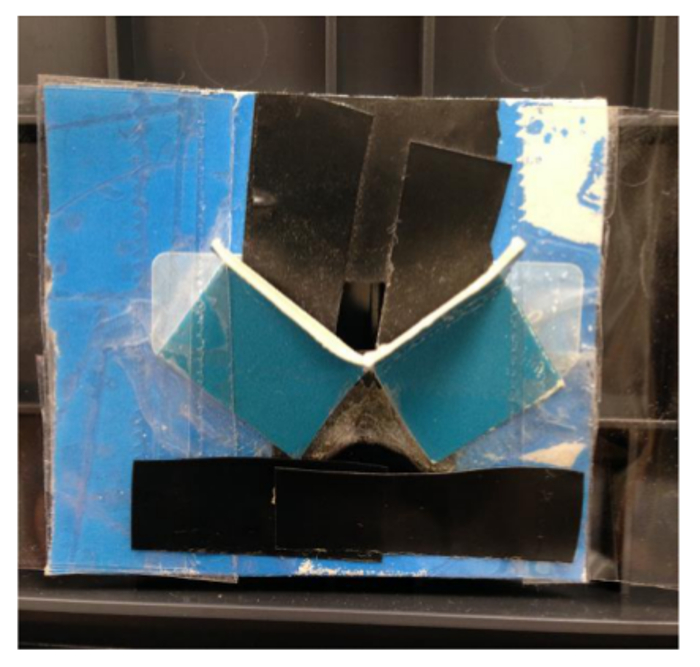
Figure 2: Cardboard platform. The assembled cardboard platform for holding an aerogel in the path of an instrument's beam.
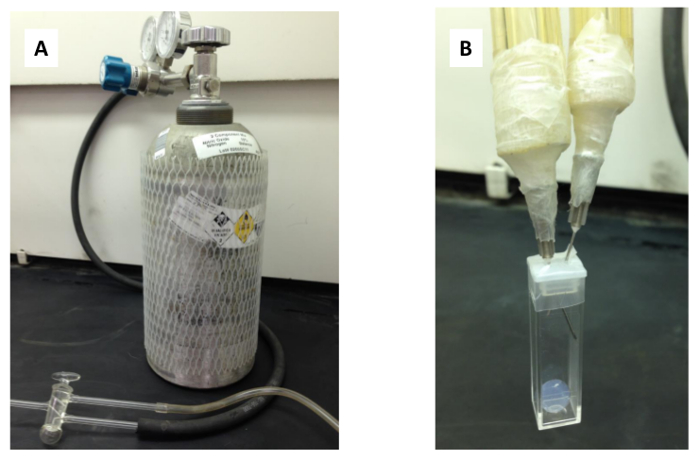
Figure 3: Nitric oxide sensing set-up. The nitric oxide sensing set-up is shown including (A) the fume hood enclosed 10% nitric oxide, 90% nitrogen cylinder, tubing, and T-valve, and (B) the cuvette with inserted needles.
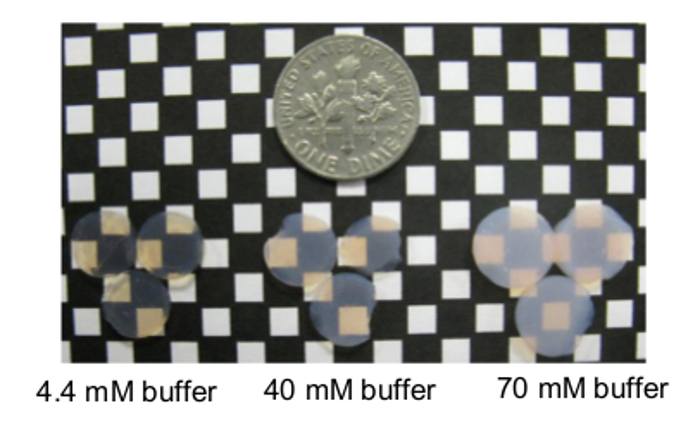
Figure 4: Sample cyt. c-SiO2 aerogels. Aerogels encapsulating 15 μM cyt. c in 4.4 mM, 40 mM, and 70 mM potassium phosphate buffer are shown in comparison to a dime from left to right. These aerogels are approximately 0.2-0.5-cm high. Reprinted with permission9.
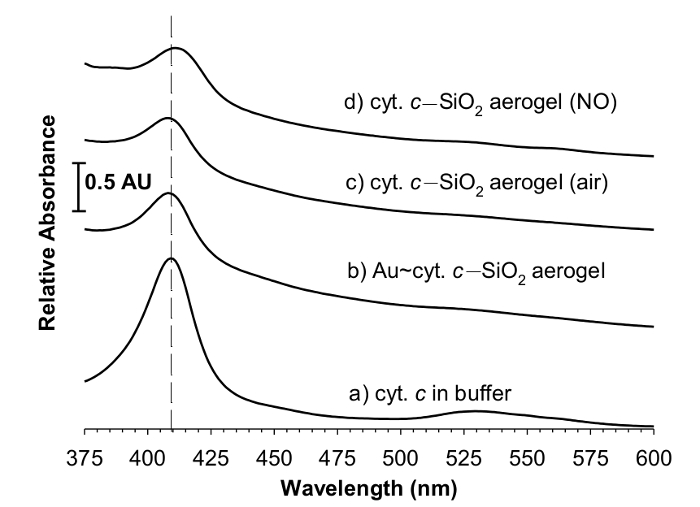
Figure 5: Cyt. c-SiO2 aerogel spectroscopy. Visible spectra of 15 μM cytochrome c in (a) 50 mM phosphate buffer solution; (b) Au(5-nm)~cyt. c-SiO2 aerogel; (c) cyt. c–SiO2 aerogel (exposed to air); (d) cyt. c-SiO2 aerogel (exposed to nitric oxide for 3.5 min). These representative spectra of each type of gel are offset for clarity, and the dashed line denotes the position of the Soret peak of cyt. c in buffer. While each spectrum is of 15 μM cyt. c, the gel thicknesses (or heights) are only 0.2-0.5-cm compared to the 1-cm solution cuvet resulting in a higher solution absorbance. Reprinted with permission9.
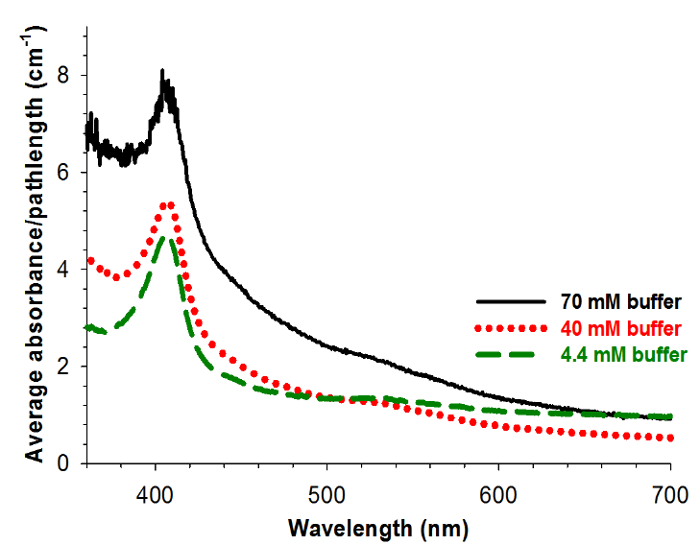
Figure 6: Aerogel spectroscopy as encapsulated buffer concentration is varied. Averaged UV-visible spectral absorbance of aerogels divided by gel path length for gels encapsulating 15 μM cyt. c in 70 mM (black) (average of 4 spectra), 40 mM (red, dotted) (average of 8 spectra), and 4.4 mM (green, dashed) (average of 9 spectra) potassium phosphate buffer. Reprinted with permission9.
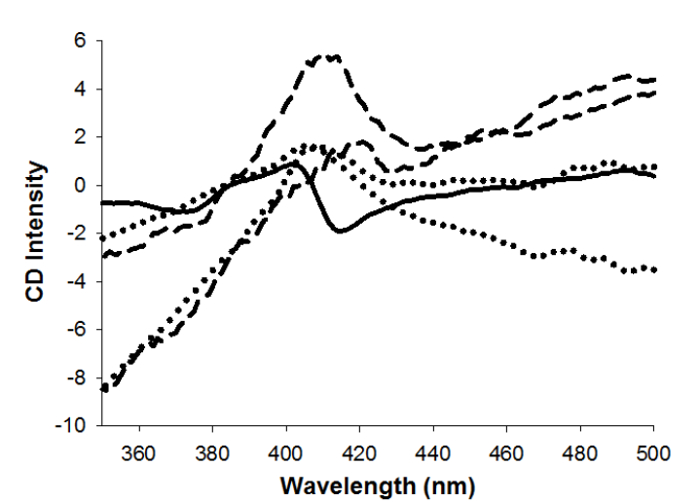
Figure 7: Aerogel circular dichroism spectroscopy. Circular dichroism spectra of cyt. c in sodium phosphate buffered solution (solid), two representative spectra of cyt. c-SiO2 aerogels (dashed), and two representative spectra of Au(5-nm)~cyt. cSiO-2 aerogels (dotted). Reprinted with permission9.
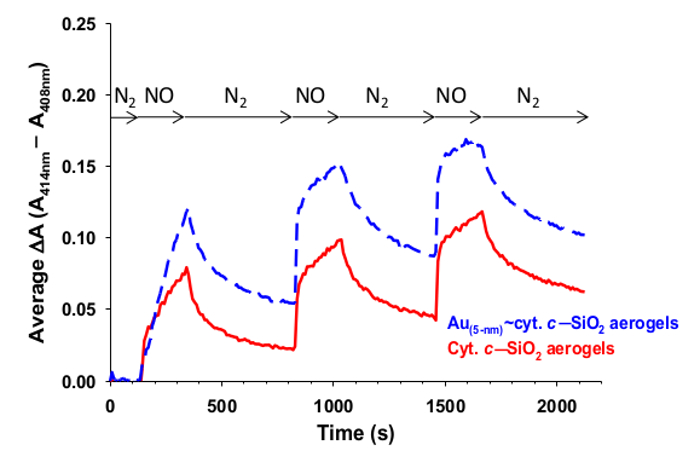
Figure 8: Nitric oxide detection with cyt. c-SiO2 aerogels. Monitoring the shift (ΔA = A414 nm - A408 nm) in the Soret intensity of cyt. c (solid red) and Au~cyt. c (dashed blue) encapsulated in SiO2 composite aerogel nanoarchitectures as gas flow is toggled between nitrogen (where Soret peak maximum is at ~408 nm) and nitric oxide (where Soret peak maximum is at ~414 nm). Each curve is an average of 3-4 trials, with two of the cyt. c-SiO2 trials monitored at ΔA = A414 nm - A407 nm since the initial Soret peak maximum was at 407 nm for these trials. Reprinted with permission9.
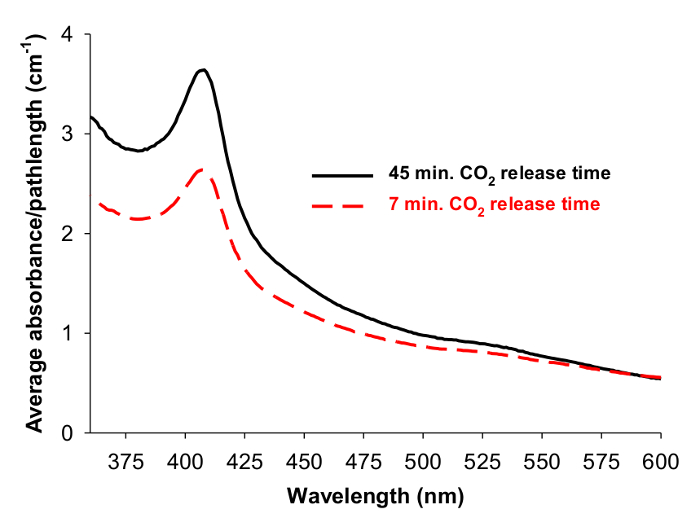
Figure 9: Effect of supercritical fluid release time. Averaged UV-visible spectral absorbance divided by gel path length for cyt. c-SiO2 aerogels encapsulating 10 μM cyt. c in 50 mM phosphate buffer in which the supercritically dried aerogels were made by either releasing supercritical carbon dioxide over 45 min (solid, black (average of 9 spectra)) or 7 min (dashed, red (average of 4 spectra)). Reprinted with permission9.
Discussion
Loading...
$$\rightleftharpoonup{xx}$$
$$\longleftharp{xx}$$,
$$\longrightharp{xx}$$,
As described, this procedure has consistently produced viable cyt. c encapsulated within aerogels. The concentration of cyt. c within the aerogels can be varied from 5 to 15 μM and the buffer concentration of the initial cyt. c solution encapsulated within the aerogels can be varied from 4.4 to 70 mM phosphate without severe detrimental effects on protein viability. However, the peak center and peak width of the characteristic cyt. c Soret peak in aerogels are closest to what they are for cyt. c in solution when cyt. c is encapsulated in aerogels from solutions of 40 mM buffer9.
The synthesis of the cyt. c-SiO2 aerogels is affected by the age of some of the starting reagents. Methanol, tetramethoxysilane, and ammonium hydroxide solution are all hygroscopic and should be replaced every one-to-two months. The increased water that builds up in these reagents over time affects the gel structural characteristics and the sol-to-gel transition time.
When performing supercritical drying, the critical point drying apparatus's transfer boat can hold up to eighteen 0.5 cm thick, 1 cm diameter gels. As outlined in the protocol section, a specific filling and draining procedure should be followed to transfer carbon dioxide into the sol-gels. It is important to note that at the beginning of the draining protocol, the draining mixture of carbon dioxide and acetone flows at such a high rate that the drain tube freezes stiff with moisture condensing to ice on the outside. The mixture draining out contains some water since the acetone is not anhydrous and this water may occasionally freeze to an extent that the drain tube actually clogs. It is necessary to watch for such clogs and to listen for a stoppage of flow. The drain valve should be closed for a few min so the clog will melt if a clog is detected. In the worst case scenario, if the drain valve is not closed, a clog can cause so much pressure to build up that the drain tube forcefully pops off the apparatus. After the first few drain periods, the majority of the acetone will have been rinsed out of the apparatus, and the occurrence of wet ice chunks will decrease dramatically. The discharge will progressively resemble dry ice as the draining protocol continues with any residual evidence of acetone presence (such as scent) becoming undetectable by the end of the draining process.
After the carbon dioxide in the apparatus has transitioned from liquid to supercritical fluid and the venting process has begun, it is necessary to release the fluid at a slow rate over at least 45 min as indicated in the procedure9. A higher rate of release can decrease the viability of cyt. c (as shown in Figure 9) within the aerogels and the aerogels themselves may actually break apart as the fluid rushes to escape from the gels. In general, even when the aerogels remain intact after opening the apparatus door, it is important to handle them carefully and gently as they are brittle and can break easily.
The control silica gels that are poured alongside the cyt. c-SiO2 gels are used after supercritical drying to determine if the carbon dioxide transfer into the gels was successful. Sometimes the cyt. c-SiO2 gels may appear cloudy and it is important to determine if this is due to incomplete solvent transfer or if it may have to do with the concentration of the cyt. c or buffer encapsulated within the gels. If the silica gels without cyt. c appear to have a homogeneous, translucent appearance throughout, this can be taken as evidence that the solvent transfer occurred completely even if the cyt. c-SiO2 gels have some cloudiness to them. Cloudiness within the silica gels without cyt. c after drying indicates that some acetone remained inside the gels during the venting.
As indicated in the protocol section, important safety precautions need to be taken when working with nitric oxide (NO). To detect NO using the aerogels, it is necessary to seal the cuvette very well and to exhaust the gas flowing over the aerogels into a fume hood. Alternatively, the whole spectrophotometer can be moved into a fume hood along with the NO gas cylinder as an added precaution to limit exposure to NO gas. On contact with air NO will immediately produce the highly poisonous nitrogen dioxide, nitrogen tetroxide or both. NO can also react with water to produce heat and corrosive fumes. Therefore, sustained exposure to NO may result in direct tissue toxicity.
When using the cyt. c-SiO2 aerogels to detect the presence of nitric oxide, the Soret band will initially be at ~408 nm and will shift to ~414 nm in the presence of nitric oxide. After switching back to nitrogen, the Soret band should reverse back to being centered at ~408 nm. It may also be possible to use the cyt. c-SiO2 aerogels to detect the presence of other ligands such as carbon monoxide27.
Different published procedures include an added step of combining gold or silver nanoparticles with cyt. c in solution prior to mixing with the sol and supercritically drying to form aerogels4-8. Comparing the UV-visible spectroscopy of cyt. c encapsulated in aerogels with metal nanoparticles to that of cyt. c encapsulated in aerogels without metal nanoparticles shows that these two types of encapsulation techniques produce cyt. c of similar viability within the aerogels (Figure 5). However, the cyt. c encapsulated with metal nanoparticles is slightly more stable than cyt. c encapsulated without metal nanoparticles within the aerogels9. The CD spectra of both types of cyt. c aerogels are also similar, although both differ from the spectrum of cyt. c in buffer indicating some unfolding of cyt. c within the aerogels (Figure 7). Previous reports on cyt. c encapsulated in aerogels suggest that the circular dichroism spectroscopy is most likely assessing the outermost layer of protein, unfolded upon contact with the silica gel, within either metal nanoparticle-nucleated multilayered cyt. c structures or loosely organized structures that form when no metal nanoparticles are present in aerogels4,9. The majority of the cyt. c within either type of self-organized structure inside the aerogels remains folded as measured by the UV-visible spectroscopy though. The advantage of the protocol described herein sans nanoparticles is that expensive purchase or time-consuming synthesis of metal nanoparticles is not necessary. Proteins have not often been successfully encapsulated within aerogels, and so this procedure is important in that it may lead to the development of a more general method for encapsulating other proteins in aerogels with potential significance for future bioanalytical devices.
Disclosures
Loading...
$$\rightleftharpoonup{xx}$$
$$\longleftharp{xx}$$,
$$\longrightharp{xx}$$,
The authors declare that they have no competing financial interests.
Acknowledgements
Loading...
$$\rightleftharpoonup{xx}$$
$$\longleftharp{xx}$$,
$$\longrightharp{xx}$$,
Support for this work and/or publication was provided by the Science Institute of Fairfield University's College of Arts and Sciences, Fairfield University's Faculty Research Grant, a Cottrell College Science Award from the Research Corporation for Science Advancement, Fairfield University's College of Arts & Sciences and Fairfield University's Chemistry & Biochemistry Department. We gratefully acknowledge Jean Marie Wallace for much helpful insight and advice in regards to this general research area. In addition, we extend a very special thank you to all past, current, and future undergraduate researchers of the Harper-Leatherman Research Lab.
Materials
| Name | Company | Catalog Number | Comments |
|---|---|---|---|
| Potassium phosphate, monobasic | Fisher Scientific | P285-500 | Certified ACS (also possible to use sodium phosphate monobasic) |
| Potassium phosphate dibasic anhydrous | Fisher Scientific | P288-500 | Certified ACS (also possible to use sodium phosphate dibasic) |
| Water | Millipore Direct-Q | 18 MΩ cm | |
| pH meter and electrode | Denver Instrument | UB-10 | |
| Cytochrome c from equine heart | Sigma Aldrich | C7752-100MG | ≥95% based on Mol. Wt. 12,384, used as received and stored at -20 °C |
| Glass scintillation vials | Wheaton | 03-341-25J | 20 ml, O.D. x height (with cap): 28 mm x 61 mm |
| Disposable cuvette | Fisher Scientific | 14-955-126 | methacrylate, 10 mm x 10 mm x 45 mm |
| Ultraviolet Visible Spectrophotometer | Shimadzu | UV-1800 | Uses UVProbe v 2.33 software |
| Circular dichroism spectrometer (or spectropolarimeter) | JASCO | J-810 | |
| Isotemp Laboratory Refrigerator | Fisher Scientific | ||
| Polypropylene disposable beakers | Fisher Scientific | 01-291-10 | 50 ml |
| Tetramethylorthosilicate (also known as tetramethoxysilane, TMOS) | Sigma Aldrich | 218472-500G | 98% purity |
| Methanol | Fisher Scientific | A457-4 | GC Resolv grade |
| Ammonium hydroxide solution | Sigma Aldrich | 221228-25ML-A | ACS reagent, 28.0%-30.0% |
| General purpose polypropylene scintillation vials | Sigma Aldrich | Z376825-1PAK | 16 mm x 57 mm, volume size 6.5 ml, slice off bottom with sharp knife or razor |
| generic plastic wrap | various | ||
| Parafilm M laboratory wrapping film | Fisher Scientific | S37440 | |
| Plastic syringe plunger | various | use syringe plunger from 3 ml syringe | |
| Ethyl alcohol | Acros | 61509-0040 | Absolute, 200 proof, 99.5% A.C.S. reagent |
| Acetone | Fisher Scientific | A949-4 | HPLC grade |
| Critical point drying apparatus | Quorum Technologies | E3000 Series | |
| Circulator | Fisher Scientific | Isotemp 3016 | |
| Carbon dioxide cylinder | Tech Air | siphon tube | |
| Micrometer | Central Tool Company | ||
| GRAMS/AI 8.0 software | Thermo Electron Corporation | ||
| Nitrogen cylinder | Tech Air | Another inert gas could be substituted | |
| 10% nitric oxide/90% nitrogen cylinder | Airgas | ||
| Tygon tubing | various | ||
| T-switch valve | various | ||
| syringe needles | various |
References
Loading...
$$\rightleftharpoonup{xx}$$
$$\longleftharp{xx}$$,
$$\longrightharp{xx}$$,
- Pettigrew, G. W., Moore, G. R. Cytochromes c. Biological Aspects. , SpringerVerlag. Berlin. (1987).
- Moore, G. R., Pettigrew, G. W. Cytochromes c. Evolutionary, Structural, and Physicochemical Aspects. , SpringerVerlag. Berlin. (1990).
- Scott, R. A., Mauk, A. G. Cytochrome c: A Multidisciplinary Approach. , University Science Books. Sausalito, CA. (1996).
- Wallace, J. M., Rice, J. K., Pietron, J. J., Stroud, R. M., Long, J. W., Rolison, D. R. Silica nanoarchitectures incorporating self-organized protein superstructures with gas-phase bioactivity. Nano Lett. 3 (10), 1463-1467 (2003).
- Wallace, J. M., Dening, B. M., Eden, K. B., Stroud, R. M., Long, J. W., Rolison, D. R. Silver-colloid-nucleated cytochrome c. superstructures encapsulated in silica nanoarchitectures. Langmuir. 20 (21), 9276-9281 (2004).
- Wallace, J. M., Stroud, R. M., Pietron, J. J., Long, J. W., Rolison, D. R. The effect of particle size and protein content on nanoparticle-gold-nucleated cytochrome c. superstructures encapsulated in silica nanoarchitectures. J.Non-Cryst. Solids. 350, 31-38 (2004).
- US Patent. , 7,238,729 U.S. Patent 6,824,776 (2004) (2007).
- Harper-Leatherman, A. S., Wallace, J. M., Rolison, D. R. Cytochrome c. stabilization and immobilization in aerogels. Enzyme Stabilization and Immobilization: Methods and Protocols. Minteer, S. D. 679, Springer. New York, NY. 193-205 (2011).
- Harper-Leatherman, A. S., et al. Simplified procedure for encapsulating cytochrome c. in silica aerogel nanoarchitectures while retaining gas-phase bioactivity. Langmuir. 28 (41), 14756-14765 (2012).
- Hitihami-Mudiyanselage, A., Senevirathne, K., Brock, S. L. Assembly of phosphide nanocrystals into porous networks: Formation of InP gels and aerogels. ACS Nano. 7 (2), 1163-1170 (2013).
- Fricke, J. Aerogels. , Springer-Verlag. Berlin. (1986).
- Hüsing, N., Schubert, U. Aerogels-airy materials: chemistry, structure, and properties. Angew. Chem. Int. Edit. 37 (1-2), 22-45 (1998).
- Aerogels Handbook. Aegerter, A. M., Leventis, N., Koebel, M. M. , Springer. New York, NY. (2011).
- Kazuyoshi, K. Recent progress in aerogel science and technology. Adv. Porous Mater. 1 (2), 147-163 (2013).
- Leventis, N., Elder, I. A., Anderson, M. L., Rolison, D. R., Merzbacher, C. I. Durable modification of silica aerogel monoliths with fluorescent 2,7-diazapyrenium moieties. Sensing oxygen near the speed of open-air diffusion. Chem. Mater. 11 (10), 2837-2845 (1999).
- Plata, D. L., et al. Aerogel-platform optical sensors for oxygen gas. J. Non-Cryst. Solids. 350, 326-335 (2004).
- Rolison, D. R., Pietron, J. J., Long, J. W. Controlling the sensitivity, specificity, and time signature of sensors through architectural design on the nanoscale. ECS Trans. 19 (6), 171-179 (2009).
- Carroll, M. K., Anderson, A. M. Aerogels as platforms for chemical sensors. Aerogels Handbook. Aegerter, A. M., Leventis, N., Koebel, M. M. , Springer. New York, NY. 637-650 (2011).
- Rolison, D. R. Catalytic nanoarchitectures-The importance of nothing and the unimportance of periodicity. Science. 299 (5613), 1698-1701 (2003).
- Pietron, J. J., Stroud, R. M., Rolison, D. R. Using three dimensions in catalytic mesoporous nanoarchitectures. Nano Lett. 2 (5), 545-549 (2002).
- Anderson, M. L., Morris, C. A., Stroud, R. M., Merzbacher, C. I., Rolison, D. R. Colloidal gold aerogels: Preparation, properties, and characterization. Langmuir. 15 (3), 674-681 (1999).
- Anderson, M. L., Stroud, R. M., Rolison, D. R. Enhancing the activity of fuel-cell reactions by designing three-dimensional nanostructured architectures: Catalyst-modified carbon-silica composite aerogels. Nano Lett. 3 (9), 1321(2003).
- Chervin, C. N., et al. Defective by design: vanadium-substituted iron oxide nanoarchitectures as cation-insertion hosts for electrochemical charge storage. J. Mater. Chem. A. 3 (22), 12059-12068 (2015).
- Ellerby, L. M., et al. Encapsulation of proteins in transparent porous silicate-glasses prepared by the sol-gel method. Science. 255 (5048), 1113-1115 (1992).
- Massari, A. M., Finkelstein, I. J., Fayer, M. D. Dynamics of proteins encapsulated in silica sol-gel glasses studied with IR vibrational echo spectroscopy. J. Am. Chem. Soc. 128 (12), 3990-3997 (2006).
- Ray, A., Feng, M., Tachikawa, H. Direct electrochemistry and Raman spectroscopy of sol-gel-encapsulated myoglobin. Langmuir. 21 (16), 7456-7460 (2005).
- Blyth, D. J., Aylott, J. W., Richardson, D. J., Russell, D. A. Sol-gel encapsulation of metalloproteins for the development of optical biosensors for nitrogen-monoxide and carbon-monoxide. Analyst. 120 (11), 2725-2730 (1995).
- Lan, E. H., Dave, B. C., Fukuto, J. M., Dunn, B., Zink, J. I., Valentine, J. S. Synthesis of sol-gel encapsulated heme proteins with chemical sensing properties. J. Mater. Chem. 9 (1), 45-53 (1999).
- Miller, J. M., Dunn, B., Valentine, J. S., Zink, J. I. Synthesis conditions for encapsulating cytochrome c. and catalase in SiO2 sol-gel materials. J. Non-Cryst. Solids. 202 (3), 279-289 (1996).
- Ronda, L., Bruno, S., Faggiano, S., Bettati, S., Mozzarelli, A. Oxygen binding to heme proteins in solution, encapsulated in silica gels, and in the crystalline state. Methods in Enzymology. Poole, R. K. 437, Elsevier Academic Press. San Diego, CA. 311-328 (2008).
- Margoliash, E., Frohwirt, N. Spectrum of Horse-Heart Cytochrome c. Biochem. J. 71 (3), 570-572 (1959).
Reprints and Permissions
Request permission to reuse the text or figures of this JoVE article
Request Permission