The cheetah (Acinonyx jubatus) is an iconic, endangered species, but conservation efforts are challenged by habitat shrinkage and conflict with commercial farmers. The footprint identification technique, a robust, accurate and cost-effective image classification system, is a new approach to monitoring cheetahs.
Method Article
Spotting Cheetahs: Identifying Individuals by Their Footprints
In This Article
Summary
Abstract
The cheetah (Acinonyx jubatus) is Africa's most endangered large felid and listed as Vulnerable with a declining population trend by the IUCN1. It ranges widely over sub-Saharan Africa and in parts of the Middle East. Cheetah conservationists face two major challenges, conflict with landowners over the killing of domestic livestock, and concern over range contraction. Understanding of the latter remains particularly poor2. Namibia is believed to support the largest number of cheetahs of any range country, around 30%, but estimates range from 2,9053 to 13,5204. The disparity is likely a result of the different techniques used in monitoring.
Current techniques, including invasive tagging with VHF or satellite/GPS collars, can be costly and unreliable. The footprint identification technique5 is a new tool accessible to both field scientists and also citizens with smartphones, who could potentially augment data collection. The footprint identification technique analyzes digital images of footprints captured according to a standardized protocol. Images are optimized and measured in data visualization software. Measurements of distances, angles, and areas of the footprint images are analyzed using a robust cross-validated pairwise discriminant analysis based on a customized model. The final output is in the form of a Ward's cluster dendrogram. A user-friendly graphic user interface (GUI) allows the user immediate access and clear interpretation of classification results.
The footprint identification technique algorithms are species specific because each species has a unique anatomy. The technique runs in a data visualization software, using its own scripting language (jsl) that can be customized for the footprint anatomy of any species. An initial classification algorithm is built from a training database of footprints from that species, collected from individuals of known identity. An algorithm derived from a cheetah of known identity is then able to classify free-ranging cheetahs of unknown identity. The footprint identification technique predicts individual cheetah identity with an accuracy of >90%.
Introduction
The cheetah (Acinonyx jubatus) is Africa's most endangered felid and listed as Vulnerable with a declining population trend by the IUCN Red List of Threatened Species1. The global cheetah population is estimated to be between 7-10,000 individuals1 and Namibia is recognized as the largest stronghold of the free-ranging cheetah, with perhaps more than a third of the world's population4,6,7. Population estimates for Southern Africa in 2007 placed Namibia's cheetah population at 2,000 with the next nearest range state Botswana with 1,800, followed by South Africa (550), Zimbabwe (400), Zambia (100), Mozambique (<5). Several states were unassessed7.
Namibian authorities have a clearly stated vision of "Secure, viable cheetah populations across a range of ecosystems that successfully coexist with, and are valued by, the people of Namibia." However, livestock and game farming are major land uses in Namibia8,9 and landowners regularly trap and kill cheetah on their properties in an attempt to reduce predation of livestock or valuable wildlife. More than 1,200 cheetahs were removed from 1991 to 2006, but not all such 'offtakes' were recorded10. Moreover, there is a debate on whether or not this is an effective solution to the farmer-cheetah conflict. The removal of animals perceived as causing conflict, by killing or translocation may be less effective than mitigation of conflict by other means, such as better livestock protection11. Published rates of survival for 12 months post-translocation have ranged from 18%11 to 40%12.
Collecting reliable data on the numbers, identity and distribution of cheetah in Namibia is key to addressing human-cheetah conflict situations. Current cheetah monitoring techniques range from targeted questionnaires from the Namibian Ministry of Environment and Tourism to stakeholders4 to opportunistic observations by tourists and government reports4, to the use of camera-traps13, GPS or VHF collars10,14, farmer interview surveys8, and even spot pattern15. However, comparison of the efficacy of these techniques without a common benchmark or quantification of survey effort is difficult. Each has limitations; GPS satellite and VHF collars are expensive and often unreliable, targeted questionnaires have limited scope, and camera-traps have limited range.
Estimates produced by these different methods vary widely. Marker et al.10 highlighted the need for a more coordinated approach. A variety of methods have been used on the farmlands to estimate cheetah population density, and these have produced a range of estimates. For example, a radio-telemetry study estimated 2.5 (± 0.73) cheetahs/1,000 km2 while a camera-trap study estimated 4.1 (± 0.4) cheetahs/1,000 km2 (Marker et al. 2007). This variation highlights the problem of using different methods to estimate density, but so far no single, effective, repeatable technique has been identified which could be used across the wide range of habitats that cheetahs occupy in Namibia. This remains a problem for effective cheetah monitoring and conservation.
This challenge sparked the development of a robust, cost-effective and flexible tool for monitoring the cheetah. The footprint identification technique was first developed for black rhino16 and subsequently adapted for a wide range of species including white rhino17, Amur tiger18, mountain lion19, and others.
Various studies have indicated that it is possible to use footprints to identify large carnivores by species, individuals, and sex. The process has evolved from simple shape description of footprints20 to a comparison of measurements21, to statistical analysis of one or several measurements16,17,22-30 and shape analysis31.These efforts have had varying success, depending largely on the rigor of the data collection and analytical processes, and the number of test animals used to develop the training datasets. There are several practical advantages of using footprints. The first is that images can be collected alongside other non-invasive approaches (e.g., camera-trapping, DNA collection from hair/feces, etc.) with very little extra effort or cost. Secondly, footprints are, where substrate permits, the most ubiquitous sign of animal activity.
The footprint identification technique is the first robust footprint identification technique described for cheetah and is applicable at any site where footprints are found. Footprints must be sufficiently defined that the toes and heel of the print can be seen clearly with the naked eye. Field operators must familiarize themselves with the basic anatomy of the cheetah foot and be able to identify prints in the area of interest, and distinguish them from prints of any other sympatric large carnivores. The technique can either be used as a census technique (e.g., how many cheetahs are represented by the footprints collected?) or as a tool to monitor specific individuals. Footprints can also be used as 'marks' in mark-recapture analyzes, using the technique to identify individuals, and then calculate local densities of the species. Data collection requires only a basic digital camera and scale.
Protocol
ETHICS STATEMENT: The footprint identification technique is a non-invasive technique. No biological samples were taken. Only registered captive cheetah with permit documentation were used. Cheetah participation was limited to walking along a sand trail to leave footprints in exchange for a food reward.
NOTE: This protocol explains the use of a data visualization software such as JMP, hereafter referred to as ‘data visualization software’ to classify footprints using the footprint identification technique.
SAFETY STATEMENT: Cheetahs were never left unguarded (2 people) and were placed in separate holding facilities where possible. Captive cheetahs used to handling were lured directly over a sand trail to make footprints. Other animals less amenable to handling were lured from outside the enclosure.
TERMINOLOGY: Track: One footprint; Trail: An unbroken series of footprints made by a single animal.
1. Collecting Footprints
- Patch preparation and protocol
- Gather the following materials for the protocol: a fine rake, or a coarse rake and tamper, hand sprinkler or watering can, two standard rulers (cm) or one carpenters' folding ruler for framing the print, a standard digital camera (minimum resolution 1,200 x 1,600 pix), an umbrella for shade if necessary and standard footprint labels with data recording spaces to record the name of photographer, date, footprint series, discrete print ID, animal ID, location and depth if > 2 cm).
- Work early morning or late afternoon for maximum light contrast on the prints. If this is not possible, artificial shade from an umbrella can improve heel and toe pad definition when the sun is overhead.
- Lay a path of about 1 cm depth of either natural substrate or builders' sand. Make sure it is about 2-3 m wide and run for between 3 and 15 m along a perimeter fence or habitual movement path.
- Wet and smooth the substrate with standard gardening tools to improve print quality and definition. Manually remove leaves and pebbles, if present.
- Collecting footprints for the training dataset
- Lure the cheetah across sand path with a food reward. After the footprints have been made, lead the animal away from the path.
- After imaging each footprint trail (see 1.3) brush the tracks away and prepare the surface for recording the next trail.
- Only collect left hind prints for the training dataset. The left hind foot has the leading toe (toe 3), toe 4 and toe 5 making a slope to the left. Front feet are broader than hind feet. Spend time learning how to identify them before imaging.
- Imaging the footprints using the footprint identification technique protocol
- Highlight the position of the individual footprints along the trail by manually drawing a circle around each left hind footprint. Use a stick or any other suitable local tool.
- Image the first footprint as follows
- Place a metric scale about 1 cm below and to the left of the footprint.
- Under the scale, and not touching the footprint, place a photographic ID slip, and write in the pre-allocated spaces the name of photographer, date, footprint series, depth (if >2 cm) discrete print ID, animal ID and location.
- Straddle the print and point the camera lens directly overhead the footprint, to avoid any parallax error in the image with relation to the scale or photo ID slip. Use a tripod or assistant to check if necessary.
- Ensure that the footprint, rule and photo ID slip completely fill the frame.
- Collect around 20 good quality left hind prints to complete the collection for that animal. If 20 prints are not available from the first trail, repeat processes from 1.1.6 to 1.3.5 with the same animal.
2. Image Feature Extraction Prior to the Footprint Identification Technique Analysis
- Double click on the footprint identification technique icon and open it as an add-in to the data visualization software. Observe the home window on the screen. Select 'Image Feature Extraction' to show this new window. The footprint identification technique runs on a data visualization software script in the coding language jsl. The main menu is shown in Fig. 1.
- Using a mouse, drag and drop the first footprint image into the image feature extraction window. A feature extraction template guide is shown on the left of the window.
- Click and select the 'resize' button to ensure that the footprint image is inside the graphics window. Click on the lowest points on the outside toes (toes 2 and 5) to place markers and then select 'rotate'. Observe that the image is rotated horizontally on the line joining the points, to standardize orientation. Observe a set of crosshairs automatically appear to be used in step 2.6.
- If the substrate is more than 1 cm deep, make a depth correction to the algorithm by clicking the "substrate depth" button.
- Click to place two scale points at the required scale. For the cheetah set the scale at 10 cm, set on the scale factor box.
- Using the template on the left of the graphics window, place 25 landmark points sequentially. Landmark points are defined anatomical points on the footprint, for example the most anterior, posterior, lateral and medial points of each toe and the heel. Use the crosshairs to improve accuracy for novice users. Observe a prompt appear on the top left of the image to show the sequence of points.
- Select 'Derived points' to generate a further fifteen points from the landmark points. This process augments the number of variables available for the algorithm development.
- Complete all data fields for the footprint image; cheetah, track, trail, date, time and location point (GPS). Fig. 2 shows stages 2.2-2.8.
- Press the 'append row' button to send 136 scripted variables (distances, angles, areas) to a row in the database.
- Repeat stages 2.1 to 2.9 for all footprints until the database is populated with the x.y coordinates for each landmark and derived point and all the calculated variables for each footprint.
- Copy all the rows in the database and paste them below the database. This duplication set is called the Reference Centroid Value (RCV) and acts to stabilize the footprint identification technique model for subsequent pairwise comparison of footprint trails.
3. Development of the Footprint Identification Technique Algorithm for the Cheetah
- Pairwise robust cross-validated discriminant analysis
- From the main menu, select and open the robust cross-validated pairwise analysis window (Fig. 3). The footprint identification technique model uses a classifier to determine the likelihood of a pair of trails belonging to the same individual or two different individuals (Fig. 4).
- Carry out a pairwise comparison of trails using the training database of known individuals as follows:
- Select Cheetah as 'input x, model category', and trails as 'input trails'. The y columns (footprint measurements), as continuous variables, are automatically populated.
- Select 'Run'. Observe a progress bar showing the analysis in progress. Observe a data table appear showing the pairwise comparisons of trails.
- Observe two outputs, an assigned self/non-self table to describe the classification distance between each validation pair, and a classification matrices window showing the different trails selected for comparison, and the contour probability. Observe the show model button that shows the variables used for each comparison, and the distance threshold box that gives the distance between centroids.
- Select the 'clusters' button at the base of the assigned self/non-self table. Observe two tables. The first shows distances between any two trails. The second is a 'cluster' dendrogram — the final output for the classification of chosen variables. Visualize the classification clusters by clicking on any branch of the dendrogram to color-code it.
- Test the accuracy of classification by varying the number of variables (measurements) and the contour probability (the confidence interval around the centroid value). Re-visualize the data in the cluster dendrogram generated using 18 variables (Fig. 5a). This gives the correct prediction of seven cheetahs. Figures 5b (24 variables) & c (10 variables) show different estimates of cheetah numbers obtained by testing different variable and contour probability inputs.
NOTE: The distribution curve with the sliding scale gives the relative probability (chance) of the predicted number starting with 100%. As the sliding scale is moved the relative probability for each estimate either side of the predicted value is shown. Figure 5d shows the outcome with 18 variables, with the sliding scale moved in one direction to show that the chance of ten cheetahs is less than 50%. - Select the algorithm that consistently gives the highest accuracy. Adjust the threshold value to allow the algorithm to be set to produce the outcome that best approximates to the number of animals known in the training database (Fig. 5a).
- Full holdback trial for validation
Validate the algorithm for both the expected number of individuals and the accuracy of the clustering classification using holdback trials and randomly apportion the individual cheetah in the dataset to test and training sets (Fig. 6). The steps to use are as follows:- From the reference database, decide on a suitable interval for the sequential partitioning of the dataset into test and training set sizes. For the cheetah database, use the interval as 4.
- Randomly select four individuals as the test dataset (leaving 34 in the training set). Hide the identities of the four test individuals selected.
- Click the "Pairwise Data Analysis" option and select all the trails for the four test individuals.
- Click "Run" to launch the footprint identification technique analysis. The analysis will give a prediction for the number of individuals in the test dataset. Iterate this process nine more times (total 10), each time randomly selecting four individuals.
- Calculate the mean predicted value for this test size (i.e., four). Then repeat the process sequentially for eight randomly selected individuals (depending on the interval size) and then 12 and so on with ten iterations for each test size. Calculate mean predicted value for each test size.
- Using a graphing software plot a graph as shown in Fig. 6. The red line shows the actual test size plotted against self, the green asterisks show the predicted number of individuals for each iteration and the blue line shows the mean predicted values for each test size. The closeness of the red and blue lines is an indicator of the accuracy of the footprint identification technique analysis.
Results
Individual identification
The ability of the footprint identification technique to classify individual cheetah is contingent on two factors, the use of a standardized footprint collection protocol and a new statistical model based on a cross-validated pairwise discriminant analysis with a Ward's clustering analysis. These are facilitated by an integrated graphic user interface for data visualization (Fig. 1). Minimal equipment is needed, making this technique cost-effective (Materials List). Data collected with the footprint included the number of cheetahs, number of footprint images collected, range of footprints per cheetah, number of trails, range of trails per cheetah and age-range of cheetahs (Table 1).
781 footprints (M:F 395:386) belonging to 110 trails, from 38 individuals, were collected for the training dataset. Table 1 gives a summary of data collected. Using the feature extraction window (Fig. 2) a set of 25 landmark points were able to generate 15 derived points on each footprint image. From these landmark and derived points 136 variables were generated for each footprint, comprising distances, angles and areas. Each row in the database therefore represented the 136 variables generated by a single footprint. Footprints were processed by trail. A varying number of rows represented each trail, and were marked as such.
These data were duplicated into the data table as an entity then referred to as the Reference Centroid Value (RCV) that acts to stabilize the pairwise comparison of trails necessary for individual classification. The pair-wise analysis window (Fig. 3) was designed to help validate the data and/or test for data from unknown populations. Figure 4 shows the outcome of a pair-wise comparison of trails from the same individual (A) and two different individuals (B) based on the footprint identification technique customized model. The classifier incorporated into the model is based on the presence or absence of overlap between the ellipses. Note that the analysis is performed for each pairwise comparison in the presence of a third entity, i.e., the reference centroid value (RCV).
Using a robust pairwise cross-validated discriminant analysis with a Ward's clustering analysis, an algorithm was generated to provide effective classification of individuals. The footprint identification technique algorithm is based on three adjustable entities; the number of measurements used, the ellipse size (confidence interval used), and the threshold value that determines the cut-off value for the clusters. Each of these entities is adjusted in the software until the highest accuracy for classification is achieved for the training set of animals of known identity. This same algorithm can then be used to identify unknown cheetahs. For example, Figures 5a, b & c show a dendrogram of a sample of trails from seven cheetahs showing the correct prediction when the algorithm is optimized (a) and when the algorithm is suboptimal (b & c).
Holdback trials were conducted to validate the algorithm derived from the training set of 'known' individuals. These were carried out sequentially by varying the proportion of cheetahs in the test and training sets. Rather than apportioning cheetahs to training and test sets arbitrarily, analyses were performed sequentially increasing the test set size. For each test set, 10 iterations were performed with cheetahs being selected randomly for each iteration. For each test set, this allowed a mean value to be calculated. Figure 6. shows the varying test size plotted against itself (red), and on the y-axis the predicted value for each test size iteration (green) and the mean predicted value for each test size (blue). The plot demonstrates that even when the test set size is increased considerably (n=28) compared with the training set size (n=10), the mean predicted value is similar to the expected value.
Using several holdback trials, the accuracy of individual identification was consistently >90% for both the predicted number of individuals and, just as importantly, the classification of trails, i.e., whether the trails from the same individual (self-trails) and those from different individuals (non-self-trails) classified correctly. A cluster dendrogram representing all 38 individual cheetahs is shown (Fig. 7). There were 110 trails, generating a total of 5,886 pairwise comparisons. Of these, there were 46 misclassifications giving an accuracy of 99% (Table 2).
| # of cheetahs | # of footprint images | Range of footprints per cheetah | # of trails | Range of trails per cheetah | Age range (yrs) | |
| Females | 16 | 386 | 12 - 36 | 55 | 2 - 5 | 2.5 - 8.5 |
| Males | 22 | 395 | 7 - 32 | 54 | 1 - 4 | 1 - 11 |
| Total | 38 | 781 | 7 - 36 | 109 | 1 - 5 | 1 - 11 |
Table 1. Summary of collected data. The number of cheetahs, the number of footprint images collected, the range of footprints per cheetah, the number of trails, the range of trails per cheetah and the age-range of cheetahs.
| Self | Non-self | Total | Misclassifications | |
| Self (N) | 117 | 9 | 126 | 9 |
| Self (%) | 93 | 7 | 100 | 7 |
| Non-self (N) | 37 | 5,723 | 5,760 | 37 |
| Non-self (%) | 1 | 99 | 100 | 1 |
| Total (N) | - | - | 5,886 | 46 |
| Total (%) | - | - | 100 | 1 |
Table 2. The output in the footprint identification technique software shows the classification of trails based on pairwise comparison. 'Self ' refers to trails from the same individual and 'non-self', trails from different individuals. Each trail was matched against every other trail using a customized robust cross-validated discriminant analysis model. 110 trails resulted in 5,886 pairwise comparisons and the overall classification accuracy was 99%.
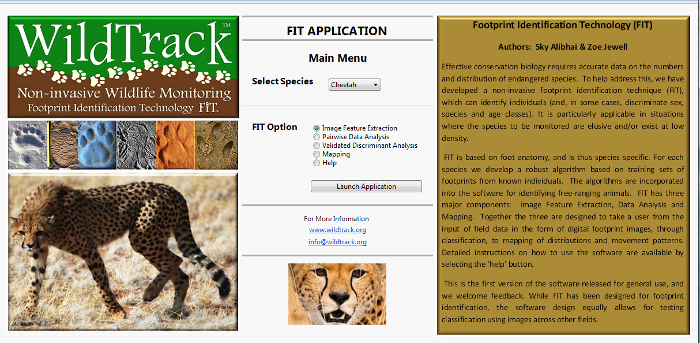
Figure 1. The opening main menu window in the footprint identification technique. This is an image identification add-in to the data visualization software, designed to classify footprints by individual, sex and age-class from morphometric measurements. A graphic user interface allows the seamless navigation between different options. Please click here to view a larger version of this figure.

Figure 2. The feature extraction window. Capabilities include drag and drop images, automatic resizing to the window, rotation of images for standardization, substrate depth factoring, etc. Pre-assigned landmark points are manually positioned and generate a series of scripted derived points to enable the extraction of metrics in the form of distances, angles and areas. The output is in the form of a row of data providing the x.y co-ordinates and the metrics. Please click here to view a larger version of this figure.
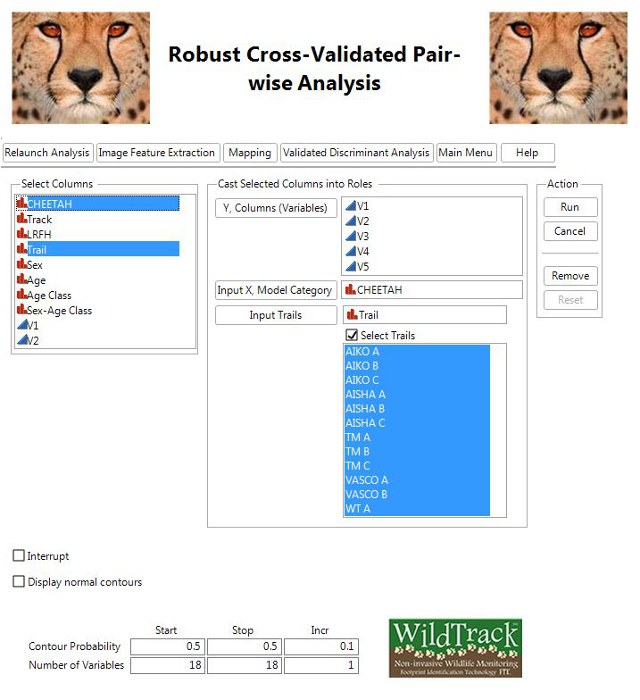
Figure 3. Pairwise data analysis window in the footprint identification technique. Once a database of measurements has been created, the pair-wise analysis window is designed to help validate the data and/or test for data from unknown populations. The analysis is based on a customized model incorporating a constant, reference centroid value (RCV), which compares pairs of trails sequentially16,17. The final output is in the form of a cluster dendrogram that provides a prediction for the number of individuals and the relationship between the trails. Please click here to view a larger version of this figure.
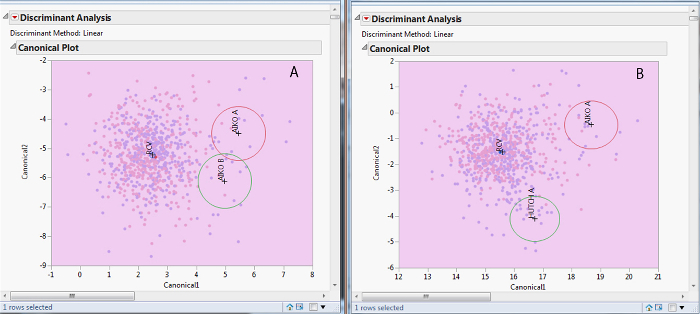
Figure 4. Pairwise comparisons. The figure shows the outcome of a pair-wise comparison of trails from the same individual (A) and two different individuals (B) based on a customized model in the data visualization software. The classifier incorporated into the model is based on the presence or absence of overlap between the ellipses. Note that the analysis is performed for each pairwise comparison in the presence of a third entity, i.e., the reference centroid value (RCV). Please click here to view a larger version of this figure.
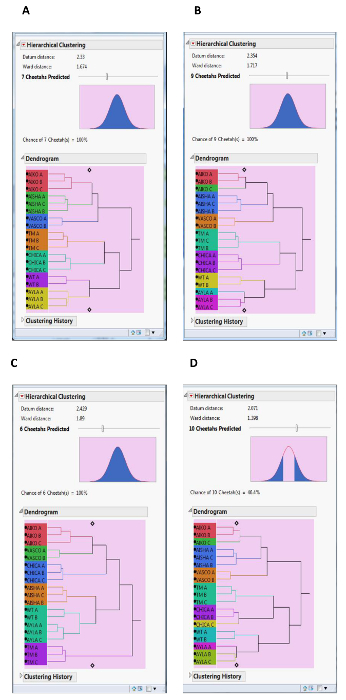
Figure 5. A dendrogram of a sample of trails from seven cheetahs showing the correct prediction when the algorithm is optimized (a) and when the algorithm is suboptimal (b & c). d shows the outcome with 18 variables, with the sliding scale moved in one direction to show that the chance of ten cheetahs is less than 50%. The algorithm is based on three adjustable entities; the number of measurements used, the ellipse size (confidence interval used) and finally, the threshold value that determines the cut-off value for the clusters. Please click here to view a larger version of this figure.

Figure 6. A holdback trial carried out sequentially by varying the proportion of cheetahs in the test and training sets. Rather than apportioning cheetahs to training and test sets arbitrarily, an analysis was performed sequentially increasing the test set size. For each test set, ten iterations were performed with cheetahs being selected randomly for each iteration. For each test set, this allowed a mean value to be calculated. The figure shows the varying test size plotted against itself (red), and on the y-axis the predicted value for each test size iteration (green) and the mean predicted value for each test size (blue). The plot demonstrates that even when the test set size is increased considerably (n=28) compared with the training set size (n=10), the mean predicted value is similar to the expected value. Please click here to view a larger version of this figure.
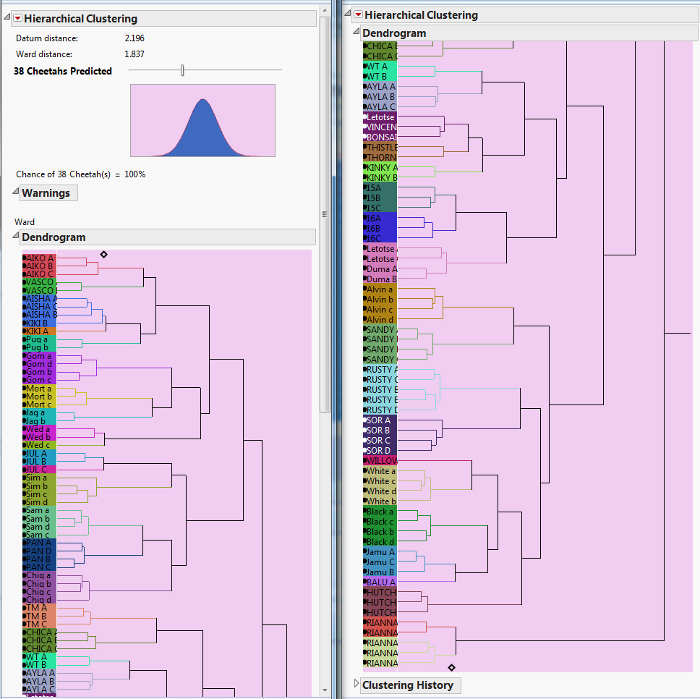
Figure 7. Dendrogram showing the predicted outcome when all 110 trails from 38 cheetahs are included in the analysis. Note the fidelity of the trails forming the clusters. Interestingly, many of the misclassifications were between littermates, e.g., cheetah Letotse /Duma and Vincent/Bonsai. Please click here to view a larger version of this figure.
Discussion
This paper outlines the theoretical application of the footprint identification technique and its potential as a new cost-effective, community-friendly approach to monitoring, and hence helping conserve cheetah. The next steps in the wider application of the tool will be more extensive field-testing with cheetah populations in range areas.
The footprint identification technique differs from previous attempts to identify individuals from footprints in several key respects; a standardized and rigorous footprint collection protocol, a streamlined graphic user interface software, the orientation and optimization of images before analysis, and a new statistical model for classification.
There are several critical steps necessary for the success of the protocol. First, sand trails must be prepared correctly and the animal led over the sand at a normal relaxed walking pace. When imaging the footprints, the photographer must be directly overhead of the center of the print. Often it is useful to have an observer to check this. Lastly, it is very important that the photographer (or an assistant, who might be an expert tracker) be able to identify a cheetah footprint on the ground, and have the skill to track the trail of footprints forwards or backwards along the line of travel.
Tracking skills are essential to the effective further implementation of this technique for monitoring unknown or free-ranging cheetahs. A lack of skill can lead to the collection of insufficiently well-defined footprints or confusion between trails of different animals that might travel together. This latter point is particularly important for cheetahs, where young males sometimes form coalitions of 3 or more animals that move together. However, this concern has been addressed for another social species, the white rhino, where groups of up to 13 individuals moving together were correctly identified by the footprint identification technique using forward or backward tracking of trails (Alibhai et al. 2008)17.
While there are now few remaining expert indigenous trackers, concerted efforts are being made to engage with them and transfer their skills to younger members of their community. One such initiative, the Academy of Ancient Skills, will be hosted by the N/a'an ku sê Foundation in Namibia. Similarly, the rapid growth of tracker training certification programs is enabling scientists and amateur naturalists to learn these essential field techniques.
The accurate manual positioning of landmark points on footprint images is central to the accuracy of the technique. Again, operators must be familiar with the basic anatomy of the foot and resulting footprint. The authors are currently attempting to develop automation to minimize the manual work involved, and help resolve any concerns about standardization across different operators. In the meantime, it is simply recommended that landmark positioning be the responsibility of one operator at each field site. Efforts are underway to engage citizen scientists in data capture and analysis, which will hugely amplify field-application. Despite these current limitations, this software protocol has been successfully deployed in the field for a range of species including Black and White rhino, Lowland tapir and Amur tiger.
Working with footprints has one obvious limitation — the substrate must permit their clear impression. Partial prints or poor quality prints provide insufficient detail32. However, large areas of cheetah range are ideal for footprint collection, and for small otherwise unsuitable areas it may even be possible to circumvent this limitation by placing artificial sand trails to collect footprints. These footprint impression pads can be effectively used in combination with camera-traps, for example at known cheetah marking posts/trees. Tracking skills and local knowledge can greatly assist in locating and identifying areas of suitable substrate.
Because the footprint identification technique is non-invasive, it does not cause any disturbance to the ecology or behavior of the animal. Many studies have shown the potential and real risk of capture, immobilization, handling, and fitting of instrumentation, the cost incurred in such practices, and the risk of collecting unreliable data33. Footprint identification as a technique has another advantage in conservation management. Based on traditional tracking skills, and cost-effectiveness, it can engage previously marginalized local communities in the processes of conservation monitoring. Stander34 and Liebenberg35 independently addressed and attested to the conservation monitoring skills and value of including these groups.
Future developments in the footprint identification technique capability for monitoring cheetah are ongoing, and include field-trials for validation with free-ranging cheetahs, building age-class algorithms (including changes in foot morphology of individuals over time) and substrate controls. The authors are also investigating techniques in computer vision that allow image-segmentation to optimize accuracy and consistency in marking landmark points.
Since footprints are one of the most ubiquitous animal signs, and often much easier to find than the animals themselves, the wider adoption of footprint identification could be game-changing in conservation monitoring. The world's main protected terrestrial areas receive an estimated eight billion recreational visits per annum36. A majority of visitors now carry smartphones. Using an app being developed for WildTrack the collection of footprint data will be simple and quick and could potentially effect a data set of unprecedented sample size and spatial scale. With a cost-effective data collection protocol, the footprint identification technique readily adapts to mesh into any conservation toolbox. As an image classification system, it's robust model may also have application in the medical, forensic, and law-enforcement fields (e.g., anti-poaching).
Disclosures
Publication fees for this video article were paid by the SAS Institute, Inc.
Acknowledgements
The authors would like to acknowledge the support of the N/a'an ku sê Foundation, Namibia; the JMP division (jmp.com) of SAS (sas.com) USA; Chester Zoo, U.K., Cheetah Conservation Botswana, Botswana; and Foundation SPOTS, Netherlands.
Materials
| Name | Company | Catalog Number | Comments |
|---|---|---|---|
| Garden shovel | |||
| Garden rake | |||
| Substrate tamper | |||
| River or builders sand | |||
| Buckets | |||
| Watering can or sprayer | |||
| Digital camera | |||
| Paper for Photo ID slips | http://wildtrack.org/citizen-science/photographing-footprints/ | ||
| Carpenters' cm folding rule | |||
| Laptop or desktop computer | |||
| JMP software | |||
| The footprint identification technique add-in to JMP software |
References
- Durant, S., et al. Acinonyx jubatus. The IUCN Red List of Threatened Species. Version 2015.2. , Available from: http://www.iucnredlist.org/details/219/0 (2015).
- Zanin, M., Palomares, F., Brito, D. What we (don't) know about the effects of habitat loss and fragmentation on felids. Oryx. 49 (1), 96-106 (2015).
- Nowell, K. Namibia cheetah conservation strategy. , Ministry of Environment and Tourism, Government of Namibia. 78 (1996).
- Stein, A. B., Aschenborn, O., Kastern, M., Andreas, A., Thompson, S. Namibia Large Carnivore Atlas. , Ministry of Environment and Tourism, Government of Namibia. 12 (2012).
- Jewell, Z. C., Alibhai, S. K. Identifying Endangered Species from Footprints. , The International Society for Optics and Photonics (SPIE) Newsroom. (2013).
- Johnson, S., et al. Modeling the viability of the free-ranging cheetah population in Namibia: an object-oriented Bayesian network approach. Ecosphere. 4 (7), art 90(2013).
- Purchase, G., Marker, L., Marnewick, K., Klein, R., Williams, S. Regional assessment of the status, distribution and conservation needs of cheetahs in southern Africa. Status and conservation needs of cheetahs in southern Africa. , IUCN/Cat Specialist Group. Gland, Switzerland. 44-46 (2007).
- Lindsey, P. A., et al. Determinants of persistence and tolerance of carnivores on Namibian ranches: Implications for conservation on southern African private lands. PLoS ONE. 8 (1), e52458(2013).
- Mendelsohn, J. Farming systems in Namibia; A publication for the Namibia National Farmers Union (NNFU). , RAISON. Windhoek, Namibia. (2006).
- Marker, L., Dickman, A., Wilkinson, C., Schumann, B., Fabiano, E. The Namibian cheetah: Status report. Cat News. 3, 4-13 (2007).
- Boast, L. K., Good, K., Klein, R. Translocation of problem predators: is it an effective way to mitigate conflict between farmers and cheetahs Acinonyx jubatus. in Botswana? Oryx. (1365-3008), 1-8 (2015).
- Weise, F. J., Stratford, K. J., van Vuuren, R. J. Financial Costs of Large Carnivore Translocations - Accounting for Conservation. PLoS ONE. 9 (8), e105042(2014).
- Marnewick, K., Funston, P. J., Karanth, K. U. Evaluating camera trapping as a method for estimating cheetah abundance in ranching areas. S. Afr. J. Wildl. Res. 38 (1), 59-65 (2008).
- Wachter, B., et al. The use of data from VHF and GPS radio-collared cheetahs to decrease conflicts between cheetahs and farmers in Namibia. Proceedings of the European Telemetry Conference, 26, 556-567 (2006).
- Kelly, M. J. Computer-aided photograph matching in studies using individual identification: an example from Serengeti cheetahs. J. Mammal. 82 (2), 440-449 (2001).
- Jewell, Z. C., Alibhai, S. K., Law, P. R. Censusing and monitoring black rhino (Diceros bicornis.) using an objective spoor (footprint) identification technique. J. Zool. 254 (1), 1-16 (2001).
- Alibhai, S. K., Jewell, Z. C., Law, P. R. A footprint technique to identify white rhino Ceratotherium simum at individual and species levels. Endanger. Species Res. 4, 205-218 (2008).
- Gu, J., Alibhai, S. K., Jewell, Z. C., Jiang, G., Ma, J. Sex determination of Amur tigers (Panthera tigris altaica) from footprints in snow. Wildl. Soc. Bull. 38 (3), 495-502 (2014).
- Jewell, Z. C., Alibhai, S. K., Evans, J. W. Monitoring mountain lion using footprints: A robust new technique. Wild Felid Monitor. 7 (1), 26-27 (2014).
- Panwar, H. S. A note on tiger census technique based on pugmark tracings. Indian For. (Special Issue), 70-77 (1979).
- Sagar, S. R., Singh, L. A. K. Technique to distinguish gender of tiger (Panthera tigris) from pugmarks. Indian For. 117, 24-28 (1993).
- Lewison, R., Fitzhugh, E. L., Galentine, S. P. Validation of a rigorous track classification technique: identifying individual mountain lions. Biol. Conserv. 99 (3), 313-321 (2001).
- Smallwood, K. S., Fitzhugh, E. L. A track count for estimating mountain lion Felis concolor californica population trend. Biol. Conserv. 71 (3), 251-259 (1995).
- Scharis, I., Rasmussen, G. S. A., Laska, M. Using morphometrics to quantitatively differentiate African wild dog footprints from domestic dog footprints - a pilot study. Afr. J. Ecol. 54 (1), 3-8 (2015).
- Gore, A. P., et al. Tiger census: role of quantification. Curr. Sci. 64, 711-714 (1993).
- McDougal, C. You can tell some tigers by their footprints with confidence. Riding the tiger. Seidensticker, J., Christie, S., Jackson, P. , Cambridge University Press. Cambridge, England, United Kingdom. (1999).
- Sharma, S., Jhala, Y., Sawarkar, V. B. Gender discrimination of tigers by using their pugmarks. Wildl. Soc. Bull. 31 (1), 258-264 (2003).
- Sharma, S., Jhala, Y., Sawarkar, V. B. Identification of individual tigers (Panthera tigris) from their pugmarks. J. Zool. 267 (1), 9-18 (2005).
- Sharma, S., Wright, B. Monitoring tigers in Ranthambore using the digital pugmark technique. , Wildlife Protection Society of India. New Delhi, India. (2005).
- Riordan, P. Unsupervised recognition of individual tigers and snow leopards from their footprints. Anim. Conserv. 1 (4), 253-262 (1998).
- Law, P. R., Jewell, Z. C., Alibhai, S. K. Using shape and size to quantify variation in footprints for individual identification: case study with white rhino (Ceratotherium simum). Wildl. Soc. Bull. 37 (2), 4-33 (2013).
- Laity, K. M. Field Validation of the Footprint Identification Technology on Free-roaming Cheetahs in Namibia. , Duke University. (2015).
- Jewell, Z. Effect of monitoring technique on quality of conservation science. Conserv. Biol. 27 (3), 501-508 (2013).
- Stander, P. E., Ghau, I., Tsisaba, D., Oma, I., Vi, I. Tracking and the interpretation of spoor: a scientifically sound method in ecology. J. Zool. 242 (2), 329-341 (1997).
- Liebenberg, L., Blake, E., Steventon, L., Benadie, K., Minye, J. Integrating traditional knowledge with computer science for the conservation of biodiversity. 8th International Conference on Hunting and Gathering Societies Foraging and Post-Foraging Societies: History, Politics, and Future, , 26-30 (1998).
- Balmford, A., et al. Walk on the Wild Side: Estimating the Global Magnitude of Visits to 649 Protected Areas. PLoS Biol. 13 (2), e1002074(2015).
Reprints and Permissions
