Experimental methods for fast pyrolysis of lignocellulosic biomass to produce bio-oils and for the catalytic hydrotreating of bio-oils to produce fuel range hydrocarbons are presented. Hot-vapor filtration during fast pyrolysis to remove fine char particles and inorganic contaminants from bio-oil was also assessed.
Method Article
Biomass Conversion to Produce Hydrocarbon Liquid Fuel Via Hot-vapor Filtered Fast Pyrolysis and Catalytic Hydrotreating
In This Article
Summary
Abstract
Lignocellulosic biomass conversion to produce biofuels has received significant attention because of the quest for a replacement for fossil fuels. Among the various thermochemical and biochemical routes, fast pyrolysis followed by catalytic hydrotreating is considered to be a promising near-term opportunity. This paper reports on experimental methods used 1) at the National Renewable Energy Laboratory (NREL) for fast pyrolysis of lignocellulosic biomass to produce bio-oils in a fluidized-bed reactor and 2) at Pacific Northwest National Laboratory (PNNL) for catalytic hydrotreating of bio-oils in a two-stage, fixed-bed, continuous-flow catalytic reactor. The configurations of the reactor systems, the operating procedures, and the processing and analysis of feedstocks, bio-oils, and biofuels are described in detail in this paper. We also demonstrate hot-vapor filtration during fast pyrolysis to remove fine char particles and inorganic contaminants from bio-oil. Representative results showed successful conversion of biomass feedstocks to fuel-range hydrocarbon biofuels and, specifically, the effect of hot-vapor filtration on bio-oil production and upgrading. The protocols provided in this report could help to generate rigorous and reliable data for biomass pyrolysis and bio-oil hydrotreating research.
Introduction
Our society depends heavily on fossil fuels (e.g., oil, natural gas, coal, etc.). These resources are not sustainable energy sources and are being depleted at a rapidly increasing rate, leading to concerns regarding dwindling fossil-fuel resources, environmental consequences of CO2 emission, and economic problems.1,2,3,4 There is increasing demand for alternative and sustainable energy sources. Biomass is the only renewable and carbon-neutral resource for production of liquid fuels (biofuels) and carbon-based chemicals to replace fossil fuels in the current energy production and conversion system.3,4
Lignocellulosic biomass (e.g., woods, grass, energy crop, agricultural waste, etc.), which is currently the most abundant and least expensive biomass source, has attracted the most attention as a way to produce biofuels via various thermochemical and biological routes.3,4 Three primary routes have been the focus of the recent research: 1) biochemical or chemical conversion to sugars followed by aqueous-phase catalytic and biochemical processing to biofuels; 2) gasification to synthesis gas followed by catalytic conversion to biofuels or alcohols; and 3) pyrolysis or liquefaction to liquid bio-oils followed by catalytic upgrading to biofuels.3,4
The first route can only utilize the cellulose and hemicellulose portion of lignocellulosic biomass. Pyrolysis integrated with upgrading is considered to be a near-term viable technology for the direct production of biofuels.
Pyrolysis is the thermal decomposition of lignocellulosic biomass at temperatures between 400 and 550 °C in the absence of oxygen.4,5,6 A number of reactions, such as depolymerization, dehydration, and C−C bond cleavage, occur during pyrolysis and lead to the formation of a complex mixture of more than 200 oxygenated compounds.4,5,6 Bio-oils in high yields (up to 75 wt% of dry feed) could be produced with up to 70% of the energy stored in the biomass feedstocks retained.4,5 However, direct use of the produced pyrolysis bio-oil as transportation fuels in standard equipment is problematic because of the high oxygen and water content, which lead to different physical and chemical properties such as high viscosity, corrosiveness, poor volatility, low heating value, and poor stability.6,7,8,9 Therefore, extensive oxygen removal is required to upgrade bio-oils to fuel-range hydrocarbons. Catalytic hydrotreating using solid catalysts in hydrogen is the most common route to upgrade bio-oil by oxygen removal through hydrodeoxygenation and hydrogenation reactions.6,7,8,9
Currently, one of the primary challenges for pyrolysis followed by hydrotreating is to achieve long-term steady operation, especially for the hydrotreating process in which the thermal instability of the bio-oil and inorganic and sulfur residues in bio-oil cause significant catalyst deactivation.10,11 The thermal instability of bio-oil has been addressed by low-temperature hydrogenation to stabilize the active species in bio-oil.11,12 Cleanup of bio-oil by removing inorganic residues, which could catalyze repolymerization of bio-oil fractions and deactivate hydrotreating catalysts by deposition, may be valuable. Hot-vapor filtration is one of the techniques to effectively reduce the inorganic content in bio-oil by removing char particulates during pyrolysis.13,14,15 Hot-vapor filtration is used downstream of the pyrolysis reactor to separate char fines from the pyrolysis gas/vapor stream at high temperature before condensation of the vapors.13,14,15
We report here the protocol used at the National Renewable Energy Laboratory (NREL) for biomass fast pyrolysis both with and without hot-vapor filtration to produce bio-oils using a fluidized-bed reactor and at Pacific Northwest National Laboratory (PNNL) for bio-oil hydrotreating to produce biofuels in a continuous-flow packed-bed catalytic reactor. The configurations of the reactor systems, the operating procedures, and the processing and analysis of feedstocks, bio-oils, and biofuels are described in detail. Results of pyrolysis processing of a representative biomass feedstock with or without hot-vapor-filtering and hydrotreating of the produced bio-oil are also presented along with an assessment of the impact of hot-vapor filtration.
Protocol
1. Fast Pyrolysis with Hot Vapor Filtration
- Biomass feedstock preparation
- Mill the biomass to a particle size of <2 mm. Store in a cool, dry place.
- Assemble pyrolysis system
- Assemble pyrolysis reactor.
- Mount reactor inside furnace. Connect fluidizing nitrogen, auger nitrogen, and air lines to reactor. Insert auger into jacketed auger port. Connect cooling air to jacket.
- Mount and connect auger motor.
- Mount solid feeder 30 to 60 cm directly above the vertical opening of the auger port.
- Mount lock hopper between the solid feeder outlet and the vertical opening of the auger port. Connect to the auger port with nylon-braid, reinforced vinyl tubing with an inner diameter of 25 mm. Secure the tubing to the auger port with a hose clamp. Connect to feeder with a light-weight, clear, loose plastic slip-fit.
- Assemble cyclone and hot filter.
- Mount cyclone and connect cyclone inlet to reactor outlet. Close-couple receiver to cyclone.
- Mount hot filter (made of stainless steel with a pore size of 2 μm) in the filter housing. Connect cyclone outlet to hot-filter inlet. Connect nitrogen purge and pressure relief to cyclone outlet.
- Use heat tape and insulating blankets to heat the trace from the cyclone inlet to the condenser inlet.
- Assemble condenser system.
NOTE: Mount the pieces of the condenser system in a fume hood using laboratory-jacks, ring-stands, and laboratory clamps.- For the first condenser, couple 15 to 30 cm of 1.2-cm (outer diameter) stainless steel tubing to borosilicate tubing with a standard taper joint. Connect the first condenser to a 500-ml, two-necked (standard taper), round-bottomed flask (receiver) placed in a container that will serve as an ice bath. Make connections between vessels downstream of this point with 9- to 12-mm clear vinyl tubing secured with hose clamps on ground glass joints, spherical joints, and hose barbs on the glassware.
- Connect the outlet of the first condenser flask to the lower side port (inlet) of the electrostatic precipitator (ESP).
- Connect the upper side port (outlet) of the ESP to the small upper connection of the dry-ice trap (cold-finger condenser).
- Connect a U-tube to line between the ESP and the dry-ice trap. Fill the U-tube half full with water.
- Connect the dry-ice trap to a 500-ml, two-necked, round-bottomed flask (receiver) placed in a container that will serve as a dry-ice bath.
- Connect the outlet of the 500-ml flask to the inlet (center port) of the housing of the coalescing filter.
- Place a container for holding dry ice around the bottom of the filter housing.
- Connect the filter outlet to the dry-test meter and other gas analysis instruments (e.g., non-dispersive infra-red analyzers for CO, CO2, and CH4, thermal conductivity detector for hydrogen, and micro-gas chromatography (micro-GC) for CO, CO2, nitrogen, hydrogen, and C1-C4 hydrocarbons) and then to vent.
NOTE: Schematic of the pyrolysis reactor system is shown in Figure 1. Pictures of the biomass feeder, pyrolyzer, cyclone, hot-vapor filter, and the condensers of the pyrolysis reactor system are shown in Figures S1 to S5 in the supplemental file.
- Assemble pyrolysis reactor.
- Load pyrolysis reactor
- Pour 200 ml of sand (330 g) into the reactor.
- Pour 2 kg of ground biomass into the feed hopper.
- Leak check pyrolysis system
- Cap off system at the condenser inlet.
- Pressurize to 0.05 MPa or expected maximum operating pressure, whichever is higher. Ensure that the flow required to maintain the pressure is <200 ml/min. If not, locate and fix leak, and repeat this step.
- Relieve pressure, uncap system, connect condensation system, cap at exit end of condensation system.
- Pressurize to 0.01 MPa. Ensure that a flow of <200 ml/min maintains the pressure. If not, locate and fix the leak, and repeat this step.
- Depressurize and reconnect the condensation system to instruments.
- Heat up reactor
- Turn on cooling air, set fluidizing nitrogen flow to 3 standard L/min and auger nitrogen flow to 1 standard L/min.
- Set furnace target temperature to 500 °C and other heaters to 400 to 500 °C.
- Ramp temperature up to target temperatures at a rate of 1 to 10 °C/min.
- Prepare to operate
- Increase fluidizing nitrogen flow rate to 14 standard L/min, auger nitrogen flow rate to 1.4 standard L/min, and introduce purge gas at a flow rate of 0.5 standard L/min. Most of the purge goes into the rupture-disk port on the cyclone outlet.
- Fill bath under first condenser with ice. Fill dry-ice trap, container under its receiver, and container around coalescing filter with dry ice.
- Monitor temperature inside of coalescing filter with thermocouple placed on the surface of the filter and adjust dry-ice level so it is 0 °C.
- Perform pyrolysis experiment
- Turn on lock-hopper valves (use 4 second cycle) and auger.
- Turn on ESP. Set voltage to 5 to 10 kV as needed to observe an arc at least once every 2 sec.
- Use micro-GC to verify that no oxygen is present. Verify that turning on the auger and lock hopper did not cause a decrease in output gas flow rate, which would indicate the presence of a leak.
- Turn on feeder at 100 g/hr. Observe the bed temperature and increase the set point as needed to compensate for increased heat load.
- When temperature has recovered to within 2 °C of 500 °C, increase feed rate by 100 g/hr. Repeat this until a feed rate of 420 g/hr is reached.
- Every 15 min, record bed temperature, feed rate on feeder controller, gas concentrations by micro-GC, dry test meter rate, and system pressures by pressure gauges. Verify that ESP is still arcing correctly. Respond to changes in any of these as needed. Refill ice and dry ice. Drain the ESP into a product collection jar as needed.
- Shutdown
- After feeding 1 kg of biomass, stop feeding.
- After gas levels have decayed to less than 10% of steady-state values, turn off all heaters, turn down fluidizing flow to 3 standard L/min and auger flow to 1 standard L/min. Turn off ESP, lockhopper valves, and auger.
- Allow system to cool (4 to 6 hr) before opening the hot sections.
- Collect liquid products and char.
- Weigh all parts of the condenser system to obtain total liquid yield. Pour liquids from the condenser receivers into a common jar or bottle. Alternatively, use acetone to clean the glassware.
- Empty char receiver into a jar. Remove hot filter, empty the housing, and brush off the filter into the char jar. Weigh the filter. Remove and weigh the bed material. Use a HEPA vacuum with a knock-out vessel for this service.
- Oxidize the system.
- Seal the reactor, cyclone receiver, and cleaned hot filter. Check for leaks as described above in Section 1.4.
- Install a metal line from the condenser inlet to the outlet of the coalescing filter to bypass the condensation system.
- Heat the reactor to 550 °C with 3 standard L/min nitrogen as the fluidizing gas and 1 standard L/min auger nitrogen flow.
- Add air to the fluidizing gas. Start at 0.2 standard L/min and gradually increase to 4 L/min. Continue until CO + CO2 concentrations are less than 0.1%.
- Calculate yields.
- Calculate liquid yield as the total change in mass of the condensation system.
- Calculate char yield as the sum of the weight change in the bed, the weight change of the hot filter, and the char collected from the cyclone receiver and hot-filter housing.
NOTE: Additional char could be estimated from the oxidation of the system, but this is usually unimportant. - Calculate gas yield as the total weight of gaseous products from the gas concentrations measured on the GC and the flow rate of the dry test meter.
2. Catalytic Hydrotreating of Bio-oil
Note: The bio-oil samples produced at NREL were shipped to PNNL for catalytic hydrotreating on a hydrotreater system.
- Hydrotreater system
- Ensure that the hydrotreater system is in operational condition by checking each component.
NOTE: The hydrotreater reactor system used is configured as a single-pass, co-current, continuous, down-flow catalytic reactor. The system consists of three major components: 1) a gas and liquid feeding component, 2) a heated reactor, and 3) a gas−liquid product separation component (Figure 2). The system is designed to operate at up to 13.6 MPa (2,000 psig; maximum operating pressure) with a maximum catalyst temperature 500 °C (only the reactor is rated at this temperature). - Ensure that the hydrotreater monitoring and controlling system and the safety control system are in operational condition.
NOTE: The system is monitored and partially controlled by an in-house built computer program with various sensors. Sensors include thermocouples and pressure transducers for the reactor as well as hydrogen and ventilation sensors in the enclosure where the reactor is located. Data are recorded by the program to monitor the reactor. The outlet gas flow rate is measured by a flow meter, and data are recorded by its accompanying software. The program also controls the power supply of major equipment of the reactor. During an experiment, if the reactor undergoes an unwanted change in operating conditions in terms of specific pressure changes and/or temperature changes, or a combustible gas is present above the safety limit, and/or if the ventilation system fails, the program could automatically shut down the system to ensure safety. Pressure relief valves and a rupture disc also are installed in the hydrotreater system to protect against over-pressurization.
- Ensure that the hydrotreater system is in operational condition by checking each component.
- Catalyst loading and pretreatment
- Catalyst preparation
- Crush both catalysts, Ru/C, as the stage-I catalyst and CoMo/Al2O3 as the stage-II catalyst, and sieve to retain 0.25 to 0.60 mm (30 to 60 mesh) grains.
NOTE: Ru/C catalyst was prepared in-house and CoMo/Al2O3 catalyst was a commercial product.
- Crush both catalysts, Ru/C, as the stage-I catalyst and CoMo/Al2O3 as the stage-II catalyst, and sieve to retain 0.25 to 0.60 mm (30 to 60 mesh) grains.
- Catalyst loading into the reactor
- Use stainless steel tubes and screens as the support media for the catalyst beds. Slowly pour the stage-II catalyst grains, the stage-I catalyst grains, and the original stage-I catalyst extrudates, which were used as distributor, into the reactor sequentially while "tapping" on the outside of the reactor to form packed catalyst beds. Load 32 ml of each catalyst to form a two-stage catalyst bed with 24 ml of each catalyst located in the isothermal zone (Figure 3).
- Install the reactor to the hydrotreater system
- Place the reactor into the hydrotreater system by installing the two heaters and then connecting the reactor to the gas and liquid feed component and the gas−liquid separation component.
NOTE: Two heat tape-heated aluminum sheaths enclose the tubular reactor to provide heat. Each heated sheath is used independently to heat the portion of reactor during catalyst pretreatment and during hydrotreatment testing. Each aluminum sheath is wrapped with a high temperature heat tape and insulation and heated using a temperature controller. The tubular fixed-bed catalytic reactor is made of 316 stainless steel and with an inner diameter of 13 mm and a length of 64 cm. A thermocouple well (4.7 mm outside diameter) is located in the center of the reactor, and two thermocouples are placed in the well to measure the temperature of the catalyst beds.
- Place the reactor into the hydrotreater system by installing the two heaters and then connecting the reactor to the gas and liquid feed component and the gas−liquid separation component.
- Check the pressure of the hydrotreater system for leaks using 12.0 MPa nitrogen gas by keeping the system at the pressure and ensuring that the drop of pressure is lower than 1 psig per hour.
- Catalyst pretreatment. Sulfide the catalysts in situ in hydrogen and sulfiding agent flow.
- Heat both catalyst beds from room temperature to 150 °C at a rate of 120 °C/hr in hydrogen at 242 ml/min.
- Maintain both catalyst-bed temperatures at 150 °C for 2 hr in hydrogen at 242 ml/hr and sulfiding agent at 0.128 ml/min (35 wt% di-tert-butyldisulfide in decane fed by a feeding pump).
- Heat the stage-I bed from 150 to 250 °C at a rate of 83.3 °C/hr, and maintain at 250 °C for 5.8 hr. During the same period, heat the stage-II bed from 150 to 400 °C at a rate of 83.3 °C/hr, and maintain at 400 °C for 4 hr. During the procedure, keep the pressure of the reactor at 10.3 MPa, the sulfiding agent flow rate at 0.128 ml/min, and the hydrogen flow rate at 242 ml/min.
- Stop the sulfiding agent flow and maintain hydrogen flow. Then set the temperature of each catalyst bed to the desired reaction temperature.
NOTE: The sulfiding agent flow rate is determined by the amount of catalyst used and the sulfiding agent liquid hourly space velocity (LHSV) of 0.12 ml/ml-cat/hr for overall catalysts. The hydrogen flow rate is determined by the sulfiding agent flow rate and the hydrogen-to-sulfiding agent flow ratio at 1,890 ml hydrogen/ml sulfiding agent liquid. The gas and liquid feeding components of the hydrotreater system consist of two high-pressure syringe pumps. One of the two pumps is used to feed the sulfiding agent. The gas and sulfiding agent is introduced to the pre-reactor zone of the reactor where the liquid is mixed before they pass downward through the catalyst bed in the reactor.
- Catalyst preparation
- Bio-oil hydrotreating
- Adjust the hydrogen flow to 152 ml/min and maintain the system pressure at 10.3 MPa. Set the temperatures of the stage-I catalyst bed and the stage-II catalyst bed to 220 and 400 °C, respectively.
NOTE: The hydrogen flow rate is determined by the amount of catalyst used, the bio-oil LHSV of 0.20 ml/ml-cat/hr for each stage, and the hydrogen-to-bio-oil ratio of 1,900 ml hydrogen/ml bio-oil. - Record the bed temperature and hydrogen flow baselines when the temperature, pressure, and hydrogen flow become stable.
- Add di-tert-butyl disulfide to bio-oil feed at an amount equal to 150 ppm sulfur in bio-oil. Fill the bio-oil feed in one of the feeding pumps and purge the feeding line until a liquid flow that is free of air bubbles is achieved.
- Pressurize the pump to 10.3 MPa, and then connect to the reactor by opening the connecting valves. Start feeding the bio-oil at a flow rate of 4.8 ml/hr. This action starts the bio-oil hydrotreating test.
NOTE: Bio-oil flowrate is determined by the amount of catalyst used and the bio-oil LHSV of 0.20 ml/ml-cat/hr for each stage. The hydrogen gas and bio-oil are introduced to the pre-reactor zone of the reactor where the gas and liquid are mixed before they pass downward in an assumed trickle flow through the catalyst bed in the reactor. - Check the status of the reactor and record the parameters, such as temperature, pressure, flow rate, and volume, periodically. Ensure the catalyst-bed temperatures are within ±2 °C of the desired temperature, the gas and liquid flow rates are exactly the same as the desired settings, and reactor pressure is within ±0.15 MPa of the desired pressure. Ensure the pressure drop across the catalyst bed is <0.35 MPa.
NOTE: The system is monitored and partially controlled by an in-house built computer program with various sensors. Sensors include thermocouples and pressure transducers for the reactor as well as hydrogen and ventilation sensors in the enclosure where the reactor is located. - Analyze outlet gas samples every 2 hr by directing the off-gas through an on-line micro-GC.
NOTE: The micro-GC is an a four-channel micro-GC and calibrated using a calibration gas before each hydrotreating test. - Collect liquid samples every 6 hours using the following procedure: switch the sampling trap to the bypass trap, reduce the pressure of the sampling trap, drain the liquid sample to collecting vials, purge the sampling trap with nitrogen, pressurize the sampling trap with nitrogen, and redirect product flow to the sampling trap. Operate a series of two- and three-way valves that divert the gases and products in the desired directions.
NOTE: Once the reactants pass through the catalyst beds, the liquid products and unreacted liquids are separated from the gaseous products and unreacted gases in the gas-liquid separation system. The hot gases pass through one of two pressurized, chilled, liquid/gas cold traps (sample trap or bypass trap) placed in parallel downstream of the reactor system. The off-gas then passes through the back-pressure regulator where the pressure is reduced to atmospheric pressure. The off-gas is then passed through a gas meter to measure the flowrate. - Conduct the test for 60 hr on stream (time on stream [TOS]). Terminate the test by stopping the bio-oil feed. Set the reactor temperature to 100 °C and hydrogen flow rate to 100 ml/min.
NOTE: The test could be operated for TOSs ranging from fifty to several hundred hours.
- Adjust the hydrogen flow to 152 ml/min and maintain the system pressure at 10.3 MPa. Set the temperatures of the stage-I catalyst bed and the stage-II catalyst bed to 220 and 400 °C, respectively.
- Post-test procedure
- Use acetone to clean the feeding pump for feeding bio-oil. Load the cleaned feeding pump with acetone.
- Purge the catalyst bed with ∼400 ml acetone at an acetone flow rate of 10 to 40 ml/min and a hydrogen flow rate of 100 ml/min when the catalyst-bed temperatures are at 100 °C.
- Shut off the heaters of the reactor, depressurize the system to ambient pressure, and purge the reactor with nitrogen for at least 24 hr.
- Remove the reactor from the system and remove the spent catalysts from the reactor.
- Product processing and result analysis
- For liquid product processing, separate the two phases and weigh individually. The liquid products are normally in two phases, a light oil phase (oil product) and a heavy aqueous phase (aqueous product).
- Conduct the following analyses of the oil product: density measurement; Karl Fischer titration for water content; elemental analysis (D5291/D5373, D5373mod, and D1552/D4239) for carbon, hydrogen, nitrogen, oxygen, and sulfur; semi-micro color indicator titration (D3339) for total acid number; inductively coupled plasma-optical emission spectroscopy for inorganic content; and simulated distillation (ASTM D2887) to assess the relative amounts of fuel products in the gasoline, diesel, jet fuel, and residual ranges. Conduct the following analyses of the aqueous products: Karl Fischer titration for water content and elemental analysis (D5291/D5373) for carbon, hydrogen, and nitrogen content15.
- Calculate the yields of produced oil product, aqueous product, and gaseous product; the hydrogen consumption; and the mass balance based on the inlet reactant flow rate and density, inlet hydrogen flowrate, outlet oil product weight, water content of the outlet oil product, outlet aqueous product weight, outlet gas flow rate, and outlet gas composition.
- Analyze spent catalysts by inductively coupled plasma-optical emission spectroscopy15.
Results
The fast pyrolysis of a representative herbaceous biomass, switchgrass, with or without hot-vapor filtration and the catalytic hydrotreating of the product bio-oil are used as an example for the process reported here. More details of these experiments can be found in detail in our recent publication.15
Hot-vapor-filtered fast pyrolysis
Table 1 shows bio-oil, char, and gas yields produced with and without the hot-vapor filter for a typical herbaceous feedstock. For the control experiment without hot-vapor filtration, the vapors passed though the filter housing but the filter was not installed. This kept the residence time in the two experiments the same so any difference is due to the filter only. The bio-oil yields were 52% to 56%, indicating successful conversion of the major portion of the biomass to liquid intermediate oils. A photo of a representative bio-oil sample is shown in Figure 4. The mass balance closures were 86% to 90%. Light vapors that were not properly collected in the condensation train were one source of mass loss. Pyrolysis oils contain several low-boiling-point compounds, such as hydroxyacetaldehyde (boiling point 20.2 °C), that are difficult to condense. Adding a second dry-ice trap will improve the recovery of the light condensable compounds. Performing experiments with higher biomass feed rates than reported here will improve recovery of the light vapors by increasing the vapor concentration prior to condensation. The escape of light condensable compounds can be verified by gas chromatography-mass spectroscopy analysis of the exit gas. The mass balances were relatively low for the herbaceous feedstock, likely because of escaping light char, which was produced from the switchgrass in relatively large quantities. Cracking reactions occur at the filter so inclusion of the hot-vapor filter reduced the oil yields and increased the gas yields.
Table 2 and Figures 5 and 6 show the analysis results of herbaceous feedstock and the bio-oils produced. Hot-vapor filtering reduced the ash residue in the bio-oil from 1.45% to below the detection limit. Various inorganics, such as aluminum, calcium, iron, potassium, magnesium, sodium, phosphorous, and silicon, were observed in the bio-oils, and they mainly originate from the biomass feedstock. Hot-vapor filtering significantly decreased the inorganic contents in the bio-oil, indicating that hot-vapor filtering was a powerful protocol for effectively reducing the trace element content in the bio-oils by removing char and ash particulates. Hot-vapor filtering also decreased the carbon content and increased the oxygen content in the bio-oils. Woody feedstocks have low ash contents compared to herbaceous feedstocks, and lower reductions in the bio-oil ash and inorganic contents are observed.15
Catalytic hydrotreating of bio-oil
The analytical results of the produced bio-oil were consistent with the fact that bio-oils produced from such process are not of sufficient quality for direct use in internal combustion engines. Therefore, upgrading of bio-oil is required. The two bio-oil samples were upgraded by catalytic hydrotreating in the hydrotreater system under the conditions discussed above.
Bio-oils are known to plug the hydrotreating reactors as chars or polymerization products of active species in bio-oils accumulate in the catalyst bed. Therefore, the pressure drop across the catalyst beds during the hydrotreating tests is an important indicator of accumulating chars or polymerization products. The hot-vapor filtered bio-oil performed nearly flawlessly for 60 hours TOS in the hydrotreating test. However, the non-filtered bio-oil had ∼5 wt% undissolved solids, which separated out in the pump and were not treated. Even with these untreated solids, there was still a pressure drop buildup after 50 hours TOS, probably because of the residual solids in the non-filtered bio-oil plugging the packed catalyst bed.
Tables 3 and 4 and Figures 5 and 7 list the yield of the products for bio-oil hydrotreating at different TOSs. Phase-separated liquid products, including an upgraded oil phase and an aqueous phase, and gaseous products, including CH4, C2H6, C3H8, C4H10, CO, and CO2, were produced. Figure 4 shows a photo of a reparative upgraded oil sample. Table 5 shows the analysis results of upgraded oil and Figure 5 compares the elemental analysis results of the bio-oil and the upgraded oil. Hydrotreating was very effective at reducing oxygen, sulfur, and nitrogen and adding hydrogen significantly from the bio-oil feed. The oxygen content in the upgraded oil was ∼2.0 wt%, which was significantly lower than 35 to 40 wt% of oxygen in the bio-oil feed. The hydrogen-to-carbon ratio of the upgraded oil was ∼1.7, compared to ∼1.3 for the bio-oil feed. The trend of density of the upgraded oil, which increased from 0.81 to 0.83 g/ml over the period of the test, suggests a mild catalyst deactivation over the 60 hour TOS.
As shown in Figure 7, comparisons of hydrotreated products between the hot-vapor filtered and non-filtered bio-oil showed that hot-vapor filtered bio-oil led to a slightly higher water-to-upgraded oil ratio, which is consistent with the higher oxygen content in the hot-vapor-filtered bio-oil feed. The properties of upgraded oil for the two bio-oils were very similar. The major difference between the hydrotreating of hot-vapor-filtered and non-filtered bio-oil was that the used catalyst beds of hot-vapor-filtered bio-oil showed much less deposition of inorganics compared to the catalyst beds used with non-filtered bio-oils.

Figure 1. Schematic for the 5-cm fluidized-bed pyrolysis reactor system. There is a hot-vapor filter, a condensation system, and a gas-measurement system. Please click here to view a larger version of this figure.

Figure 2. Schematic of the mini-reactor hydrotreater system. (MFC: mass flow controller; RD: rupture disc; PT: pressure transducer; PI: pressure indicator (gauge); BPR: back-pressure regulator; PR: pressure regulator) Please click here to view a larger version of this figure.

Figure 3. Schematic of the catalyst bed in the mini-hydrotreater reactor. The temperature profile of the catalyst bed is shown in the left and the position of catalysts of each stage is shown in the right. Please click here to view a larger version of this figure.
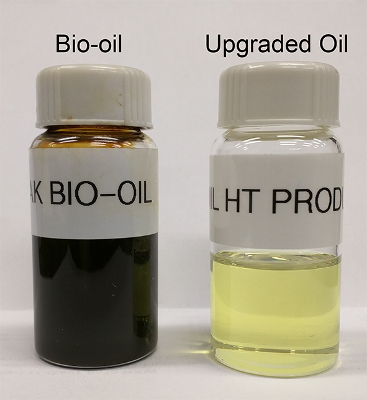
Figure 4. Photos of a representative bio-oil samples (left) and a representative upgraded oil sample (right). Please click here to view a larger version of this figure.

Figure 5. Comparison of elemental analysis results of the herbaceous feedstock (switchgrass), the bio-oil produced with hot-vapor filtration, and the upgraded oil. Carbon, hydrogen, and oxygen content did not change much after fast pyrolysis of biomass, however, oxygen content decreased significantly and hydrogen content increased after bio-oil hydrotreating. Please click here to view a larger version of this figure.

Figure 6. Comparison of oil yield, carbon efficiency, and some properties of bio-oil from hot-vapor filtered and non-filtered pyrolysis. This demonstrates the impact of hot gas filtration of pyrolysis vapors prior to condensation. Hot gas filtration eliminates inorganic residues but it also affects pyrolysis oil yield [3-LM] and oil properties such as oil oxygen content. Please click here to view a larger version of this figure.

Figure 7. Comparison of hydrotreating results of bio-oils from hot-vapor filtered and non-filtered pyrolysis. Hot-vapor filtered bio-oil leads to a slightly higher water-to-fuel ratio and the properties of upgraded fuel for the two bio-oils are very similar. The major difference between hydrotreating of the two pyrolysis oils is that the catalyst bed of hot-vapor-filtered bio-oil showed much less deposition of minerals. Please click here to view a larger version of this figure.

Table 1. Yields of major pyrolysis products (bio-oil, char, and gas) and mass balance closures for pyrolysis of an herbaceous feedstock (switchgrass) with and without hot-vapor filtration.

Table 2. Analysis of the representative herbaceous feedstock (switchgrass) and bio-oil produced with and without hot-vapor filtration.
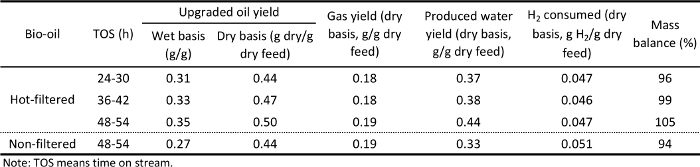
Table 3. Yield of major hydrotreating products at the different TOSs for hot-vapor filtered and non-filtered representative bio-oil.

Table 4. Produced gas composition during the hydrotreating of representative bio-oils.

Table 5. Analysis of the upgraded oil products from the hydrotreating of representative bio-oils.
Discussion
In this paper, we described a detailed procedure for converting lignocellulosic biomass to fuel-range hydrocarbons via fast pyrolysis and catalytic hydrotreating. The NREL pyrolysis reactor system with a 5-cm inner diameter fluidized-bed reactor and the PNNL hydrotreater system with a 1.3-cm inner diameter fixed-bed catalytic reactor and their operation procedures are described in detail. These reactor systems could be used to conduct pyrolysis and hydrotreating tests in an efficient and safe manner. We used representative herbaceous feedstocks to produce liquid bio-oils in the pyrolysis reactor system, and then, the bio-oils were processed in the hydrotreating system with a two-stage catalyst bed including sulfided Ru/C and CoMo/Al2O3 as catalysts to produce fuel-range liquid hydrocarbons. The process also is applicable to pyrolysis of a wide range of biomass feedstocks including wood, grass, and corn stover and then upgrading the produced bio-oil to produce biofuels.16 The hydrotreater and hydrotreating process also could be used for upgrading other biomass-generated intermediates such as liquefaction oil (bio-crude) from biomass such as wood and algae.
Maximizing bio-oil yield during pyrolysis requires heating the biomass rapidly to sufficient temperature to achieve maximum volatilization of the biomass. For most biomass, this means temperatures of 500 to 600 °C. A fluidized bed provides rapid heat transfer from the sand to the biomass, providing a high heating rate. The use of small particles also provides a higher heating rate. Typically a few percent higher bio-oil yield is achieved with biomass ground to <0.5 mm than with biomass ground to <2 mm. Maximizing yield also means minimizing thermal cracking of the vapors by keeping the residence time at temperature low (1 to 2 seconds). Pyrolysis vapors contain compounds with a wide range of boiling points. Thus, the hot piping tends to become fouled with liquid, repolymerized vapors and char. To avoid this condition, keep the auger temperature below 100 °C and all surfaces between the reactor and condensation train above 400 °C to avoid fouling, but below 500 °C to minimize thermal cracking. Thorough coverage with heat tape is necessary to prevent cold spots and provide a uniform temperature. Sewn insulation pads with closures on them generally provide more uniform coverage, thereby resulting in more uniform temperature. It is important that the temperature drops rapidly in the first condenser to minimize the opportunity for repolymerization of high-boiling-point materials, which could lead to blockage of the condenser inlet. It also is necessary to use dry ice in the second condenser to maximize liquid recovery and prevent damage to gas-measurement and analysis instruments.
Some enhanced features were not mentioned in the basic fast pyrolysis procedure. It is useful to have a pressure gauge or transmitter near the reactor inlet. In addition, it is useful to measure differential pressure across the reactor and cyclone and to measure the final pressure and temperature at the dry test meter (to enable accurate volume calculations). It also is helpful to have additional thermocouples in the pyrolysis bed to verify that the bed is fluidizing uniformly enough to provide uniform temperatures. Typically, <5 °C spread is seen vertically through the bed. It also is useful to have nested-loop temperature control on the reactor. When a larger amount of oil is needed, it is helpful to install a valve on the bottom of the char receiver and mount a secondary char receiver below that, which in turn has a valve at the bottom with a jar loosely mounted to it. This makes it possible to empty the char receiver into the secondary receiver and finally down into the jar so that continuous operation can be maintained for many hours. Vibration is helpful to the operation. Manual pounding of the pipes can be used, but an automatic vibrator provides more reliable agitation. These can be operated continuously on the lock hopper and auger port to maintain a smooth feed flow through the feeder. Also, using an automatic vibrator on the secondary char receiver during char draining makes that operation much more reliable. Hot-vapor filtration enhances cracking and reduces bio-oil yield as shown above. Keeping the temperature of the filter low but still above condensation temperature (>400°C) minimizes cracking. An inert surface on the filter also may reduce cracking. The filter area needs to be large to reduce pressure drop.
The major limitation of the fast pyrolysis process is that the produced bio-oil has some major problematic properties such as high viscosity, corrosiveness, poor volatility, low heating value, and chemical instability, which limits their direct utilization and causes some issues during their upgrading. 6,7,8,9 A variant of fast pyrolysis, catalytic fast pyrolysis, wherein fast pyrolysis is integrated with a catalysis process to upgrade the pyrolysis vapor, and hydropyrolysis, wherein fast pyrolysis conducted in the presence of reactive gases such as H2, can lead to a higher quality bio-oil but suffer higher operational complexity and low product yield.4,8
Two-stage catalytic hydrotreating showed good processing results for converting bio-oil to fuel-range hydrocarbons. Bio-oils are known to be chemically unstable because of the presence of active species such as carbonyl and phenolic compounds that could undergo repolymerization and condensation at a low temperature, leading to a high propensity for forming carbonaceous materials and consequent catalyst deactivation and even plugging of catalyst bed. Therefore, the first stage hydrogenation step was critical for the process, and was used to stabilize bio-oil by hydrogenation of carbonyls and phenolics at a relative low temperature by using a proper hydrogenation catalyst. The performance of the hydrogenation catalyst was the key of the long-term stability and operability of the process. Oxygen removal by hydrodeoxygenation occurred at the second stage by a sulfide-based hydrotreating catalyst. The yield and properties of produced final oil product depended on the catalysts and conditions used in the second stage. Maximizing the yield of liquid final fuels could be achieved by using catalysts capable of generating C-C bonds, such as alkylation function, and optimized reaction parameters including reaction temperature, pressure, and space velocity. The major limitation of the hydrotreating process is that, because of some problematic properties in bio-oil such as chemical instability and the presence of contaminants17, the lifetime of hydrotreating catalysts, especially the first step hydrogenation catalysts, are still limited, which makes the overall process costly. Maximizing the lifetime of the catalysts used could be achieved by using more robust catalysts; optimized reaction parameters including reaction temperature, pressure, and space velocity; or pretreatment to lower the content of the active species or contaminants in bio-oil feeds.
The hydrotreater was operated at high pressures and reactor temperatures with flammable gases and liquids involved. Therefore, safety rules and procedure should be strictly followed.
Disclosures
The authors declare that they have no competing financial interests.
Acknowledgements
This work was supported by the U.S. Department of Energy (DOE) under Contract DE-AC36-08-GO28308 at NREL and Contract DE-AC05-76RL01830 at PNNL. The authors gratefully acknowledge the support of the DOE's Bioenergy Technologies Office.
Materials
| Name | Company | Catalog Number | Comments |
|---|---|---|---|
| Pyrolysis system | |||
| Feedstock | Mill to pass 2 mm screen | ||
| Sand for bed material | Black Rock | Screen to 300-500 microns | |
| Furnace | Thermcraft | TSP-3.75-0-24-3C-J13667/1A | Split tube furnace 3.75 ID X 24 L |
| Pyrolysis reactor | Custom-built at NREL | 2" diameter, height 17", dual staggered plate distributor, 316SS, Auger port is 2.5 cm above distributor and is cooled with air or water, there is a coiled 1/4" 304 SS tube below the distributor to pre-heat the gas | |
| Cyclone | Custom-built at NREL | 1" diameter | |
| Cyclone receiver | Custom-built at NREL | 1 L capacity | |
| Cyclone secondary receiver | Custom-built at NREL | 1 L capacity | |
| Hot vapor filter | Serv-A-Pure | SC2-0P10B34-X | 316SS, 10 inches long, 2.0 micron |
| 2-neck round-bottomed flasks | 500 ml | ||
| Electrostatic precipitator | Allen Scientific Glassware, NREL-built electrodes | Custom built | 2" diameter 10" long ground electrode, glass enclosed, stop-cock on bottom |
| High-voltage power supply | Spellman High Voltage | Bertan 803C-300P | 30 kV max, 0.5 mA |
| Cold-finger condenser | Aldrich | Z164038 | |
| Coalescing filter | Finite | 10C15-060 | |
| Dry test meter | American Meter | DTM-200A | with IMAC counter |
| Gas chromatograph | Varian | CP-4900 | MS5A, PBQ, CP-Sil columns |
| Hydrogen detector | Gerhard Wagner | TCM-4 | thermal conductivity detector |
| Non-Dispersive Infrared Spectrometer | California Analytical | Model 300 | Carbon monoxide 0-5%, 0-25%, carbon dioxide 0-5%, 0-20%, methane 0-5,000 ppmv, 0-3% |
| Mass flow controller | Celerity (now Tylan) | Unit 7301 | 0-20 SLM reactor bottom, 0-10 SLM auger, 0-2 slm purges, 0-5 slm air |
| Auger | Auger Manufacturing Specialists | 110520 | 3/8" Dia SS RH Auger 18" |
| Motor for Auger | Leeson | Gearmotor-Parallel Shaft, 94 rpm, 1/15 HP, TEFC, 115 VAC | |
| Feeding system: Motor for hopper | Lenze | VDE0530 | 7KB4-7-100H Motor Ac Helical Gearbox 3PH 0.25 kW 1.4/0.82 A |
| Feeding system: Hopper and Loss in weight feeder | K-TRON Soder | KCL24T20 | with K10S controller |
| Feeding system: Valves | Swagelok | SS-65TS16 | 151 bar at 37 °C and 6.8 bar at 232 °C |
| Control system | Opto22 | SNAP-PAC parts | |
| Heat cables | McMaster-Carr | 4550T152 and similar | Extreme-Temperature (1,400 °F), heavy insulation for use on metal |
| Ball Vibrator | Vibtec | K 8 | |
| U-tube | Custom-built at NREL | 1/4" PFA and stainless steel tubing, 1.4 m tall | |
| Hydrotreating system | |||
| Ru on carbon catalyst | Fabricated at PNNL | 7.6 wt% Ru on carbon | |
| 3% Co and 9% Mo on Al2O3 catalyst | Alfa-Aesar | 45579 | Cobalt oxide, typically 3.4-4.5%, Molybdenum oxide typically 11.5-14.5% on alumina |
| Feeding pumps | ISCO | 500D | Syringe pump, 500 ml cylinder capacity |
| Mass flow controller | Brooks | SLA5850S1BAF4B1A1 | |
| Temperatrue controller | Cole-Parmer | WU-89000-10 | Digi-Sense Advanced Temperature Controller, 115 V |
| Thermocouples | Omega | K-type thermocouples | |
| Pressure transducer | Omega | PX309-3KG5V | |
| Heat tapes | Cole-Parmer | EW-03106-27 | Dual element heating tape, 1/2 in x 12 ft, 936 watts, 120 VAC w/ 2-prong plug |
| Digital pressure gauge | Omega | DPG4000-3K | High Accuracy Digital Pressure Gauge, with Data Logging Capability |
| Back pressure regulator | Mity-Mite | ||
| Gas flow meter | Mesa Labs | 200-220L | Dry Cal, Definer 220 Low Flow |
| Hydrotreating reactor, cross, tee, fittings | Parker, Autoclave | ||
| Combustible gas sensor | SMC | 5100-02-IT-S1-01-00-0-0 | Combustible gas detection sensor, 24 VDC power, analog 4-20 MADC output with modbus, no relays |
| H2S sensor | SMC | 5100-05-IT-S1-01-00-0-0 | H2S toxic gas sensor module, 24 VDC power, analog 4-20 MADC output with modbus, no relays |
| Ventilation sensor | TSI | FHM10 | Fume Hood Monitor FHM10 |
| Micro-Gas chromatograph | Inficon | Inficon 3000 | Four-channel micro-GC with molecular sieve, Plot U, Alumina, and Stabilwax columns |
| Lab-view based monitering and controlling system | Custom-built at PNNL | Using National Instruments parts and Labview software |
References
- BP. Statistical Review of World Energy. , http://www.bp.com/content/dam/bp/pdf/Energy-economics/statistical-review-2014/BP-statistical-review-of-world-energy-2014-full-report.pdf. (2014).
- U.S. Energy Information Administration. International Energy Outlook 2014. , http://www.eia.gov/forecasts/ieo/pdf/0484%282014%29.pdf (2014).
- Bioenergy Technologies Office. Replacing the Whole Barrel. , http://www1.eere.energy.gov/bioenergy/pdfs/replacing_barrel_overview.pdf. (2013).
- Huber, G. W., Iborra, S., Corma, A. Synthesis of transportation fuels from biomass: Chemistry, catalysts, and engineering. Chem. Rev. 106 (9), 4044-4098 (2006).
- Mohan, D., Pittman, C. U. J., Steele, P. H. Pyrolysis of wood/biomass for bio-oil: A critical review. Energy Fuels. 20 (3), 848-889 (2006).
- Bridgewater, A. V. Review of fast pyrolysis of biomass and product upgrading. Biomass Bioenergy. 29, 68-94 (2012).
- Elliott, D. C. Historical developments in hydroprocessing bio-oils. Energy Fuels. 21 (3), 1792-1815 (2007).
- Wang, H., Male, J., Wang, Y. Recent advances in hydrotreating of pyrolysis bio-oil and its oxygen-containing model compounds. ACS Catal. 3 (5), 1047-1070 (2013).
- Zacher, A. H., Olarte, M. V., Santosa, D. M., Elliott, D. C., Jones, S. B. A review and perspective of recent bio-oil hydrotreating research. Green Chem. 16, 491-515 (2014).
- Elliott, D. C., et al. Catalytic Hydroprocessing of Fast pyrolysis bio-oil from pine sawdust. Energy Fuels. 26 (6), 3891-3896 (2012).
- Venderbosch, R. H., Ardiyanti, A. R., Wildschut, J., Oasmaa, A., Heeresb, H. J. J. Stabilization of biomass-derived pyrolysis oils. Chem. Technol. Biotechnol. 85 (5), 674-686 (2010).
- Olarte, M. V., et al. Towards long-term fast pyrolysis oil catalytic upgrading. Prepr. Pap. Am. Chem. Soc., Div. Fuel Chem. 58 (2), 230-231 (2013).
- Scahill, J., Diebold, J. P., Feik, C. Removal of residual char fines from pyrolysis vapors by hot gas filtration. Developments in Thermochemical Biomass. Bridgwater, A. V., Boocock, D. G. B. , Blackie Academic and Professional. London, U.K. (1996).
- Hoekstra, E., Hogendoorn, K. J. A., Wang, X., Westerhof, R. J. M., Kersten, S. R. A., van Swaaij, W. P. M. Fast pyrolysis of biomass in a fluidized bed reactor: In situ filtering of the vapors. Ind. Eng. Chem. Res. 48 (10), 4744-4756 (2009).
- Elliott, D. C., Wang, H., French, R., Deutch, S., Iisa, K. Hydrocarbon liquid production from biomass via hot-vapor-filtered fast pyrolysis and catalytic hydroprocessing of the bio-oil. Energy Fuels. 28 (9), 5909-5917 (2014).
- Howe, D., et al. Field-to-Fuel Performance Testing of Lignocellulosic Feedstocks: An Integrated Study of the Fast Pyrolysis/Hydrotreating Pathway. Energy Fuels. 29 (5), 3188-3197 (2015).
- Wang, H., Wang, Y. Characterization of Deactivated Bio-oil Hydrotreating Catalysts. Topics in Catalysis. 59, 65-72 (2015).
Reprints and Permissions
