Here we present a protocol to estimate material and surface optical properties using the photoacoustic effect combined with total internal reflection. This technique evanescent field-based photoacoustics can be used to create a photoacoustic metrology system to estimate materials' thicknesses, bulk and thin film refractive indices, and explore their optical properties.
Method Article
Evanescent Field Based Photoacoustics: Optical Property Evaluation at Surfaces
In This Article
Summary
Abstract
Here, we present a protocol to estimate material and surface optical properties using the photoacoustic effect combined with total internal reflection. Optical property evaluation of thin films and the surfaces of bulk materials is an important step in understanding new optical material systems and their applications. The method presented can estimate thickness, refractive index, and use absorptive properties of materials for detection. This metrology system uses evanescent field-based photoacoustics (EFPA), a field of research based upon the interaction of an evanescent field with the photoacoustic effect. This interaction and its resulting family of techniques allow the technique to probe optical properties within a few hundred nanometers of the sample surface. This optical near field allows for the highly accurate estimation of material properties on the same scale as the field itself such as refractive index and film thickness. With the use of EFPA and its sub techniques such as total internal reflection photoacoustic spectroscopy (TIRPAS) and optical tunneling photoacoustic spectroscopy (OTPAS), it is possible to evaluate a material at the nanoscale in a consolidated instrument without the need for many instruments and experiments that may be cost prohibitive.
Introduction
Advancements in the understanding of optical materials1,3,4,6,7,10,13-16 have provided new insights into the creation of thin film materials for a host of optical devices, including antireflection coatings on lenses, high extinction ratio optical filters, and highly absorbing slab waveguides17. These advancements would not be possible without the use of many characterization techniques, such as ellipsometry4,6,18, contact angle measurement, atomic force microscopy7,11,19, and scanning/transmission electron microscopy, which assist in the iterative improvement of these technologies by providing direct measures or indirect estimates of fundamental optical material properties. Said properties, such as the refractive index, govern how the materials interact with incident photons, which directly affects their function and their use in optical applications. However, each of these techniques has limitations relating to resolution, sample preparation, cost, and complexity, and each generates only a subset of the data needed to fully characterize the material. That being said, a new set of techniques, known as evanescent field-based photoacoustics (EFPA)5,6,15,18,20-49 as shown in Figure 1, has the potential to estimate material properties at the nanoscale in a consolidated set of experiments. EFPA encompasses the sub-techniques of total internal reflection photoacoustic spectroscopy (TIRPAS)23,25,26,33-35,43-45 , photoacoustic spectroscopy/total internal reflection photoacoustic spectroscopy refractometry (PAS/TIRPAS refractometry)18, and optical tunneling photoacoustic spectroscopy (OTPAS)6, and has been used to estimate bulk and thin film refractive index, film thicknesses, as well as to detect absorbing materials at a prism/sample or substrate/sample interface.
In order to understand the EFPA mechanism, one must first understand the concept of photoacoustic spectroscopy (PAS), which refers to the generation of ultrasonic pressure waves by the rapid thermoelastic expansion of a chromophore, following the absorption of an ultra-short (< µsec) pulse of light (Figure 1). Theoretical and mathematical framework for the photoacoustic effect discussed in this paper can be obtained here50-59. The resulting change in pressure can be detected by an ultrasonic microphone or transducer. The photoacoustic effect, originally discovered in 1880 with the invention of Alexander Graham Bell's photophone, was "rediscovered" in the early 1970s due to advancements in laser and microphone technology, and eventually put into practical use to fill niche applications from biomedical imaging to thin film analysis to non-destructive testing of materials.1,53-57,59-82 This effect can be mathematically described with one-dimensional wave equations, wherein the wave is a simple acoustic source whose pressure (p) varies in both position (x) and time (t):

with solutions for simple acoustic sources of the form64

where p is pressure, Γ=αvs2/Cp where α is the volume thermal expansion coefficient, vs is the speed of sound in the medium, and Cp is the heat capacity at constant pressure, H0 is the radiant exposure of the laser beam, c is the speed of sound in the excited medium, x is length, and t is time. The magnitude of the resulting acoustic wave relies directly upon the optical absorption coefficient of the material, µa, which is the inverse of the optical penetration depth, δ, which is in turn a measure of the distance the light travels until it decays to 1/e of its initial optical intensity. While Equation (1) is a general equation for a one dimensional plane wave source, typical absorbers will emit a spherical acoustic wave in three dimensions. Beyond the mathematical description, applications of the photoacoustic effect54 span many imaging modalities such as microscopy, tomography, and even molecular imaging owing to the photoacoustic effect having high sensitivity due to the large optical absorption due to the naturally present chromophore hemoglobin. Other applications of the photoacoustic effect even include the estimation of various thin film properties15,16,20,21,24,26-32,36-39,41,42,56,83,84. However, PAS does have certain limitations: (1) its extensive optical penetration depth eliminates the ability to probe near-field optical properties at surfaces (2) its efficiency of capturing the emitted acoustic energy is low due to spherical propagation of the majority of the energy away from the detector (3) samples must include chromophores in the wavelength regime under consideration.
When combined with evanescent field-based techniques, however, many of these limitations can be ameliorated. The evanescent field occurs when a beam of light undergoes total internal reflection (TIR), as described by Snell's Law, which effect also allows fiber optic waveguides to guide light large distances (km) for computation and telecommunication applications. In practical applications, the evanescent field is used in a variety of characterization and imaging technologies, including attenuated total reflectance spectroscopy (ATR). Imaging is achieved with high contrast due to the confinement of the light to within the first few hundred nanometers into the sample of interest. The evanescent field takes the form of an exponentially decaying field that extends into the external medium to an optical penetration depth that is typically on the order of the wavelength being used (usually ~500 nm or less) as shown in equations 3 and 4.

where I is the light intensity in % at a location z from the prism/sample interface, I0 is the initial light intensity in % at the interface, z is distance in nanometers, and δp is the optical penetration depth as shown in equation 4. With such a small optical penetration depth, the evanescent field is able to interact with the environment very close to the interface of the two materials, and well below the optical and acoustic diffraction limits. The optical properties of materials or particles within this range may perturb the field or otherwise alter its generation, which interaction can be detected by a variety of methods3,5,6,10,15,17,18,21,23,25-27,29-47,84-95.
When evanescent techniques are combined with PAS, the photoacoustic waveforms produced can be used to characterize materials or particles interacting with the evanescent field, creating the evanescent-field based photoacoustics (EFPA) family of techniques, as shown in Figure 1. This family includes, but is not limited to, total internal reflection photoacoustic spectroscopy (TIRPAS), optical tunneling photoacoustic spectroscopy (OTPAS), and surface plasmon resonance photoacoustic spectroscopy (SPRPAS). The interested reader should refer to the following references for derivations of the equations used for TIRPAS5,6,18,23,25,26,33-35,43-47, PAS/TIRPAS refractometry18, and OTPAS6. In each case, the photoacoustic effect is generated through a different excitation mechanism than simple transmittance through a prism; for instance, in TIRPAS, the light is evanescently coupled through a prism/substrate/sample interface into the chromophores (which could include the sample material itself, or guest molecules within the sample), whereas in SPRPAS, the primary mode of excitation is instead through the absorption of a surface plasmon, which is a secondary E-M wave created when the energy of the evanescent field is transferred into the electron cloud of a metal layer deposited on the prism surface. This family of techniques was originally invented in the early 1980s by Hinoue et al., and improved upon by T. Inagaki et al. with the invention of SPRPAS, but saw very little development due to technical limitations of the light sources and available detection equipment. More recently, previous investigations have shown that increased sensitivity and utility are possible with modern polyvinylidene fluoride (PVDF) ultrasonic detectors and q-switched neodymium-doped yttrium aluminum garnet (Nd:YAG) lasers. Specifically, nanosecond-pulsed Nd:YAG lasers result in a 106 fold increase in the peak power, which enables EFPA techniques to become useful tools for evaluating the optical properties of a variety of materials and interfaces5,6,15,18,21-29,31-47,84,96. Additionally, previous work has further shown the capability of such techniques to determine structural information about materials at an interface, which was previously never achievable with traditional photoacoustic spectroscopy (PAS) technologies due to their relatively large penetration depth53,55,57,59,61,62,69,73,75,80,81.
This capability is shown in the protocols that follow under the OTPAS technique; however, on a more fundamental level the three techniques each rely on a different definitive equation, which determines the capabilities of the technology. For example, in TIRPAS, the optical penetration depth of the evanescent field, δ'p, primarily drives the resulting acoustic signal intensity to an absorbing sample, and is described by:

where λ1 is the wavelength of light traveling through the prism medium and is defined by the relation λ1 = λ/n1 wherein n1 is the refractive index of the prism material. Additionally, θ refers to the angle of excitation, and n21 refers to the ratio of the refractive indices of each medium and is defined by n21 = n2/n1, wherein n2 is the refractive index of the sample material. The larger the optical penetration depth, the more material is being irradiated. For the photoacoustic effect, the greater the optical penetration depth, the more material is being excited that can produce acoustic waves leading to a larger acoustic signal.
Unlike TIRPAS however, in PAS/TIRPAS refractometry the primary equation is Snell's law:

where n1 is the refractive index of the prism, θ1 is the angle of incidence at the prism/sample interface, n2 is the refractive index of the sample, and θ2 is the angle of the light that is refracted through the second medium. The sensitivity of estimating the refractive index of a material is primarily driven by the accuracy of the estimation of θ1. In total internal reflection, which is achieved when θ1 is beyond the critical angle which generates an evanescent field, sin θ2 = 1 and therefore, Equation 5 reduces to n2 = n1sinθ1. (Note: θ1= θcritical) Knowing the angle at which the numerical derivative (dP/dθ where P is the peak to peak voltage of the photoacoustic signal and θ is the angle of incidence of the light with the sample) of the photoacoustic signal has a local minima allows for the estimation of θ1 that allows the user to solve for n2 and thus estimate the bulk refractive index of a sample as shown in Figure 1.
Finally, in OTPAS, the following equation relates optical transmission in % to photoacoustic peak to peak voltage by:

where T is the percent optical transmission, p is the peak-to-peak voltage generated by the angular spectrum of a substrate with a film on it, p0 is the peak-to-peak voltage generated by the angular spectrum of a substrate, β is the coupling constant based upon the refractive index of prism and the immersion oil, α is the attenuation factor, and is a factor that includes thickness and refractive index of the sample film within the evanescent field. The sensitivity of this technique to thickness and refractive index is driven by the accuracy of estimating the peak to peak acoustic signal intensities, p and p0 at each angle of incidence in the angular spectrum. It has been shown that β can be directly calculated based upon the refractive indices of the prism and the immersion oil; consequently, it is a straightforward task to calculate the optical transmission at each angle of incidence and to then extract an estimate for the refractive index and thickness of the film through statistical curve fitting analysis. The interested reader should refer to Goldschmidt et al. for more information.5,6
The EFPA system is a photoacoustic based system capable of estimating the thickness, thin film refractive index, bulk refractive index, and generating acoustic signals through optical absorption for detection. The system is comprised of a laser, an optical train to guide the light to the prism/sample and to the laser energy measurement side. The laser energy measurement side is used to normalize the photoacoustic signal to the incident laser energy as shown in Figure 2. The EFPA system is driven by a stepper motor driver to rotate the prism/sample for the angular spectra in PAS/TIRPAS refractometry and OTPAS. The system acquires data through a digital acquisition card and provides a user interface and automated stage control through an in house program.
Protocol
1. Setting up the System
- Use cyanoacrylate epoxy to adhere a 9 mm diameter, 1 mm thick red latex rubber cylinder to the front face of one 10 MHz ultrasonic transducer and use cyanoacrylate epoxy to adhere a 9 mm diameter, 1 mm thick red latex rubber cylinder to a 6 mm thick acrylic block which is then epoxied the same way to the reference ultrasonic transducer to act as an acoustic spacer.
- Set up an optical train that has a beam expander being hit by the laser first. Then place a manually adjustable aperture second. Finally use a polarizing beam splitter cube as the third element and place the ultrasonic transducer not in the EFPA prism holder and the transducer in the EFPA prism holder at each output of the non-polarizing beam splitter.
Note: The polarizing beam splitter cube is used to ensure a pure, single polarization for excitation as this is critical to the proper functionality of all EFPA techniques. - Expand the outgoing laser beam using lenses to create a beam expander of at least 3X from the q-switched ND:YAG laser.
Note: The beam is intentionally oversized compared to the latex rubber absorber on the sample transducer in order to ensure proper sensor function despite laser light walk off due to refraction through the prism at varying angles of incidence. - Align the optical train and EFPA prism holder such that the flat side of the mount nearest the prism will be set to a 0° angle using a digital level. This ensures a correct starting point for the angular spectrum data that will be collected during the experiments.
- Connect and power on external devices such as the oscilloscope, stepper motor driver to the computer, the ultrasonic transducers, and XY stage motors. Physically connect the transducer not in the EFPA prism mount to Ch0 and physically connect the transducer in the EFPA prism mount to Ch1 via 50 ohm BNC cables. The software is preprogrammed to recognize acoustic signals from these specific channels.
2. EFPA System Initialization and Optical Alignment
- Manually adjust the adjustable aperture to block the beam to a 1 mm diameter.
- Start the programming software (e.g., LabVIEW), set the angle to 70° by pressing the green "move" button to move the mount to the angle necessary for 70° excitation at the prism/sample interface.
- Using appropriate laser safety glasses (OD 7+ at 532 nm), look into the prism from the side perpendicular to the laser beam and manually move the stage in the X and Y axes using the hand wheels until the 1 mm laser spot is fluorescently visible on the rubber latex. Ensure that the beam is centered on the latex.
- Expand the manually adjustable aperture to its maximum opening and look at the running front panel of the program to ensure both the laser energy measurement photoacoustic signal from the EFPA prism mount (red line) and the photoacoustic signal from the laser energy measurement side (white line) are visible and are approximately the same amplitude.
- Stop the program by pressing the "STOP" button.
Note: If the button is not pressed the prism will have to be manually reset before continuing the testing. Once the initialization protocol has been completed, TIRPAS, PAS/TIRPAS refractometry, or OTPAS can be performed.
3. TIRPAS Technique
- Place the prism in the plastic prism mount adapter as shown in Figure 3. Next, place 2.5 µl of immersion oil index matched to the type of prism used, onto the center of the prism and sandwich the oil by placing a substrate on top of the oil layer.
- Place 25 µl of sample on the latex rubber connected to the transducer in the EFPA transducer mount as shown in Figure 3 so that it coats the entire surface without bubble formation. The sample can be any optically absorbing material such as a solution of dye, a biological fluid, or an analyte suspended in a solution. No preparation of the sample is needed. Compress the prism mount and tighten the mount together with mounting screws to a set torque of 16.75 g/mm for each screw.
- Select the "Setup" tab and select "Setup" on the drop-down menu.
- Run the program entitled OTPAS thin film analyzer_USB-5133.vi (Supplementary File).
- View the acoustic signal generated by the sample as shown in Figure 4.
Note: The angle of incidence can be changed to control the optical penetration depth of the evanescent field to observe thinner or thicker optical sections of the sample.
4. PAS/TIRPAS Refractometry
- Place the prism in the plastic prism mount adapter as shown in Figure 3. Next, place 2.5 µl of immersion oil index matched to the type of prism used, onto the center of the prism and sandwich the oil by placing a substrate on top of the oil layer.
- Place 25 µl of sample onto the rubber piece connected to the transducer in the EFPA transducer mount as shown in Figure 3. Compress the prism mount and tighten the mount together with mounting screws to a set torque of 16.75 g/mm for each screw.
- Select the "Angular Spectrum" tab and select "Angular Spectrum" on the drop down menu. Next, input the appropriate parameters into the program as shown in Table 1.
- Run the program and wait until the angular spectrum has been completed and the program has ended.
- Right click on the angular spectrum graph and select "Export → Export data to excel" to save the data and open the .csv file.
- Open this data in a graphing program (e.g., KaleidaGraph), and perform a numerical derivative on it clicking on "Macros" and selecting "Derivative". Input the appropriate columns to take the derivative on and press "Okay" and the numerical derivative will be computed.
- Graph the numerical derivative vs. angle and select "Curve fit". Select the "Smooth" option5,18,98 and select the checkbox of the data under "Curve fit selections" to fit to smooth noise from the data. Select the down arrow under "View" and select "Copy curve fit to data window" to extract the curve fit data to another column.
- Manually search through the curve fit to find the local minimum and its corresponding angle of incidence that indicates a transition from the PAS to TIRPAS regimes. That minimum corresponds to the measured critical angle, as shown in Figure 5. Using the equation nsample = nprismsinθc, calculate the bulk refractive index of the unknown sample at the wavelength used for laser interrogation. Typical results are shown in Table 1.
5. OTPAS
- Place 2.5 µl of immersion oil (index matched to type of glass used) on the center of the prism.
- Place the film or substrate to be tested film side up (away from the prism) and ensure that no bubbles are formed during placement.
Note: If bubbles form, remove sample film or substrate and reattempt application. - Place 25 µl of immersion oil on the latex rubber so that the immersion oil coats the entire surface without bubble formation.
- Compress the substrate/film layers as shown in Figure 3. Tighten the mounting screws to a set torque of 16.75 g/mm that must be identical for each screw.
Note: Torque wrench in protocol is in oz.-in., therefore 16.75 g/mm ~ 15 oz.-in. - Select the "Angular Spectrum" tab and select "Angular Spectrum" on the drop down menu. Next, input the appropriate parameters into the program as shown in Table 3.
- Run the program and wait until the angular spectrum has been completed and the program has ended.
- Rerun the test by performing steps 5.1-5.6 using the substrate or film (whichever wasn’t done previously) as shown in Figure 6.
- Select “Curve Fitting” in the drop down box and select the “Curve fitting” tab. Next, input the appropriate parameters as shown in Table 5. Select the film scan under “Sample”. Select the substrate scan under “Substrate”.
- Input the refractive index, polarization, and other options for the scans previously run in steps 5.1-5.6 as shown in Table 4.
- Run the program by selecting "Curve Fitting" in the drop down box and selecting the "Curve Fitting" tab. Observe the refractive index and thickness under "Film RI" and "Thickness of film" shown at the top right of the program's graphical user interface. Typical data is shown in Figure 7.
- Use the "Batch fit" option to fit many scans at once by inputting the number of scans to batch fit and selecting a .csv file to output the data to and repeat step 5.10.
Note: Once the program is run it will fit each set of data and output all refractive index, thickness, and residual values to the .csv. In order for this to work, the scans must be in a numerical list such as scan_001.csv, scan 002.csv, etc.
Results
Results have been shown for TIRPAS, PAS/TIRPAS refractometry, and OTPAS that are the subtechniques within the EFPA platform. Figure 4 shows a representative TIRPAS acoustic wave generated from an absorbing sample. The bipolar nature of the acoustic wave is characteristic of the TIRPAS technique and indicates that TIRPAS is occurring. This bipolar waveform occurs due to the acoustic reflection at the interface between the sample and the glass substrate due to a large difference in acoustic impedance. For PAS/TIRPAS refractometry Figure 5 and Table 1 was obtained. Figure 5 shows the angular spectrum and numerical derivative obtained for a sample undergoing testing to estimate the bulk refractive index. Table 1 shows the results of using the PAS/TIRPAS refractometry to estimate the bulk refractive index of a Water/PEG/Direct red dye mixture as compared to the bulk refractive index estimate using a standard handheld refractometer. Finally, OTPAS results are shown in Figure 7 and Table 2. Figure 7 shows two figures of the angular scans that are taken during OTPAS. Table 2 shows a comparison between OTPAS and spectroscopic ellipsometry of the same thin film samples.
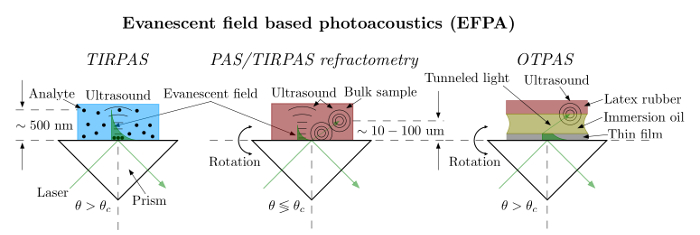
Figure 1. Subtechnologies of EFPA. EFPA is currently comprised of three distinct sub-technologies. These technologies are TIRPAS, PAS/TIRPAS refractometry, and OTPAS. Each technique can evaluate materials to derive or determine different properties. TIRPAS detects materials based upon their optical absorption for biosensing purposes, PAS/TIRPAS refractometry evaluates bulk refractive index, and OTPAS evaluates thin film refractive index and thickness. In TIRPAS, the light beyond the critical angle θc creates an evanescent field that can generate an acoustic wave upon interacting with an optical absorber. In PAS/TIRPAS refractometry, both TIRPAS and PAS waveforms are obtained from both evanescent field photoacoustic excitation and traditional photoacoustic excitation. By plotting these two regimes on an angular spectrum graph, the transitional angle can be observed, which can then be used to derive the refractive index. Finally, in OTPAS, a spectrum of acoustic signals are obtained with laser irradiation beyond the critical angle θc for both a thin film on a substrate and a bare substrate. By applying a non-linear curve-fitting algorithm to the data, the thin film thickness and refractive index can be derived. Please click here to view a larger version of this figure.
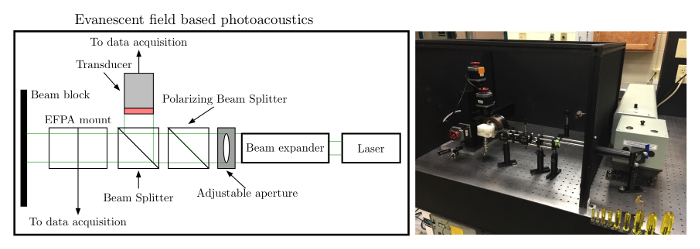
Figure 2. EFPA schematic/photo. Left: To set up EFPA the laser beam must be expanded to overfill the sensing area covered by the latex rubber. The beam should initially be at a 45-degree angle to the prism as shown. Right: Photo of the setup showing the optical train. Please click here to view a larger version of this figure.
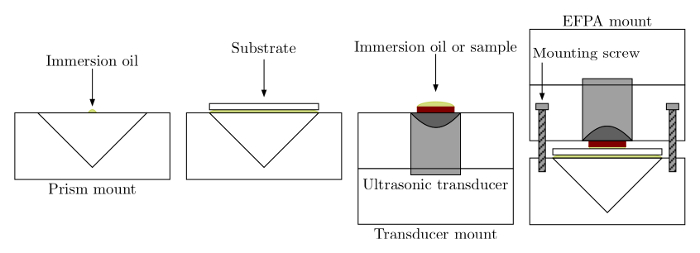
Figure 3. Sample loading. Samples are loaded with the prism making optical contact via immersion oil to the substrate. In TIRPAS or PAS/TIRPAS refractometry, direct liquid contact is achieved with the sample on the substrate for testing. In OTPAS, the optical coupling through additional immersion oil between the substrate and red latex rubber allows for optical tunneling to occur. The mount is then clamped together using a torque wrench and mounting screws. Please click here to view a larger version of this figure.
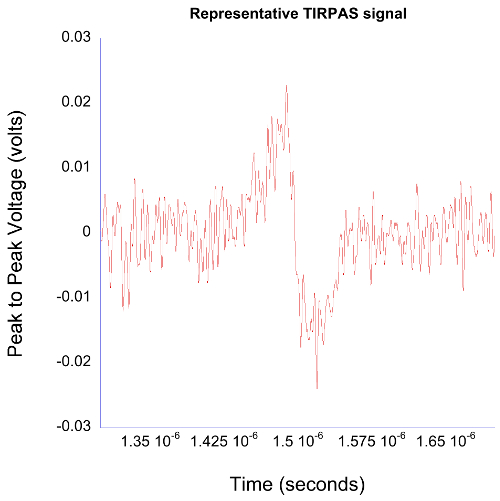
Figure 4. TIRPAS typical data. TIRPAS waveforms typically have a bipolar acoustic signal appearance that is characteristic of the TIRPAS method. Please click here to view a larger version of this figure.
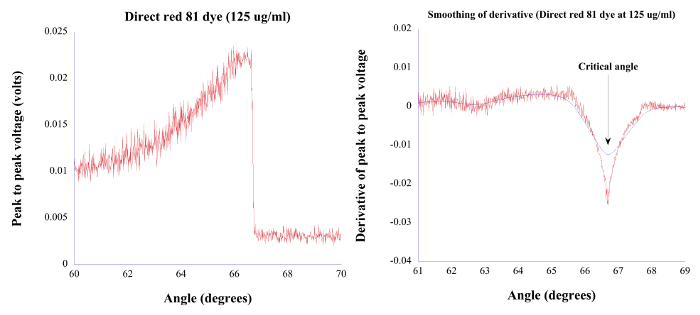
Figure 5. PAS/TIRPAS typical data. Left: Angular spectrum data that is obtained by irradiating the sample at various angles of incidence. Right: Numerical derivative of left figure that reveals a local minima indicating the transition from the PAS to TIRPAS regimes, which in turn corresponds with the position of the critical angle. Reprinted with permission.18 Please click here to view a larger version of this figure.
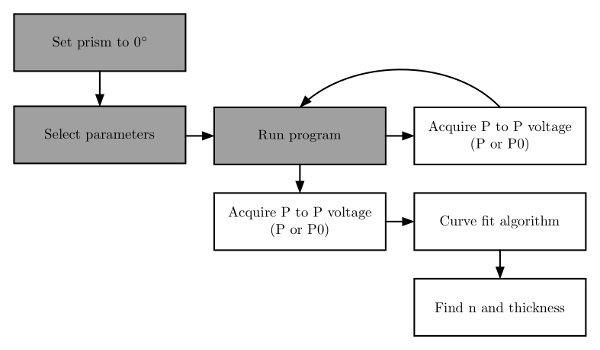
Figure 6. Program flow chart. The program is run in a few iterative steps. The prism mount is set to zero degrees and then parameters are selected before running the program. Then the program is run to acquire an angular spectrum of both a substrate and a film. Finally, a curve is fit to the data to estimate the film refractive index and thickness. Reprinted with permission.6 Please click here to view a larger version of this figure.
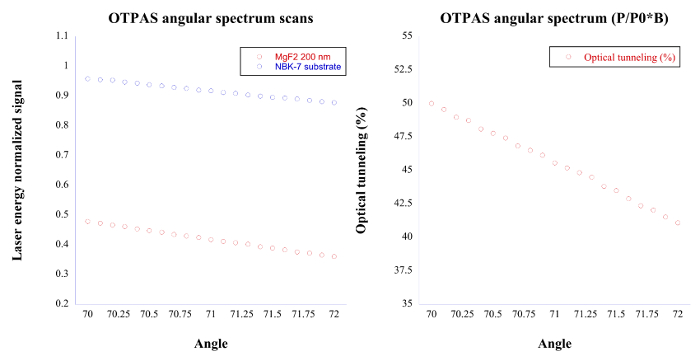
Figure 7. OTPAS typical data. Left: This figure shows the angular spectrum scans of an MgF2 film and an N-BK7 substrate respectively. Right: By dividing the MgF2 film angular spectrum scan by the N-BK7 substrate scan and multiplying by a constant factor beta, degree of optical tunneling (%) vs. angle of incidence can be obtained, which allows for the estimation of the refractive index and thickness of the thin film. Please click here to view a larger version of this figure.
| PAS/TIRPAS | Sample 1 | Sample 2 | Sample 3 | Sample 4 | Sample 5 | Atago R-5000 |
| Direct red/PEG 125 µg/ml | 1.395 | 1.395 | 1.395 | 1.395 | 1.395 | 1.395-1.397 |
| Direct red/PEG 250 µg/ml | 1.39 | 1.39 | 1.39 | 1.39 | 1.39 | 1.390-1.396 |
| Direct red/PEG 500 µg/ml | 1.388 | 1.389 | 1.389 | 1.389 | 1.389 | 1.381-1.395 |
| Direct red/PEG 750 µg/ml | 1.382 | 1.382 | 1.387 | 1.387 | 1.387 | 1.372-1.395 |
| Myoglobin 460 µg/ml | 1.33 | 1.329 | 1.331 | 1.33 | 1.331 | 1.335 |
Table 1. PAS/TIRPAS results. The following table shows typical results for Direct Red dye with 50% PEG mixed in to raise the refractive index. Reprinted with permission.18
| Test type | Technique | Film type | Refractive index | Thickness (nm) |
| Intrasample | OTPAS | MgF2 200 nm | 1.384±0.004 | 203±6 |
| Intrasample | Ellipsometry | MgF2 200 nm | 1.393±0.001 | 192.4±1.1 |
| Intersample | OTPAS | MgF2 200 nm | 1.395±0.011 | 220±19 |
| Intersample | Ellipsometry | MgF2 200 nm | 1.392±0.002 | 195.2±1.8 |
Table 2. OTPAS results. The following table shows typical results for 200 nm MgF2 thin films in OTPAS vs. spectroscopic ellipsometry. Intrasample refers to testing a single film ten times, whereas intersample refers to testing ten films independently. Reprinted with permission.6
| # of averages | 1 | Start angle | 60 | Warmup (min) | 0 | Refractive index (prism) | 1.519 |
| # scans | 1 | Step size | 0.1 | Save to | “yourfilename”.csv | Microstep # | 10 |
| Set Q-switch | 275 | Stop angle | 80 | Laser select | Surelite | Velocity (rpm) | 500 |
| Error tolerance (%) | 5 | Laser startup | on | Low pass filter (program) | 1.00 x 10⁷ | Acceleration (RPS) | 200 |
Table 3. Angular spectrum settings for PAS/TIRPAS refractometry. The following table shows the settings necessary for an angular spectrum in PAS/TIRPAS refractometry.
| # of averages | 64 | Start angle | 70 | Warmup (min) | 1 | Refractive index (prism) | 1.519 |
| # scans | 1 | Step size | 0.1 | Save to | “yourfilename”.csv | Microstep # | 10 |
| Set Q-switch | 275 | Stop angle | 72 | Laser select | Surelite | Velocity (rpm) | 500 |
| Error tolerance (%) | 5 | Laser startup | on | Low pass filter (program) | 1.00 x 10⁷ | Acceleration (RPS) | 200 |
Table 4. Angular spectrum settings for OTPAS. The following table shows the settings necessary for an angular spectrum in OTPAS.
| Lower refractive index | 1 | Tolerance | 1.00 x 10⁻¹² | Coupler RI | 1.519 | Substrate data | Select yourfilename.csv |
| Lower thickness | 0 nm | Refractive index guess | 1.3 | Wavelength | 532 nm | Multiple files save to | Select yourfilename.csv |
| Upper thickness | 1,000 nm | Thickness guess | 200 nm | Polarization | P polarized | How many files | # of files you want to fit |
| Max iteration | 5,000 | Substrate RI | 1.519 | Film data | Select yourfilename.csv | Type of fit | Single fit/Batch fit |
Table 5. Curve fitting parameters. The following table shows the curve fitting parameters necessary for correct parameter estimation.
Supplemental Code File: OTPAS thin film analyzer_USB-5133.vi. Please click here to download this file.
Discussion
The use of devices for the characterization of materials at the nanoscale will undoubtedly continue far into the future in order to produce new materials and combinations of materials to solve difficult and costly societal problems. Many methods such as ellipsometry, atomic force microscopy (AFM), and traditional photoacoustics are currently used to evaluate material properties at the nanoscale despite their inherent limitations due to few alternatives. EFPA shows promise as a consolidated set of techniques that can push beyond the typical limitations of the photoacoustic effect to provide a single instrument to characterize materials at the nanoscale.
The protocol described herein and its associated sub-techniques have the capability to estimate both bulk and thin film refractive indices of a material, film thickness, and have detection capabilities for a variety of biosensing applications. OTPAS specifically has the advantage that it can estimate the thickness and refractive index of nanometer scale films despite the fact that the films themselves do not contain inherently absorbing pigmentation. EFPA as a consolidated set of techniques has a few advantages over techniques such as ellipsometry, atomic force microscopy, and the traditional photoacoustic effect. The first advantage is that EFPA is comparatively inexpensive to set up. A typical EFPA setup can estimate refractive index from both the bulk and surface, can estimate thickness, and can probe absorbing materials and will cost around $5,000 to set up. In contrast, AFM setups cost around $50,000 and cannot estimate optical properties. Secondly, EFPA can estimate these properties within a few minutes without complex interaction such as in ellipsometry where input parameter error can cause differences in results. Finally, EFPA, when compared to the traditional photoacoustic effect, has axial resolution 100X smaller as it can estimate thickness of 200 nm films6 whereas the traditional photoacoustic effect is limited to 7,500 nanometers when using similar lasers and setup82. Conveniently, almost every material has independent and differing surface and bulk refractive index properties as well as absorptive properties, which collectively make for functional differences in their use in optical research systems.
Critical steps within the protocol come down to three primary considerations. First, optical coupling of the sample, whether that be a liquid or a film, is crucial to obtain reliable and repeatable results. Air bubbles within the immersion oil or sample will lead to inaccurate characterization of the thickness, refractive index, and in some cases a complete lack of sensitivity of the transducer to the excited sample owing to the inability of ultrasound to adequately pass through a liquid/air interface due to vastly differing acoustic impedance values. Second, with regard to OTPAS, a sample that is homogeneously thick in the area irradiated by the laser beam in order to provide consistent thickness values during scanning since as of yet EFPA cannot determine thickness differences within the area of excitation. Finally, again with regard to OTPAS, the sample film must be transparent to the wavelength being used. This is a fundamental assumption made in the mathematical equations that describe how OTPAS finds thickness and refractive index values. If absorption is substantial enough that more than 1% of the incident light is absorbed by the film, characterization will not match the real thickness and refractive index values of the film.
Modifications to the EFPA technique can be made with relative ease and other types of components can be substituted in for more effective scans or functionality. The only major issues that have to be addressed when building an EFPA system are the following. First, it is crucial to have a method of automatically rotating a prism mount and acquiring acoustic signals at small (0.05 degree) increments. Second, having a nanosecond pulse width or shorter laser system to excite samples using the photoacoustic effect. Third, having a graphical user interface or program to acquire the data to do mathematical curve fitting and numerical derivatives for estimating thickness and bulk/thin film refractive index.
There are three fundamental limitations to EFPA. The first is that in order to find the bulk refractive index, thin film refractive index, thickness, or detect materials using TIRPAS, the sample must have a refractive index that is less than that of the prism or substrate it is in contact with so that total internal reflection can occur which is the basis of all three of these techniques. The second limitation is that EFPA currently requires physical contact in order to estimate thickness, refractive index, and for detection of properties. The final limitation is that OTPAS, a sub-technique of EFPA, currently requires optically transparent materials to estimate thickness and refractive index of the thin film of interest.
This type of consolidated instrument could find many applications in characterization environments including research cores and industrial environments. Future work regarding EFPA techniques is focused on the improvement of the refractive index accuracy through improvements in instrumentation and translational/rotational stages. Additional advancements will focus around the improvement of signal-to-noise ratio for the detection of smaller quantities of absorbing materials, so as to characterize weakly absorbing materials, as are found most commonly in biological systems.
Disclosures
The authors declare that they have no competing financial interests.
Acknowledgements
This project was funded by the National Science Foundation BRIGE Award (1221019).
Materials
| Name | Company | Catalog Number | Comments |
|---|---|---|---|
| 100 mm plano convex lens | Thorlabs | LA1509 | Plano convex lens for beam expander |
| -30 mm plano concave lens | Thorlabs | LC2679 | Plano concave lens for beam expander |
| 10 MHz Ultrasonic transducers | Harisonic | I31006T | Ultrasonic sensors used for photoacoustic detection, both for laser energy measurement and for OTPAS mount |
| Immersion oil Type A | Cargille | 16482 | Index of 1.519 to match that of NBK-7 substrates |
| Natural latex rubber sheet (red) | McMastercarr | 86085K11 | Index ~1.519 to match that of Type A immersion liquid to act as an optical absorber to measure optical tunneling and laser energy |
| Laser goggles | VERE | 53 | Used to protect eyes from laser light |
| Cage mounted non polarizing beam splitter cube | Thorlabs | CM1-BS013 | Split laser light so that one half can be measured and one half can be used for excitation |
| Cage mounted polarizing beam splitter cube | Thorlabs | CM1-PBS251 | Ensure light is polarized before being used for optical tunneling experiments |
| Graduated ring activated iris diaphragm | Thorlabs | SM1D12C | Cut beam down to a smaller size for alignment |
| Data acquisition card | National Instruments | USB-5133 | USB oscilloscope to acquire data |
| Stepper motor driver | National Instruments | MID-7604 | Stepper motor driver to drive stepper motors for angular spectra |
| Sherline XY stage (14”) | Sherline | 5600-CNC/5610-CNC | Sherline XY stage |
| 4-jaw self centering chuck | Sherline | 1076/1034 | Sherline rotational attachment |
| Right angle attachment | Sherline | 3701 | Right angle attachment to attach rotational mount |
| CNC rotary table | Sherline | 8730 | Rotary table for holding OTPAS prism/sample |
| Surelite I-20 laser system | Continuum | I-20 | Q-switched Nd:YAG laser for exciting samples |
| NBK-7 prism | Thorlabs | PS911 | Right angle prism for EFPA |
| Adjustable torque wrench | Tohnichi | RTD40Z | Adjustable torque wrench to equally tighten down the EFPA mount for each technique to 16.75 g/mm |
| Digital level | Micromark | 84519 | Digital level to ensure EFPA prism holder starts at 0 degree. |
References
- Byrappa, K., Kumar, B. V. S. Characterization of zeolites by infrared spectroscopy. Asian J Chem. 19 (6), 4933-4935 (2007).
- Coquil, T., Richman, E. K., Hutchinson, N. J., Tolbert, S. H., Pilon, L. Thermal conductivity of cubic and hexagonal mesoporous silica thin films. J Appl Phys. 106 (3), 034910(2009).
- Courjon, D. Near-Field Microscopy and Near-Field Optics. , Imperial College Press. (2003).
- Dultsev, F. N. Investigation of the microporous structure of porous layers using ellipsometric adsorption porometry. Thin Solid Films. 458 (1-2), 137-142 (2004).
- Goldschmidt, B. S. Photoacoustic Evaluation of Surfaces via Pulsed Evanescent Field Interaction. , University of Missouri. Doctor of Philosophy thesis (2014).
- Goldschmidt, B. S., et al. Characterization of MgF2 thin films using optical tunneling photoacoustic spectroscopy. Opt Laser Technol. 73, 146-155 (2015).
- Junno, T., Anand, S., Deppert, K., Montelius, L., Samuelson, L. Contact mode atomic force microscopy imaging of nanometer-sized particles. Appl Phys Lett. 66 (24), 3295(1995).
- Kang, T., Oh, S., Hong, S., Moon, J., Yi, J. Mesoporous silica thin films as a spatially extended probe of interfacial electric fields for amplified signal transduction in surface plasmon resonance spectroscopy. Chem Commun. (28), 2998-3000 (2006).
- Kresge, C. T., Leonowicz, M. E., Roth, W. J., Vartuli, J. C., Beck, J. S. Ordered mesoporous molecular sieves synthesized by a liquid-crystal template mechanism. Nature. 359 (6397), 710-712 (1992).
- Lew, C. M., Cai, R., Yan, Y. Zeolite Thin Films: From Computer Chips to Space Stations. Acc Chem Res. 43 (2), 210-219 (2010).
- Marchand, D. J., Hsiao, E., Kim, S. H. Non-contact AFM imaging in water using electrically driven cantilever vibration. Langmuir. 29 (22), 6762-6769 (2013).
- Yamada, T., et al. Surface Photovoltage NO Gas Sensor with Properties Dependent on the Structure of the Self-Ordered Mesoporous Silicate Film. Adv Mater. 14 (11), 812-815 (2002).
- Harrick, N. J. Internal Reflection Spectroscopy. Harrick Scientific Corporation. , (1987).
- Splinter, R., Hooper, B. A. An Introduction to Biomedical Optics (Optics and Optoelectronics). , Taylor and Francis, Inc. (2006).
- Sathiyamoorthy, K., Joseph, J., Hon, C. J., Matham, M. V. Proceedings of SPIE - The International Society for Optical Engineering. 8001, Braga. (2011).
- Hernandez, C. M., Murray, T. W., Krishnaswamy, S. Photoacoustic characterization of the mechanical properties of thin films. Appl Phys Lett. 80 (4), 691(2002).
- Veldhuis, G. J., Parriaux, O., Hoekstra, H. J. W. M., Lambeck, P. V. Sensitivity enhancement in evanescent optical waveguide sensors. J Lightwave Technol. 18 (5), 677-682 (2000).
- Goldschmidt, B. S., et al. Photoacoustic measurement of refractive index of dye solutions and myoglobin for biosensing applications. Biomed Opt Express. 4 (11), 2463-2476 (2013).
- Hansma, P. K., et al. Tapping mode atomic force microscopy in liquids. Appl Phys Lett. 64 (13), 1738(1994).
- Shen, Y. C., Zhang, S. Y., Jiang, Y. S., Zhu, R., Wei, Y. Angular resonance absorption spectra of Langmuir-Blodgett films studied by the photoacoustic technique. Thin Solid Films. 248 (1), 36-40 (1994).
- Inagaki, T., Motosuga, M., Arakawa, E. T., Goudonnet, J. P. Coupled surface plasmons in periodically corrugated thin silver films. Phys Rev B Condens Matter. 32 (10), 6238-6245 (1985).
- Negm, S., Talaat, H. Effect of intrinsic surface roughness and other decay processes on surface plasmon polariton resonance halfwidth. Ultrasonics Symposium. 1, 509-514 (1992).
- Hinoue, T., Murata, H., Kawabe, M., Yokoyama, Y. Effects of thermal diffusion and solvent materials on photoacoustic signals in total internal reflection technique. Anal Sci. 2 (5), 407-410 (1986).
- Xu, M., Zhang, S., Inagaki, T. Investigation of optical resonance absorption on bigratings by photoacoustic angular spectroscopy. Shengxue Xuebao/Acta Acustica. 25 (5), 440-444 (2000).
- Hinoue, T., Kawabe, M., Yokoyama, Y. Measurement of concentration profile of dye at glass-solution interface by photoacoustic spectrometry coupled with total internal reflection technique. Bull Chem Soc Jpn. 60 (10), 3811-3813 (1987).
- Iwasaki, T., Sawada, T., Kamada, H., Fujishima, A., Honda, K. Observation of semiconductor electrode-dye solution interface by means of fluorescence and laser-induced photoacoustic spectroscopy. J Phys Chem. 83 (16), 2142-2145 (1979).
- Rothenhausler, B., Rabe, J., Korpiun, P., Knoll, W. On the decay of plasmon surface polaritons at smooth and rough Ag-air interfaces: A reflectance and photo-acoustic study. Surf Sci. 137 (1), 373-383 (1984).
- Jiang, Y., Zhang, S., Shao, H., Yuan, C. Optical properties of Langmuir-Blodgett films investigated by a photoacoustic technique. Appl Opt. 34 (1), 169-173 (1995).
- Inagaki, T., Goudonnet, J. P., Royer, P., Arakawa, E. T. Optical properties of silver island films in the attenuated-total-reflection geometry. Appl Opt. 25 (20), 3635-3639 (1986).
- Talaat, H., Bucaro, J. A., Huang, W., Macdiarmid, A. G. Photoacoustic detection of plasmon surface polaritons in heavily doped polyacetylene films. Synth Met. 10 (4), 245-253 (1985).
- Jung, C. S., Park, G., Kim, Y. D. Photoacoustic determination of field enhancement at a silver surface arising from resonant surface plasmon excitation. Appl Phys Lett. 47 (11), 1165-1167 (1985).
- Inagaki, T., Nakagawa, Y., Arakawa, E. T., Aas, D. J. Photoacoustic determination of radiative quantum efficiency of surface plasmons in silver films. Phys Rev B. 26 (12), 6421-6430 (1982).
- Hinoue, T., Shimahara, Y., Yokoyama, Y. Photoacoustic observation of solid-liquid interface by means of total internal reflection technique. Chem Lett. 12 (2), 225-228 (1983).
- Hinoue, T., Shimahara, Y., Murata, H., Yokoyama, Y. Photoacoustic spectrometry by total internal reflection technique: Dependence of photoacoustic signal intensity on concentration and optical path. Bunseki kagaku. 33 (11), E459-E466 (1984).
- Hinoue, T., Murata, H., Yokoyama, Y. Photoacoustic spectrometry coupled with total internal reflection technique : Theory and experiment. Anal Sci. 2 (5), 401-406 (1986).
- Inagaki, T., Kagami, K., Arakawa, E. T. Photoacoustic study of surface plasmons in metals. Appl Opt. 21 (5), 949-954 (1982).
- Negm, S., Talaat, H., Pelzl, J. Proceedings of the IEEE Ultrasonics Symposium. 2, IEEE. Piscataway, NJ, United States, Baltimore, MD, USA. 1259-1261 (1993).
- Talaat, H., Dardy, H. D. Ultrasonics Symposium Proceedings. 2, IEEE. New York, NY, USA, Atlanta, Ga, USA. 700-703 (1983).
- Royer, P., Goudonnet, J. P., Inagaki, T., Chabrier, G., Arakawa, E. T. Photoacoustic study of the optical absorption of oblate silver spheroids in attenuated-total-reflection geometry. Physica Status Solidi (a). 105 (2), 617-625 (1988).
- Abdallah, T., Negm, S., Talaat, H. Photoacoustic surface plasmon for the detection of nicotine. Egypt J Solids. 25 (2), 181-189 (2002).
- Negm, S., Talaat, H. Radiative and non-radiative decay of surface plasmons in thin metal films. Solid State Commun. 84 (1-2), 133-137 (1992).
- Negm, S., Talaat, H. Surface plasmon resonance halfwidths as measured using attenuated total reflection, forward scattering and photoacoustics. J Phys: Condens Matter. 1 (50), 10201-10205 (1989).
- Muessig, P. R., Diebold, G. J. Total internal reflectance optoacoustic spectroscopy. J Appl Phys. 54 (8), 4251(1983).
- Sudduth, A. S. M., Goldschmidt, B. S., Samson, E. B., Whiteside, P. J. D., Viator, J. A. Total internal reflection photoacoustic detection spectroscopy. Progress in Biomedical Optics and Imaging. 7899, 78993E-78993E-78998(2011).
- Goldschmidt, B. S., et al. Total internal reflection photoacoustic spectroscopy for the detection of beta-hematin. J Biomed Opt. 17 (6), 061212(2012).
- Hinoue, T., Imamura, G., Yokoyama, Y. Study of the Adsorption Layer at the Glass-Dye Solution Interface by Variable Incidence-Angle Internal-Reflection Spectrometry. Bull Chem Soc Jpn. 66 (12), 3680-3685 (1993).
- Hinoue, T., Kawabe, M., Doi, S., Yokoyama, Y. Photoacoustic estimation of reflectivities at solid-liquid interfaces by using total internal reflection technique. Hyomen Kagaku. 10 (2), 129-134 (1989).
- Hinoue, T., Kawabe, M., Yokoyama, Y. Measurement of concentration profile of dye at glass-solution interface by photoacoustic spectrometry coupled with total internal reflection technique. Chem Soc Japan. 60, 3811-3813 (1987).
- Hinoue, T., Murata, H., Yokoyama, Y. Photoacoustic spectrometry coupled with total internal reflection technique: theory and experiment. Anal Sci. 2, 401-406 (1986).
- Kinney, J. B., Staley, R. H. Applications of photoacoustic spectroscopy. Annu Rev Mater Sci. 12, 295-321 (1982).
- McDonald, F. A., Wetsel, G. C. Jr Generalized theory of the photoacoustic effect. J Appl Phys. 49 (4), 2313-2322 (1978).
- Rosencwaig, A. Photo-acoustic spectroscopy of solids. Rev Sci Instrum. 48 (9), 1133-1137 (1977).
- Jacques, S. L., Palthauf, G., Viator, J. A. Photoacoustic imaging in biological tissues with pulsed lasers. Ann Biomed Eng. 28 (Suppl. 1), S-39(2000).
- Xu, M., Wang, L. V. Photoacoustic imaging in biomedicine. Rev Sci Instrum. 77 (4), 041101(2006).
- Rosencwaig, A. Photoacoustic spectroscopy. Annu Rev Biophys Bioeng. 9, 31-54 (1980).
- Hess, P. Photoacoustic, Photothermal and Photochemical Processes at Surfaces and in Thin Films. , Springer-Verlag. (1989).
- Rosencwaig, A. Photoacoustics and Photoacoustic Spectroscopy. , Wiley. (1980).
- Rosencwaig, A. Theoretical aspects of photoacoustic spectroscopy. J Appl Phys. 49 (5), 2905-2910 (1978).
- Rosencwaig, A., Gersho, A. Theory of the photoacoustic effect with solids. J Appl Phys. 47 (1), 64-69 (1976).
- Holan, S. H., Viator, J. A. Automated wavelet denoising of photoacoustic signals for circulating melanoma cell detection and burn image reconstruction. Phys Med Biol. 53 (12), N227-N236 (2008).
- Viator, J. A. Characterization of Photoacoustic Sources in Tissue Using Time Domain Measurements. , Oregon Graduate Institute of Science \& Technology. (2000).
- Viator, J. A., et al. Clinical testing of a photoacoustic probe for port wine stain depth determination. Lasers Surg Med. 30 (2), 141-148 (2002).
- Viator, J. A., et al. A comparative study of photoacoustic and reflectance methods for determination of epidermal melanin content. J Invest Dermatol. 122 (6), 1432-1439 (2004).
- Viator, J. A., Jacques, S. L., Prahl, S. A. Depth profiling of absorbing soft materials using photoacoustic methods. IEEE Journal of Selected Topics in Quantum Electronics. 5 (4), 989-996 (1999).
- Weight, R. M., Viator, J. A. Detection of circulating tumor cells by photoacoustic flowmetry. Methods Mol Biol. 1102, 655-663 (2014).
- Gutierrez-Juarez, G., et al. Detection of melanoma cells in vitro using an optical detector of photoacoustic waves. Lasers Surg Med. 42 (3), 274-281 (2010).
- McCormack, D., Bhattacharyya, K., Kannan, R., Katti, K., Viator, J. A. Progress in Biomedical Optics and Imaging - Proceedings of SPIE. 7564, (2010).
- McCormack, D., Bhattacharyya, K., Kannan, R., Katti, K. Enhanced photoacoustic detection of melanoma cells using gold nanoparticles. Lasers Surg Med. Viator, J. A. 43 (4), 333-338 (2011).
- Hu, S., Maslov, K., Tsytsarev, V., Wang, L. V. Functional transcranial brain imaging by optical-resolution photoacoustic microscopy. J Biomed Opt. 14 (4), 040503-040503-040503(2009).
- Viator, J. A., et al. Gold nanoparticle mediated detection of prostate cancer cells using photoacoustic flowmetry with optical reflectance. J Biomed Nanotechnol. 6 (2), 187-191 (2010).
- Bhattacharyya, K., et al. Gold Nanoparticle-Mediated Detection of Circulating Cancer Cells. Clin Lab Med. 32 (1), 89-101 (2012).
- Galanzha, E. I., Shashkov, E. V., Tuchin, V. V., Zharov, V. P. In vivo multispectral, multiparameter, photoacoustic lymph flow cytometry with natural cell focusing, label-free detection and multicolor nanoparticle probes. Cytometry Part A. 73A (10), 884-894 (2008).
- Viator, J. A., Choi, B., Ambrose, M., Spanier, J., Nelson, J. S. In vivo port-wine stain depth determination with a photoacoustic probe. Appl Opt. 42 (16), 3215-3224 (2003).
- Wang, L. V. Multiscale photoacoustic microscopy and computed tomography. Nature Photonics. 3 (9), 503-509 (2009).
- Rousseau, G., Gauthier, B., Blouin, A., Monchalin, J. P. Non-contact biomedical photoacoustic and ultrasound imaging. J Biomed Opt. 17 (6), 061217-061211-061217-061217(2012).
- Hochreiner, A., Bauer-Marschallinger, J., Burgholzer, P., Jakoby, B., Berer, T. Non-contact photoacoustic imaging using a fiber based interferometer with optical amplification. Biomed Opt Exp. 4 (11), 2322-2331 (2013).
- Wang, Y., Li, C., Wang, R. K. Noncontact photoacoustic imaging achieved by using a low-coherence interferometer as the acoustic detector. Opt Lett. 36 (20), 3975-3977 (2011).
- McCormack, D., et al. Photoacoustic detection of melanoma micrometastasis in sentinel lymph nodes. J Biomech Eng. 131 (7), 074519(2009).
- Weight, R. M., Viator, J. A., Dale, P. S., Caldwell, C. W., Lisle, A. E. Photoacoustic detection of metastatic melanoma cells in the human circulatory system. Opt Lett. 31 (20), 2998-3000 (2006).
- Swearingen, J. A., Holan, S. H., Feldman, M. M., Viator, J. A. Photoacoustic discrimination of vascular and pigmented lesions using classical and Bayesian methods. J Biomed Opt. 15 (1), (2010).
- Talbert, R. J., Holan, S. H., Viator, J. A. Photoacoustic discrimination of viable and thermally coagulated blood using a two-wavelength method for burn injury monitoring. Phys Med Biol. 52 (7), 1815-1829 (2007).
- Samson, E. B., et al. Photoacoustic spectroscopy of beta-hematin. Journal of Optics. 14 (6), 065302(2012).
- Goudonnet, J. P., Inagaki, T., Arakawa, E. T., Ferrell, T. L. Angular and polarization dependence of surface-enhanced Raman scattering in attenuated-total-reflection geometry. Phys Rev B. 36 (2), 917-921 (1987).
- Inagaki, T., Kagami, K., Arakawa, E. T. Photoacoustic observation of nonradiative decay of surface plasmons in silver. Phys Rev B. 24 (6), 3644-3646 (1981).
- Ruddy, V., MacCraith, B. D., Murphy, J. A. Evanescent wave absorption spectroscopy using multimode fibers. J Appl Phys. 67 (10), 6070-6074 (1990).
- Gupta, B. D., Singh, C. D. Fiber-optic evanescent field absorption sensor: A theoretical evaluation. iber Integr Opt. 13 (4), 433-443 (1994).
- Court, I. N., von Willisen, F. K. Frustrated Total Internal Reflection and Application of Its Principle to Laser Cavity Design. Appl Opt. 3 (6), 719-726 (1964).
- Suter, J. D., Sun, Y., Howard, D. J., Viator, J. A., Fan, X. Proceedings of SPIE - The International Society for Optical Engineering. 7056, (2008).
- DeGrandpre, M. D., Burgess, L. W. Long path fiber-optic sensor for evanescent field absorbance measurements. Anal Chem. 60 (23), 2582-2586 (1988).
- Sun, Y., et al. Optofluidic ring resonator sensors for rapid DNT vapor detection. Analyst. 134 (7), 1386-1391 (2009).
- Mukundan, H., et al. Waveguide-Based Biosensors for Pathogen Detection. Sensors. 9 (7), 5783-5809 (2009).
- Gohring, J. T., Dale, P. S., Fan, X. Detection of HER2 breast cancer biomarker using the opto-fluidic ring resonator biosensor. Sensors and Actuators B: Chemical. 146 (1), 226-230 (2010).
- Sai, V. V. R., et al. Label-free fiber optic biosensor based on evanescent wave absorbance at 280nm. Sensors Actuators B: Chem. 143 (2), 724-730 (2010).
- Wang, F., Anderson, M., Bernards, M. T., Hunt, H. K. PEG Functionalization of Whispering Gallery Mode Optical Microresonator Biosensors to Minimize Non-Specific Adsorption during Targeted, Label-Free Sensing. Sensors (Basel). 15 (8), 18040-18060 (2015).
- Leung, A., Shankar, P. M., Mutharasan, R. A review of fiber-optic biosensors. Sensors Actuators B: Chem. 125 (2), 688-703 (2007).
- Saavedra, S. S., Reichert, W. M. Integrated optical attenuated total reflection spectrometry of aqueous superstrates using prism-coupled polymer waveguides. Anal Chem. 62 (20), 2251-2256 (1990).
- Cargille Labs. Cargille Microscope Immersion Oils. , http://www.cargille.com/immeroil.shtml (2015).
- Stineman, R. W. A Consistently Well-Behaved Method of Interpolation. Creat. Comp. , 54-57 (1980).
Reprints and Permissions
