We introduce the VacuSIP, a simple, non-intrusive, and reliable method for clean and accurate point sampling of water. The system was developed and evaluated for the simultaneous collection of the water inhaled and exhaled by benthic suspension feeders in situ, to cleanly measure removal and excretion of particulate and dissolved compounds.
A subscription to JoVE is required to view this content. Sign in or start your free trial.
Method Article
VacuSIP, an Improved InEx Method for In Situ Measurement of Particulate and Dissolved Compounds Processed by Active Suspension Feeders
In This Article
Summary
Abstract
Benthic suspension feeders play essential roles in the functioning of marine ecosystems. By filtering large volumes of water, removing plankton and detritus, and excreting particulate and dissolved compounds, they serve as important agents for benthic-pelagic coupling. Accurately measuring the compounds removed and excreted by suspension feeders (such as sponges, ascidians, polychaetes, bivalves) is crucial for the study of their physiology, metabolism, and feeding ecology, and is fundamental to determine the ecological relevance of the nutrient fluxes mediated by these organisms. However, the assessment of the rate by which suspension feeders process particulate and dissolved compounds in nature is restricted by the limitations of the currently available methodologies. Our goal was to develop a simple, reliable, and non-intrusive method that would allow clean and controlled water sampling from a specific point, such as the excurrent aperture of benthic suspension feeders, in situ. Our method allows simultaneous sampling of inhaled and exhaled water of the studied organism by using minute tubes installed on a custom-built manipulator device and carefully positioned inside the exhalant orifice of the sampled organism. Piercing a septum on the collecting vessel with a syringe needle attached to the distal end of each tube allows the external pressure to slowly force the sampled water into the vessel through the sampling tube. The slow and controlled sampling rate allows integrating the inherent patchiness in the water while ensuring contamination free sampling. We provide recommendations for the most suitable filtering devices, collection vessel, and storing procedures for the analyses of different particulate and dissolved compounds. The VacuSIP system offers a reliable method for the quantification of undisturbed suspension feeder metabolism in natural conditions that is cheap and easy to learn and apply to assess the physiology and functional role of filter feeders in different ecosystems.
Introduction
Benthic suspension feeders play essential roles in the functioning of marine ecosystems 1. By filtering large volumes of water 2,3, they remove and excrete particulate (plankton and detritus) and dissolved compounds 1 (and references therein) and are an important agent of benthic-pelagic coupling 4,5 and nutrient cycling 6,7. Accurately measuring the particulate and dissolved compounds removed and excreted by benthic suspension feeders (such as sponges, ascidians, polychaetes, and bivalves) is fundamental to understand their physiology, metabolism, and feeding ecology. Together with pumping rate measurements, it also enables a quantification of the nutrient fluxes mediated by these organisms and their ecological impact on water quality as well as on ecosystem scale processes.
Choosing the appropriate method of measuring removal and production rates of particulate and dissolved compounds by suspension filter feeders is crucial for obtaining reliable data concerning their feeding activity 8. As pointed out by Riisgård and others, inappropriate methodologies bias results, distort experimental conditions, produce incorrect estimations of ingestion and excretion of certain substances, and can lead to erroneous quantification of the nutrient fluxes processed by these organisms.
The two most frequently employed methods to measure particulate and dissolved nutrient fluxes in filter feeders involve either incubation (indirect techniques) or simultaneous collection of ambient and exhaled water (direct techniques). Incubation techniques are based on measuring the rate of change in the concentration of particulate and dissolved nutrients in the incubated water, and estimating rates of production or removal compared to adequate controls 8. However, enclosing an organism in an incubation chamber can alter its feeding and pumping behavior due to changes in the natural flow regime, due to a decline in oxygen and/or in food concentration, or due to accumulation of excretion compounds in the incubation water 7,9 (and references therein). In addition to the effects of confinement and modified water supply, a major bias of incubation techniques stems from re-filtration effects (see for example 10). Although some of these methodological problems have been overcome by using the right volume and shape of the incubation vessel 11 or with the introduction of a recirculating bell-jar system in situ12, this technique often underestimates removal and production rates. Quantifying the metabolism of dissolved compounds such as dissolved organic nitrogen (DON) and carbon (DOC) or inorganic nutrients, has proven to be especially prone to biases caused by incubation techniques 13.
In the late 60s and early 70s, Henry Reiswig 9,14,15 pioneered the application of direct techniques to quantify particle removal by giant Caribbean sponges, by separately sampling the water inhaled and exhaled by the organisms in situ. Due to the difficulty to apply Reiswig's technique on smaller suspension feeders and in more challenging underwater conditions, the bulk of research in this field was restricted to the laboratory (in vitro) employing mostly indirect incubation techniques 16. Yahel and colleagues refitted Reiswig's direct in situ technique to work in smaller-scale conditions. Their method, termed InEx 16, is based on simultaneous underwater sampling of the water inhaled (In) and exhaled (Ex) by undisturbed organisms. The different concentration of a substance (e.g., bacteria) between a pair of samples (InEx) provides a measure of the retention (or production) of that substance by the animal. The InEx technique employs open-ended tubes and relies on the excurrent jet produced by the pumping activity of the studied organism to passively replace the ambient water in the collecting tube. While Yahel and colleagues have successfully applied this technique in the study of over 15 different suspension feeders taxa (e.g., 17), the method is constrained by the high level of practice and experience required, by the minuscule size of some excurrent orifices, and by sea conditions.
To overcome these obstacles, we developed an alternative technique based on controlled suction of the sampled water through minute tubes (external diameter < 1.6 mm). Our goal was to create a simple, reliable, and inexpensive device that would allow clean and controlled in situ water sampling from a very specific point, such as the excurrent orifice of benthic suspension feeders. To be effective, the method has to be non-intrusive so as not to affect the ambient flow regime or modify the behavior of the studied organisms. The device presented here is termed VacuSIP. It is a simplification of the SIP system developed by Yahel et al. (2007) 18 for ROV-based point sampling in the deep sea. The VacuSIP is considerably cheaper than the original SIP and it has been adapted for SCUBA-based work. The system was designed according to principles presented and tested by Wright and Stephens (1978) 19 and Møhlenberg and Riisgård (1978) 20 for laboratory settings.
Although the VacuSIP system was designed for in situ studies of the metabolism of benthic suspension feeders, it can also be used for laboratory studies and wherever a controlled and clean, point-source water sample is required. The system is especially useful when integration over prolonged periods (min-hours) or in situ filtrations are required. The VacuSIP has been used successfully at the Yahel lab since 2011, and has also been employed in two recent studies of nutrient fluxes mediated by Caribbean and Mediterranean sponge species 21 (Morganti et al. submitted).
The use of specific samplers, the prolonged sampling duration, and the field conditions, in which VacuSIP is applied, entail some deviations from standard oceanographic protocols for collecting, filtering, and storing samples for sensitive analytes. To reduce the risk of contamination by the VacuSIP system or the risk of modification of the sampled water by bacterial activity after collection, we tested various in situ filtration and storage procedures. Different filtering devices, collection vessels, and storing procedures were examined in order to achieve the most suitable technique for the analysis of dissolved inorganic (PO43-, NOx-, NH4+, SiO4) and organic (DOC + DON) compounds, and ultra-plankton (<10 µm) and particulate organic (POC + PON) sampling. To further reduce the risk of contamination, especially under field conditions, the number of handling steps was reduced to the bare minimum. The visual format in which the method is presented is oriented to facilitate reproducibility and to reduce the time required to efficiently apply the technique.
System overview
To sample in situ pumped water from suspension feeders with exhalant orifices as small as 2 mm, the pumping activity of each specimen is first visualized by releasing filtered fluorescein dyed seawater next to the inhalant orifice(s) and observing its flow from the excurrent aperture 16 (see also Figure 2B in 18). The water inhaled and exhaled by the study specimen (incurrent and excurrent) are then simultaneously sampled with the use of a pair of minute tubes installed on custom-built manipulator or on two of the "arms" of an upside-down flexible portable tripod (Figure 1 and Supplementary Video 1). The water inhaled by the study organism is collected by carefully positioning the proximal end of one tube inside or near the inhalant aperture of the study organism. An identical tube is then positioned inside the excurrent orifice. This operation requires good care to avoid contact or disturbance of the animal, e.g., by sediment resuspension. To begin the sampling, a diver pierces a septum in the collecting vessel with a syringe needle attached to the distal end of each tube, allowing the external water pressure to force the sampled water into the vessel through the sampling tube. The suction is initiated by the vacuum previously created in the vials and by the pressure difference between the external water and the evacuated sample container.
To ensure a clean collection of exhaled water and to avoid accidental suction of ambient water 16, the water sampling rate needs to be kept at a significantly lower rate (<10%) than the excurrent flow rate. The suction rate is controlled by the length of the tube and its internal diameter (ID). The small internal diameter also ensures a negligible dead volume (< 200 µl per meter of tubing). Sampling over prolonged periods (minutes to hours) makes it possible to integrate the inherent patchiness of most substances of interest. To ensure that samples are adequately preserved in prolonged underwater sampling sessions as well as for transportation to the lab, an in situ filtration is recommended for sensitive analytes. The selection of sampling vessels, filtration assembly, and tubing are dictated by the study organisms and the specific research question. The protocol described below assumes that a full metabolic profile is of interest (for an overview see Figure 2). However, the modular nature of the protocol allows for easy modification to accommodate simpler or even very different sampling schemes. For a full metabolic profile, the sampling protocol should include the following steps: (1) Flow visualization; (2) Sampling ultra-plankton feeding (plankton < 10 µm); (3) Sampling inorganic nutrients uptake and excretion (using in-line filters); (4) Sampling dissolved organic uptake and excretion (using in-line filters); (5) Particulate feeding and excretion (using in-line filters); (6) Repeat step 2 (ultra-plankton feeding as quality check); (7) Flow visualization.
When logistically feasible, it is recommended that the metabolic profile measurements are combined with pumping rate (e.g., the dye front speed method, in 16) as well as with respiration measurements. These measurements are best taken at the beginning and end of the sampling session. For respiration measurement, underwater optodes or micro-electrodes are preferable.
Access restricted. Please log in or start a trial to view this content.
Protocol
1. Preparatory Steps and Cleaning Procedures
- Cleaning solution
- Wear protective gear, a lab coat, and gloves at all times. Carry out these preparatory steps in a clean space free of dust and smoke.
- Prepare a 5-10% hydrochloric acid (HCl) solution with fresh, high quality, double distilled water.
- Prepare a 5% highly soluble basic mix of anionic and non-ionic surfactant solution (See Materials List) with fresh, high quality, double distilled water.
- Store all solutions in clean, acid washed containers.
- Preparatory steps and cleaning procedures (in the lab)
NOTE: If phosphorus compounds are not of interest, the HCl wash can be replaced by high quality phosphoric acid (H3PO4) wash (8% H3PO4 final concentration).- Wear protective gear, a lab coat, and gloves at all times.
- Wash the sampling apparatus (excluding the in-line stainless steel Swinney filter holder) with ample amount of high purity water. Leave the apparatus soaking in 5-10% HCl solution overnight. Rinse the apparatus again with ample amount of high quality double distilled water.
- Wash the in-line stainless steel Swinney filter holders with ample amount of high purity water. Leave the filter holders soaking in 5% highly soluble basic mix of anionic and nonionic surfactants solution overnight. Rinse them again with ample high quality double distilled water.
- Dry all the sampling apparatus, wrap them in aluminum foil and keep in a clean box until use.
- Suction rate control
- Control the sampling rate by adjusting the length and internal diameter of the intake tubing according to the planned work depth and water temperature. Use the following equation (derived from the Hagen-Poiseuille equation used for fully developed laminar pipe flow) as a guide:
 where F= flow rate (cm3 min-1), ΔP = differential pressure (bar), r = inlet tubing internal radius (cm), K = 2.417 x 10⁻⁹ (sec-2), L = tube length (cm), V = water viscosity (g cm-1 sec-1). See Table 1 for more details.
 - Keep sampling rate below 1% of the pumping rate of the studied animal.
NOTE: Using evacuated containers, sometimes with unknown vacuum poses additional complications. Therefore, a field test is highly recommended. At 10 m depth and ~22 °C seawater (40 PSU), a 50 cm inlet tubing with an internal diameter of 254 µm delivers an average suction rate of ~26 µl sec-1 (1.56 ml min-1).
- Control the sampling rate by adjusting the length and internal diameter of the intake tubing according to the planned work depth and water temperature. Use the following equation (derived from the Hagen-Poiseuille equation used for fully developed laminar pipe flow) as a guide:
- Sampling vessels
- For small volume samples (3-20 ml, e.g., ultra-plankton for flow cytometry) use pre-vacuumed sterile plastic tubes.
NOTE: Pre-vacuumed sterile plastic tubes are routinely employed for standard blood tests in humans; make sure to use the sterile tubes with no additives. These vacuumed sterile plastic tubes are best sampled with the use of sterile, single-use tube holder with off-center Luer. While this is the safest and most efficient sampling apparatus, it has a slightly larger dead volume compared to a simple needle. - For larger water samples such as nutrients and dissolved organics, use 40 or 60 ml glass vials that meet the Environmental Protection Agency (EPA) criteria for volatile organic analyses. These vials include a polypropylene cap with a PTFE-faced silicone septum.
- For even larger volumes, use penicillin bottles with rubber stoppers or vacuum flasks.
- Use high-density polyethylene vials (HDPE vials) for silica samples.
- To increase sample volume and to reduce the risk of the stopper dislodging during the ascent, evacuate (vacuum) items 1.4.2-1.4.4 before the dive with a vacuum pump. Vacuum manually by using a hand vacuum pump or even by sucking the air with a syringe. However, for best results, a good vacuum pump is recommended. Standard lyophilizers provides high vacuum.
NOTE: Pay special attention when using large vacuumed flasks to ensure that the faster initial suction rate would not contaminate the exhaled water samples.
- For small volume samples (3-20 ml, e.g., ultra-plankton for flow cytometry) use pre-vacuumed sterile plastic tubes.
- Vessel cleaning procedures
- For dissolved organics and NH4+ analysis, use new pre-cleaned EPA vials.
- Rinse the vials (glass and HDPE) for analysis of other nutrients as follows:
- Rinse the vials (glass and HDPE) and the polypropylene caps with high quality double distilled water. Install a new silicon septum.
- Soak the vials (glass and HDPE) in 10% of HCl for at least 3 days and rinse with ample high quality double distilled water.
- Combust the glass vials at 450 °C for 4 hr and allow to cool in the furnace. Install the cap, and wrap in aluminum foil until use.
- Filters
- Use binder-free glass fiber filters for filtration of all dissolved organic samples (e.g., DOC, DON) and for the collection of particulate organics (e.g., POC, PON). Pack each glass filter in a separate aluminum foil envelope. Combust at 400 °C for 2 hr to volatilize organic residues and store in a clean and dry vessel until use.
- Use either a binder-free glass fiber filters as above, or 0.2 µm polycarbonate membranes for sampling inorganic nutrients (e.g., PO43-, NOx-, NH4+). Clean the latter once installed in the filter holder as explained below (1.7.3).
- Use 0.2 µm polycarbonate membranes filters for silica sampling. Clean them once installed in the filter holder as explained below (1.7.3).
- Preparation of filtration assembly
- Filter the highly soluble basic mix of anionic and non-ionic surfactant solution and the high quality double distilled water through a 0.2 µm filter before using them to clean the filtration assembly.
- Filtration assembly for nutrients and dissolved organics other than silica:
- Place a combusted binder-free glass fiber filters inside the cleaned in-line stainless steel Swinney filter holder.
- Use an acid-cleaned syringe to run 100 ml of 5% highly soluble basic mix of anionic and non-ionic surfactant solution and then 100 ml of high quality double distilled water through the entire assembly.
- Filtration assembly for SiO4:
- Place the polycarbonate filter inside the cleaned polycarbonate filter holder (PC filter holder).
- Use an acid-cleaned syringe to run 30 ml of 5% HCl and 30 ml of high quality double distilled water through the entire assembly.
- System assembly
- Assemble the system for underwater work using PEEK (Polyether Ether Ketone) tubing with an external diameter (OD) of 1.6 mm and an internal diameter (ID) of 254 µm or 177 µm.
- Use a sharp knife or PEEK cutter to cut the tubes to the required length.
- At its distal end (sample container side), fit each tube with a male Luer connector attached to a syringe needle. Make sure you follow the manufacturer's instruction and align the flat side of blue flangeless ferrule with the end of the tube before tightening the green nut.
- Attach the PEEK tubing to the tripod "arms" or custom-built manipulator by using an insulating tape.
- Attach a disposable syringe needle to the male Luer connector. Keep the needle with its protective cap to prevent injuries.
- Clearly label the sampling gear and color code all inhaled and exhaled components (e.g., green=In, red=Ex).
- Similarly color code the sampling vessels with sets of paired sampling vessels sequentially numbered.
2. Working Underwater
- Work site preparation
- Preliminary survey and selection of specimens
NOTE: Due to the complex nature of the underwater sampling protocol, devoting the necessary time for preparation will ensure an efficient sampling dive.- Survey the work site and make necessary preparations ahead of time.
- Select and mark suitable target organisms that can be accessed relatively easily. Since not all organisms may necessarily be active at the time of the sampling dive, prepare more workstations than you expect to sample.
- Installation of base supports
- When working on leveled substrate:
- Mount the original quick release clip of the flexible tripod on 1 kg diving weights and simply position it next to the target animal.
- When working on vertical walls:
- Mount base support plates for the VacuSIP system, hooks for accessory gear, and hangers for the collecting vessel carrying tray during the work site preparation stage (2.1.1).
- When flexible portable tripods are used, use bolts or two-component epoxy resin to fix 10x10 cm PVC plates next to each target animal. Each plate needs to have a hole to attach the quick release clips of the flexible portable tripod.
- Once the resin has cured and the base plates are solidly attached to the wall, screw in the quick release clips, serving as a firm attachment point for the flexible portable tripod for the VacuSIP system.
- When working on leveled substrate:
- Preliminary survey and selection of specimens
- Installing the VacuSIP
- Check whether the specimen is pumping by releasing filtered fluorescein dye next to the inhalant orifice and confirm that the dye is emerging through the exhalent orifice as described in Yahel et al. (2005) 16.
- Install the VacuSIP device and place the inhalant (IN) sampling tube within the inhalant orifice or just next to it (within ~5 mm). Make sure that the inhalant tube is not in the proximity of another exhalant orifice.
- Carefully direct the exhalant (EX) sampling tube toward the osculum/exhalant siphon and very gently insert it in, until it is positioned 1-5 mm inside the osculum/exhalant siphon (see Figure 1 and Supplementary Video 1). Take great care not to make contact with or otherwise disturb the sampled organism.
- Before and during the sampling double-check the location of both tubes.
- After the sampling check whether the specimen is still pumping as described above (2.2.1).
NOTE: Because the movement of one arm of the tripod when manipulating the other might occur, make sure to firstly place the inhalant sampling tube and secondly the exhalant tube, which requires more precise manipulation. Following this order, even if the manipulation of the exhalant sampling tube might cause the movement of the inhalant tube, it will not affect the sampling.
- Modular underwater sampling procedure
NOTE: Pending on the research question, each of the experimental steps below can be performed as a stand-alone experiment. The full metabolic profile sampling protocol described below is a lengthy process, requiring up to 8 hours per specimen (for an overview see Figure 2 and Table 2). As diving conditions and regulations differ between sampling sites, regions, and institutions, diving plans are not included in this protocol. Nevertheless, devote extreme care and meticulous planning to the diving plan. Pay special care to avoid saturation and yoyo dive profiles. When possible, it is advisable to conduct these experiments at shallow depth (< 10 m). Closed circuit rebreathers can be very handy for such prolonged sampling schemes.- Before actual sampling begins, make sure no visible traces of fluorescein residue remain and that suspended sediments have been settled or have wafted away.
- Ultra-plankton, (no filter is installed in this step!)
- Use the needle to pierce the IN (inhaled) and EX (exhaled) vacuumed sterile plastic tubes septa. Verify that water is dripping in at the planned rate and collect 2-6 ml water samples.
- On retrieval, keep samples in a cold box on ice. In the lab, preserve with 1% paraformaldehyde + 0.05% EM grade glutaraldehyde (final concentration), or 0.2% EM grade glutaraldehyde. Freeze cryovials in liquid nitrogen and store at -80 °C until analysis.
- Silicate sampling and storing
- Install the pre-cleaned in-line stainless PC filter holder containing a 0.2 µm polycarbonate membrane between the needle and the Luer male connector at the distal end of the tube.
- Pierce the septum cap of the pre-cleaned high-density polyethylene vials (HDPE vials) to start sampling. Verify that both samplers are dripping and collect 15 ml of water in each vial.
- Keep the samples refrigerated (4 °C) until analysis. If analysis cannot begin within two weeks, store at -20 °C. For analysis, make sure that the samples are thawed at 50 °C for at least 50 min to dissolve silica gels.
NOTE: The membrane can be preserved for microscopy or DNA analysis as needed.
- Dissolved inorganics (PO43-, NOx-, NH4+)
- Replace the PC filter assembly with a pre-cleaned in-line stainless steel filter holder that contains a pre-combusted glass filter.
- Before sampling, ensure that at least 20 ml of seawater samples were passed through the entire filtration system by using EPA, HDPE vials or other vacuum vessel to start the suction. Measure the volume of the collected water before they are discarded.
- Pierce the septum cap of the appropriate EPA glass vials to start sampling, verify that both samplers are dripping, and collect 25-30 ml for nitrate and phosphate analysis.
- Switch to new EPA glass vials for ammonia analysis, verify that both samplers are dripping, and collect 20 ml in each vial.
- Keep the samples in a cold box on ice and store at -20 °C until the analysis.
NOTE: If only the filtrate is of interest, disposable syringe filters can be used for steps 2.3.3 and 2.3.4.
- Dissolved organics (DOC+DON) sampling and storing
NOTE: Keep the samples as upright as possible throughout handling so that sample water does not come in contact with the silicon septa.- Continue using the stainless steel filter assembly and collect 20 ml of seawater samples into new EPA glass vials, as described above.
- Upon retrieval, keep the samples in a cold box on ice. In the lab, use a pre-combusted glass Pasteur pipette to fix the samples with orthophosphoric acid (add 5-6 drops of 25% trace metal grade acid into a 20 ml sample, final concentration 0.04%) or hydrochloric acid (add 2 drops of trace metal grade concentrated acid into a 20 ml sample, final concentration 0.1%) and keep refrigerated.
- Keep the samples refrigerated (4 °C) until analysis. If samples are not analyzed within a week of collection, store at -20 °C until the analysis.
- Particulate organic matter (POC, PON, POP)
- Continue using the stainless steel filter assembly and filter at least 500 ml of seawater into an evacuated 250 ml vacuum flask. Replace flasks if necessary.
- On retrieval, use an air-filled syringe to evacuate all remaining seawater from the filter holder, wrap it in aluminum foil, and store in a cold box on ice. In the lab, remove the filters from the filter holders and store at -20 °C until the analysis.
- Before actual sampling begins, make sure no visible traces of fluorescein residue remain and that suspended sediments have been settled or have wafted away.
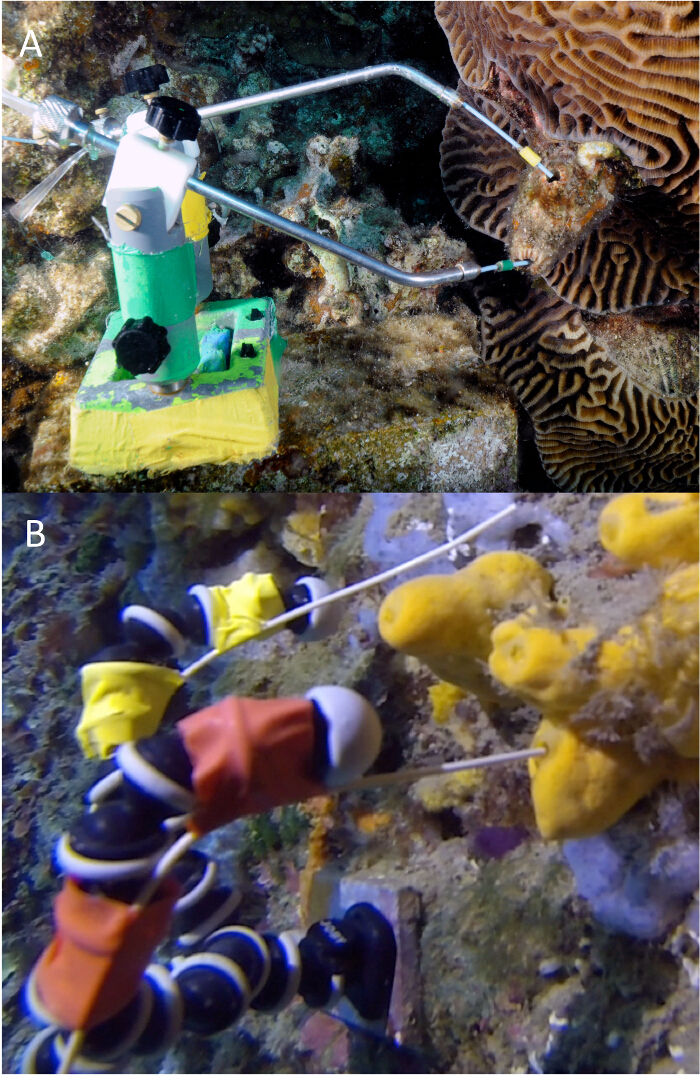
Figure 1. An example of correct installations of the VacuSIP: (A) sampling the ascidian Polycarpa mytiligera (Gulf of Aqaba, Red Sea) using a custom-built manipulator with the color code used green for inhaled and yellow for exhaled water samples (photo by Tom Shelizenger and Yuval Yacobi); (B) sampling the sponge Agelas oroides (NW Mediterranean Sea) with an osculum width of 3 mm, using the VacuSIP device. The color code used is yellow for inhaled and red for exhaled water samples. Please click here to view a larger version of this figure.

Figure 2. Overview of the VacuSIP technique described in the protocol section. The lab work is represented in yellow boxes, the fieldwork in blue boxes. Please click here to view a larger version of this figure.
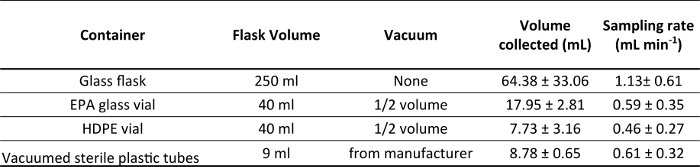
Table 1. The overall average sampling rates (ml min -1) obtained with different containers used for water collections and different vacuum levels: the flasks were not vacuumed (none); EPA glass vials and HDPE vials were vacuumed half of their volume (½ volume); sterile plastic tubes were already vacuumed by the manufacturer. Working at 5-8 m depth, water temperature of 18-22 °C, using PEEK tubes of 79 cm length and of 25 µm internal diameter.
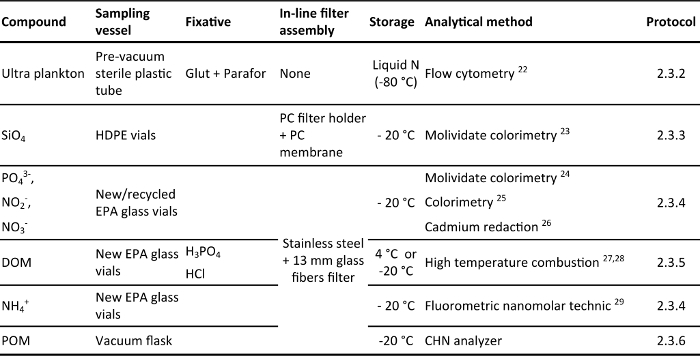
Table 2. Overview of the sampling vessel, fixative, in-line filter assembly, storage and analytical methods described in the protocol section. The analyzed compounds are: ultra-plankton abundance (plankton < 10 µm), silicate (SiO4), phosphate (PO43-), nitrite + nitrate (NO2- + NO3-), dissolved organic matter (DOM), ammonium (NH4+) and particulate organic matter (POM). All the sampling vessels have silicon septum cap and are vacuumed before sampling. The fixatives are: paraformaldehyde + glutaraldehyde (Glut + Parafor), orthophosphoric acid (H3PO4) and hydrochloric acid (HCl). The in-line filter assemblies used are: polycarbonate filter holders and polycarbonate membrane 0.2 µm filters (PC filter holder + PC membrane) and stainless steel filter holders and binder-free glass fiber filters GFF.
Access restricted. Please log in or start a trial to view this content.
Results
Optimization of seawater collection methods
Selection of collector vials and cleaning procedure
VacuSIP-compatible collecting vessels should have a septum that allows sampling to be initiated by piercing with a syringe needle. They should withstand the elevated underwater pressure (2-3 bars at typical scuba working depths), an...
Access restricted. Please log in or start a trial to view this content.
Discussion
Preparatory steps
Collector vials for DOM and nutrient analysis
Since collector vessels may interact with dissolved micro-constituents and the sampler walls may be a substrate for bacteria growth 30-34, different vials for DOM and nutrient collection were tested. Borosilicate is not recommended for silica quantification 33,35, since glass bottles can increase the initial concentration of silica by up t...
Access restricted. Please log in or start a trial to view this content.
Disclosures
The authors have nothing to disclose.
Acknowledgements
We thank Manel Bolivar for his assistance in the fieldwork. We are grateful to the "Parc Natural del Montgrì, les Illes Medes i el Baix Ter" for their support to our research and sampling permissions. The underwater manipulator was designed by Ayelet Dadon-Pilosof and fabricated by Mr. Pilosof. This work was supported by the Spanish Government project CSI-Coral [grant number CGL2013-43106-R to RC and MR] and by a F.P.U fellowship from "Ministerio de Educaciòn, Cultura y Deporte (MECD)" to TM. This is a contribution from the Marine Biogeochemistry and Global Change research group funded by the Catalan Government [grant number 2014SGR1029] and ISF grant 1280/13 and BSF grant 2012089 to G. Yahel.
Access restricted. Please log in or start a trial to view this content.
Materials
| Name | Company | Catalog Number | Comments |
|---|---|---|---|
| GorillaPod, Original | Joby | GP000001 | flexible portable tripod |
| Flangeless Ferrule | IDEX Health & Science | P-200X | 1/16" in Blue/pk |
| Male Nut | IDEX Health & Science | P-205X | 1/16" in Green/10 pk |
| Female to Female Luer | IDEX Health & Science | P-658 | |
| Female-Male Luer | IDEX Health & Science | P-655 | |
| Peek Tubing (254 µm ID) | IDEX Health & Science | 1531 | 1/16" OD x 0.01 in ID x 5 ft length. Alternative ID can be used. |
| Two component resin epoxy | IVEGOR | 9257 | Mix well the two component resin before use |
| (TOC) EPA Vials | Cole -Parmer | 03756-20 | 40 ml glass vials. Manufactured also by Thomas Scientific (ref. number 9711F09). |
| HDPE Vials | Wheaton | 986701 (E78620) | 20 ml high-density polyethylene vials |
| Vacuette Z no additive | Greiner bio-one | 455001 | pre-vacuum by the manufacturer |
| Septum Sample Bottles | Thomas Scientific | 1755C01 | 250 ml glass bottles |
| Septum Cap 1 | Wheaton | W240844SP (E7865R) | 22-400 for HDPE vials |
| Septum Cap 2 | Wheaton | W240846 (1078-5553) | 24-400 for glass vials and bottles. Also manufactured by Thermo Scientific National (ref. 03-377-42). |
| In-line stainless steel Swinney Filter holders | Pall | 516-9067 | 13 mm of diameter |
| PTFE Seal Washer | Pall | 516-8064 | ring for stainless steel filter holders |
| TCLP Glass Filters | Pall | 516-9126 | binder-free glass fiber filters, 13 mm of diameter, pore size 0.7 µm |
| Polycarbonate Filter Holders | Cole -Parmer | 17295 | 13 mm of diameter |
| Isopore Membrane Filters | Millipore | GTTP01300 | 13 mm of diameter, pore size 0.2 µm |
| Contrad 70 Solution | Decon Labs | 1002 | highly soluble basic mix of anionic and non-ionic surfactant solution |
| Sterile Syringe Filters | VWR International Eurolab S.L. | 514-0061P | 25 mm of diameter , pore size 0.2 µm |
| Fluorescein | Sigma-Aldrich | (old ref.28802) 46955-100G | 100 g |
| Holdex, disposable,sterile | Greiner bio-one | 450263 | sterile, single-use tube holder with off-center luer for Vacuette |
| Sterile Needles | IcoGammaPlus | 5160 | 0.7 mm x 30 mm |
| Cryovials Nalgene | Nalgene | V5007(Cat. No.5000-0020) | 2 ml |
| Cryobox carton | Rubilabor | M-600 | 145x145x55 mm p/microtube 1.5 ml |
| Orthophosphoric Acid | Sigma | 79617 or Alternatively use Ultra-Pure Hydrochloric acid, final concertation 0.1% | |
| Paraformaldehyde | Sigma | P6148 | 500 g |
| Glutaraldehyde | Merck | 8,206,031,000 | 25%, 1 L |
| Hand Vacuum Pump | Bürkle | 5620-2181 or Alternatively use standard laboratory vacuum pump |
References
- Gili, J. M., Coma, R. Benthic suspension feeders: their paramount role in littoral marine food webs. Trends. Ecol. Evol. 13 (8), 316-321 (1998).
- Reiswig, H. In situ pumping activities of tropical Demospongiae. Mar. Bio. 9, 38-50 (1971).
- McMurray, S., Pawlik, J., Finelli, C. Trait-mediated ecosystem impacts: how morphology and size affect pumping rates of the Caribbean giant barrel sponge. Aquat. Bio. 23 (1), 1-13 (2014).
- Pile, A. J., Young, C. M. The natural diet of a hexactinellid sponge: benthic-pelagic coupling in a deep-sea microbial food web. Deep-Sea Res. Pt. I. 53 (7), 1148-1156 (2006).
- Nielsen, T., Maar, M. Effects of a blue mussel Mytilus edulis bed on vertical distribution and composition of the pelagic food web. Mar. Ecol. Prog. Ser. 339, 185-198 (2007).
- De Goeij, J. M., et al. Surviving in a marine desert: the sponge loop retains resources within coral reefs. Science. 342, 108-110 (2013).
- Maldonado, M., Ribes, M., van Duyl, F. C. Nutrient Fluxes Through Sponges. Biology, Budgets, and Ecological Implications. Advances in Marine Biology. 62, (2012).
- Riisgård, H. U. On measurement of filtration rates in bivalves - the stony road to reliable data: review and interpretation. Mar. Ecol. Prog. Ser. 211, 275-291 (2001).
- Reiswig, H. M. Water transport, respiration and energetics of three tropical marine sponges. J. Exp. Mar. Biol. Ecol. 14, 231-249 (1974).
- Jiménez, E., Ribes, M. Sponges as a source of dissolved inorganic nitrogen: nitrification mediated by temperate sponges. Limnol. Oceanogr. 52 (3), 948-958 (2007).
- Diaz, M. C., Ward, B. Sponge-mediated nitrification in tropical benthic communities. Mar. Ecol. Prog. Ser. 156, 97-107 (1997).
- Ribes, M., Coma, R., Gili, J. Natural diet and grazing rate of the temperate sponge Dysidea avara (Demospongiae, Dendroceratida) throughout an annual cycle. Mar. Ecol. Prog. Ser. 176, 179-190 (1999).
- Jiménez, E. Nutrient fluxes in marine sponges: methodology, geographical variability and the role of associated microorganisms. , Universitat Politècnica de Catalunya. Barcelona. PhD thesis (2011).
- Reiswig, H. M. Particle feeding in natural populations of three marine demosponges. Biol. Bull. 141 (3), 568-591 (1971).
- Reiswig, H. M. In situ pumping activities of tropical Demospongiae. Mar. Biol. 9 (1), 38-50 (1971).
- Yahel, G., Marie, D., Genin, A. InEx - a direct in situ method to measure filtration rates, nutrition, and metabolism of active suspension feeders. Limnol. Oceanogr-meth. 3, 46-58 (2005).
- Genin, A., Monismith, S. S. G., Reidenbach, M. A., Yahel, G., Koseff, J. R. Intense benthic grazing of phytoplankton in a coral reef. Limnol. Oceanogr. 54 (2), 938-951 (2009).
- Yahel, G., Whitney, F., Reiswig, H. M., Leys, S. P. In situ feeding and metabolism of glass sponges (Hexactinellida , Porifera) studied in a deep temperate fjord with a remotely operated submersible. Limnol. Oceanogr. 52 (1), 428-440 (2007).
- Wright, S. H., Stephens, G. C. Removal of amino acid during a single passage of water across the gill of marine mussels. J. Exp. Zool. 205, 337-352 (1978).
- Møhlenberg, F., Riisgård, H. U. Efficiency of particle retention in 13 species of suspension feeding bivalves. Ophelia. 17 (2), 239-246 (1978).
- Mueller, B., et al. Natural diet of coral-excavating sponges consists mainly of dissolved organic carbon (DOC). PLoS ONE. 9 (2), e90152(2014).
- Gasol, J. M., Moran, X. A. G. Effects of filtration on bacterial activity and picoplankton community structure as assessed by flow cytometry. Aquat. Microb. Ecol. 16 (3), 251-264 (1999).
- Koroleff, F. Determination of reactive silicate. New Baltic Manual, Cooperative Research Report Series A. 29, 87-90 (1972).
- Murphy, J., Riley, J. P. A. Modified single solution method for the determination of phosphate in in natural waters. Anal. Chim. Acta. 27, 31-36 (1962).
- Shin, M. B. Colorimetric method for determination of nitrite. Ind.Eng.Chem. 13 (1), 33-35 (1941).
- Wood, E. D., Armstrong, F. A. J., Richards, F. A. Determination of nitrate in sea water by cadmium-copper reduction to nitrite. J. Mar. Biol. Assoc. U. K. 47 (1), 23-31 (1967).
- Sharp, J. H., et al. A preliminary methods comparison for measurement of dissolved organic nitrogen in seawater. Mar. Chem. 78 (4), 171-184 (2002).
- Sharp, J. H. Marine dissolved organic carbon: Are the older values correct. Mar. Chem. 56 (3-4), 265-277 (1997).
- Holmes, R. M., Aminot, A., Kerouel, R., Hooker, B. A., Peterson, B. J. A simple and precise method for measuring ammonium in marine and freshwater ecosystems. Can. J. Fish. Aquat. Sci. 56 (10), 1801-1808 (1999).
- Degobbis, D. On the storage of seawater samples for ammonia determination. Limnol. Oceanogr. 18 (1), 146-150 (1973).
- Tupas, L. M., Popp, B. N., Karl, D. M. Dissolved organic carbon in oligotrophic waters: experiments on sample preservation, storage and analysis. Mar. Chem. 45, 207-216 (1994).
- Yoro, S. C., Panagiotopoulos, C., Sempéré, R. Dissolved organic carbon contamination induced by filters and storage bottles. Water Res. 33 (8), 1956-1959 (1999).
- Zhang, J. Z., Fischer, C. J., Ortner, P. B. Laboratory glassware as a contaminant in silicate analysis of natural water samples. Water Res. 33 (12), 2879-2883 (1999).
- Yoshimura, T. Appropriate bottles for storing seawater samples for dissolved organic phosphorus (DOP) analysis: a step toward the development of DOP reference materials. Limnol. Oceanogr-meth. 11 (4), 239-246 (2013).
- Strickland, J. D. H., Parsons, T. R. A practical handbook of seawater analysis. , Fisheries Research Board of Canada. Ottawa. (1968).
- Eaton, A. D., Grant, V. Freshwater sorption of ammonium by glass frits and filters: implications for analyses of brackish and freshwater. Limnol. Oceanogr. 24 (2), 397-399 (1979).
- Norrman, B. Filtration of water samples for DOC studies. Mar. Chem. 41 (1-3), 239-242 (1993).
- Carlson, C. A., Ducklow, H. W. Growth of bacterioplankton and consumption of dissolved organic carbon in the Sargasso Sea. Aquat. Microb. Ecol. 10 (1), 69-85 (1996).
- Grasshoff, K., Ehrhardt, M., Kremling, K. Methods of Seawater Analysis. Second, Revised and Extended Edition. , (1999).
- Perea-Blázquez, A., Davy, S. K., Bell, J. J. Nutrient utilisation by shallow water temperate sponges in New Zealand. Hydrobiologia. 687 (1), 237-250 (2012).
- Perea-Blázquez, A., Davy, S. K., Bell, J. J. Estimates of particulate organic carbon flowing from the pelagic environment to the benthos through sponge assemblages. PLoS ONE. 7 (1), e29569(2012).
- Pile, A. J., Patterson, M. R., Witman, J. D. In situ grazing on plankton <10 µm by the boreal sponge Mycale lingua. Mar. Ecol. Prog. Ser. 141, 95-102 (1996).
Access restricted. Please log in or start a trial to view this content.
Reprints and Permissions
