An excellent chemical and luminescence stabilities of (oxy)nitride phosphors present it as an promising alternative to currently used sulfide and oxide phosphors. In this paper, we present the way to investigate its local luminescence properties using low-energy cathodoluminescence (CL).
Method Article
Low-energy Cathodoluminescence for (Oxy)Nitride Phosphors
In This Article
Summary
Abstract
Nitride and oxynitride (Sialon) phosphors are good candidates for the ultraviolet and visible emission applications. High performance, good stability and flexibility of their emission properties can be achieved by controlling their composition and dopants. However, a lot of work is still required to improve their properties and to reduce the production cost. A possible approach is to correlate the luminescence properties of the Sialon particles with their local structural and chemical environment in order to optimize their growth parameters and find novel phosphors. For such a purpose, the low-voltage cathodoluminescence (CL) microscopy is a powerful technique. The use of electron as an excitation source allows detecting most of the luminescence centers, revealing their luminescence distribution spatially and in depth, directly comparing CL results with the other electron-based techniques, and investigating the stability of their luminescence properties under stress. Such advantages for phosphors characterization will be highlighted through examples of investigation on several Sialon phosphors by low-energy CL.
Introduction
Recently, more and more attention is devoted to environmental issues, especially energy production and consumption. To answer these society needs, energy production must be "greener" that means, reducing the energy consumption from traditional sources or developing new environmental-friendly materials. Light emitting diodes (LEDs) and field emission displays (FEDs) have got significant attention due to their compactness, improved performance and lower power consumption compared to the actual displays, such as mercury gas-discharge fluorescent lighting or plasma displays1-5. The key factor for light source of LED and FED is a high-efficient phosphor. Rare-earth doped phosphors are inorganic materials consisting of a host lattice and rare-earth dopants, which can emit light under excitation of photons (ultraviolet (UV), blue light), electrons (electron-beam) or electric field. The requirements for the high-efficient phosphors are: 1) high conversion efficiency with the different excitation sources; 2) good stability with low thermal quenching; 3) high color purity with full color-reproducibility. However, only a very limited number of phosphors can presently meet these minimum requirements. Currently used oxide-based phosphors have low absorption in the visible-light spectrum, while sulfide-based ones have low chemical and thermal stabilities. Moreover, they show degradation under electrons or ambient atmosphere, which limits the device lifetime. Since their color purity and efficiency are limited, it makes them difficult to be used for the realization of high color rendering index (CRI) luminescent devices. Consequently, the exploration of new phosphors is required.
Rare-earth doped nitride and oxynitride (Sialon) phosphors are considered as good candidates with outstanding thermal and chemical stability based on their stable chemical bonding structures. Stokes shift becomes smaller in a strong lattice and it leads to a high conversion efficiency and a small thermal quenching of phosphors6-9. In general, the luminescence of divalent rare-earth ions, such as Eu2+ or Yb2+, and Ce3+ is attributed to 5d-4f electronic transitions, and consists of a broad band with peak position varying with the host lattice due to the strong interaction between 5d orbitals and the crystal field. Due to their properties, wavelength-tunable luminescence is obtained by changing the chemical nature of rare-earth ions and their concentration in the host lattice (Fig. 1). Thus, Sialon phosphors can be used for realizing high CRI white-LED using blue-green-red phosphors system and applications in UV-FEDs.
Although Sialon phosphors are promising materials, a lot of work such as finding novel structures and reducing the productions cost are still required. Moreover, due to the difficulties in terms of optimization of sintering conditions, Sialon phosphors often contain secondary phases18-20. Investigation of such localized structures is important to understand the sintering mechanism and optimize the sintering conditions, and so to improve the optical properties of Sialon phosphors. These objectives can be achieved by low-energy cathodoluminescence (CL) technique.
CL is a phenomenon in which electrons irradiating on a luminescent material cause the emission of photons. Contrary to photoluminescence (PL), which is induced by photon excitation, the excitation area is usually in the order of millimeter and selective excitations enhance particular emission processes, electron-beam excites in the nanometer scale and activates all the luminescence mechanisms present in the material, which may allow the detection of different phases with different luminescence properties10-12. Additionally, the incident electrons can generate not only the CL signal but also various signals, such as reflected electron, Auger or X-ray, which provide different information on the materials. Thus, the structural, chemical or electrical properties can also be obtained. The combination of these techniques with CL results in a better understanding of the origin of the localized structures of Sialon phosphors14-20.
CL investigations can be performed by means of different types of electron-beam sources13. Nowadays, scanning electron microscope (SEM) is the most common system to perform CL measurements. In the following, we are going to discuss mainly this system. As seen in Fig. 2, CL measurements are performed by using an electron source (SEM), a light collector (optical fiber and monochromator) and a detection system. Detection system consists of a charge-coupled device (CCD) and a photomultiplier tube (PMT), which are for parallel-detection mode and serial-detection mode, respectively. In general, the collected light from the sample is adjusted by slit and then dispersed by monochromator grating. When the collected light of the sample is dispersed onto the CCD (parallel-detection mode), each emission wavelength is simultaneously detected. When a specific wavelength of the dispersed light is selected by a slit (serial-detection mode), its intensity is recorded by the PMT to form monochromatic images.
In this paper, we mainly highlight the use of a low energy CL for the characterization of the Sialon phosphors, representatively, Si-doped AlN14, 22, Ca-doped (La,Ce)Al(Si6-zAlz)(N10-zOz) (z~1) (JEM)15, Si/Eu-doped AlN16, 17 and Ce-doped La5Si3O12N materials. Cross sectional polishing method using an argon ion beam (CP method) is an useful method to observe layered structures, due to its wider polishing area with less surface damage. It has been performed for an investigation of a local structure of the phosphors. The correlation of CL with other electron-based techniques and the investigation of luminescence stability will be also illustrated.
Protocol
1. Samples
- Phosphor synthesis
- Design the product, determine the starting materials and their weights based on the expected chemical reactions. Precisely weight the raw starting powders14-20.
- Crush and mix them in an agate mortar by hand. Depending on the quality of the raw powders, mix for 15-30 min in order to get a mix as homogenous as possible. Pack the powder mixture into a boron nitride crucible.
NOTE: Carry out steps 1.1.1-1.1.2 in a glove box under inert gas, with very low oxygen concentration as the final product or the raw powders are unstable in the air. - Fire the powder mixture in a gas-pressure sintering furnace with a graphite heater. Heat the samples at a constant heating rate. Introduce into the chamber the pre-determined nitrogen gas (99.999% purity), and simultaneously raise up the temperature to the desired value.
NOTE: Keep the same conditions for the duration of the sintering. Heating temperature and duration are different depending on the materials14-20. - After firing, shut off the power, and let the samples cool down inside the furnace. Crush well the sintered powders in an agate mortar by hand until getting fine particles.
- Cross-section
- Mix 150 mg of phosphors with 300 mg of resin and 30 mg of hardener. Pour into a silicone mold and bake at 60 °C for 30 min in vacuum for evaporating oxygen from the mixture.
- Put into a silicon mold and baked again at 100 °C for 60 min in air to fabricate a powder embedded chip. During heating, most of powders are deposited at the bottom due to high material density.
- Polish the facet of underside of the chip by means of handy-lap and Ar-ion cross-section polisher in order to produce a mirror surface. Higher the amount of molded powders allows better observation of the inner structure of powders.
2. Cathodoluminescence
- Sample and set-up preparation
NOTE: As CL is a contactless technique, there are no particular requirements for the measurement itself. The preparation will depend on the measurement objectives. Thus, for quantitative measurements, it may be preferred to put a large amount of powders on carbon tape, or made a film. For qualitative measurements, investigation of isolated particles may be favored by putting a small amount of powder on a carbon tape, or dispersing the powder in ethanol and immerging one conventional copper micro grid for TEM in the solution.- Adjust the height of the sample stage to align the top of the sample with the reference stage (12 mm).
- Insert the sample stage into the chamber. Insert the ellipsoidal mirror between the electron gun and the samples. Make sure that the samples are not touching the ellipsoidal mirror to prevent contaminating the mirror or breaking it.
- Fill the cooling reservoir of the detectors with liquid N2. Turn on the detector. Wait until the detectors temperature stables to start CL measurements. The ideal temperature for measurement is 110 K. NOTE: Temperature can be checked on the software.
- CL measurements
NOTE: The electron beam conditions, in particular the electron beam energy and the beam current, are selected. These conditions should be chosen in function of the expected luminescence intensity of the samples, the observed charging, the luminescence degradation and the interests in the depth analysis.- Position the electron-beam where you want to take SEM and/or CL spectrum. Focus the image in order to bring out the defined shape and correct astigmatism to get a clear and sharp image. Adjust stage height and working distance. Correct the astigmatism by using x, y stigmators on the magnified image. Start the software for CL acquisition.
- Optimize the mirror position and the sample height to get the strongest intensity for the CL spectra. To perform it, click on the "real time measurement" and select "continuous mode" on the software. Set the mirror in the monochromator as "front side" to send the dispersed light to the CCD and take the quick CL spectra. Slowly change the mirror position and the sample height while keeping the SE image focused and increasing the CL intensity.
- For CL spectra of a large area, click on the "real-time measurement" icon and select "one-shot mode" on the software. Configure the light detection system in order to send the emitted light to the CCD. Depending on the sample, choose the grating, slit width and measurement collection time in order to get the most appropriate intensity/spectral resolution.
- For CL monochromatic imaging, click on the "picture measurement" icon and select the "PMT detector" on the software. Set the mirror in the monochromator as "back side" to send the dispersed light to the PMT detector, and insert a slit. Depending on the sample, choose the resolution, magnification, desirable collection wavelength and time. Freeze the image and send it to the software.
- For local CL analysis, take SE or CL image first. Click on the "measurement" icon, select the position to take spectra on the image. Configure the light detection system in order to send the emitted light to the CCD, and then take CL spectra.
- For CL time evolution, click on the "time dependence measurement" icon and select the "CCD" on the software. Configure the light detection system in order to send the emitted light to the CCD detector. Depending on the software, select the numbers of spectra and the time between 2 measurements, for example 360 spectra every 10 sec.
Results
The luminescence is distributed not only laterally but also in-depth. Such core-surface distribution is observable with CL by changing the electron energy, since it varies the penetration depth of the incident electrons21. However, the penetration depth varies for each material and the correspondence between electron energy and penetration depth is not linear, and may introduce some additional effects, such as the reabsorption of higher energy photon from the deeper regions by the material itself. Thus, it may be preferable to observe directly the core-surface distribution via cross-section observation. In case of phosphor powders, such observation can be achieved by trapping the particles into a resin and polish the powder-resin composite by cross-section polisher, for instance. Since the particles are randomly distributed in the resin, the cutting direction is not controllable. However, the high amount of particles allows cutting enough particles to make such an analysis valid.
To illustrate this point, we have investigated the luminescence distribution of Si-doped AlN powder. Figure 5a shows the CL spectra of AlN powders doped with 0.0% and 1.6% of Si. The emission of undoped AlN consists of 2 bands at 350 and 380 nm, while that of AlN doped with 1.6% of a band at 350 nm with a clear shoulder at 280 nm. The 350 and 380 nm bands are attributed to Al vacancy-oxygen complexes (ON-VAl), while the shoulder at 280 nm with the O-purified AlN affected by Si to form SiO vapor22. Figure 5b and 5c show the CL images taken at 280 nm for as-sintered and cross-sectioned AlN powders doped with 1.6% of Si, respectively. The 280 nm emission is nonuniform along the particles from the CL image of the as-sintered sample, the brighter areas seem to be at the edges of the particles, but the morphologies of the particles and their distribution may make such observations not so obvious. However, from the CL image of the cross-sectioned sample, it appears clearly that the 280 nm emission is mainly localized at the surfaces of the particles, suggesting that AlN particles are actually coated by a Si-rich layer and surface purification may proceed.
Local composition changes in Sialon phosphors can drastically affect the luminescence properties. Thus, the same rare-earth ion in different host-lattices or in different sites may give different emissions15,18-20. But, unfortunately, local differences during the sintering, such as a distribution of the temperature or the raw materials proportion, or the partial oxidation of the surface of the particles, are expected, resulting in changes of the composition along the particles and/or in the coexistence of several phases. Such effects may not be directly observable with structural and chemical characterization techniques. Thus, it is important to investigate the local luminescence properties of a phosphor. With the precise control of the size and position of the electron-beam in a SEM, it is possible not only to acquire a CL spectrum from a nanoscale region but also to obtain high-resolution CL images of the luminescence centers.
(La,Ce)Al(Si6-zAlz)(N10-zOz) (z~1) (JEM) is an intense blue phosphor which is suitable for general lighting. It has been found that by replacing (La, Ce) by Ca, a red shift and a broadening of CL peaks occur according to Ca-doping. It was believed that Ca was affecting the crystal field splitting of Ce3+. However, this explanation, based only on the luminescence spectra, is misleading, as revealed by cross sectional local analysis.15 Figure 6 shows the cross-sectional SE (CS-SE), combined CS-CL images at 300 nm (red), 430 nm (blue) and 540 nm (green) and local CL spectra taken at 5 kV for JEM phosphors doped with 0 (a, b, c) and 0.69 (d, e, f) at. % of Ca, respectively. It has to been noted that these wavelengths were selected in order to reduce the bands overlapping in case that several bands exist. For CS-CL image of Ca-undoped sample, JEM particles consist of many particles agglomerated with each other. The luminescence at 430 nm is almost uniformly distributed with some brighter area and some of localized area at 300 nm. On the other hand, the grain boundaries show darker emission. Local CL analysis reveals that the spectral shape is relatively comparable in any positions, with a shift of the bands from 430 to 450 nm and spectral intensity in a good agreement with the pictures. For CS-CL image of Ca-doped, there are significant differences between 430 and 540 nm. Submicron patches clearly appear brighter at 300 and 540 nm along a large portion of the particles with darker grain boundary regions, while the 430 nm emission is localized in another section of the particles. By local analysis, the CL spectrum taken on a 430 nm bright area (point 3) consists a band at 440 nm, comparable at the one observed for Ca-undoped sample. The bright areas at 540 nm, embedded in the same particle, (points 1 and 4) show a band at 480-490 nm. Small bright areas at 300 nm (point 2) and dark grain boundary region (point 5) show a band at 440 nm with shoulder at 480 nm, with occasionally at emission at 310 nm. Based on the literature and XRD analysis, we can attribute the band centered at around 430 nm to Ce3+ in JEM22 and that at 480 nm to Ce3+ in α-SiAlON23. The darker broad emission is originated to Ce3+ in β-SiAlON, and that at 310 nm to Sialon host material. These results prove that the red shift and the broadening of CL peaks according to Ca doping may not be attributed to Ca-induced changes in the crystal field splitting of Ce3+ as initially thought, but more to the coexistence of different phases inside the same particles and the gradual transformation of β-SiAlON to α-SiAlON with Ca doping.
Although the observation of the different emission centers and their distribution is possible by using low-energy CL, it may not be enough to fully understand the nature of the luminescence centers. In such cases, it is necessary to combine the CL measurements with other techniques. Since the incident electrons can generate other signals beside CL, it is possible to directly correlate the light emission with electrical, chemical or structural properties by investigating the same area with the different electron-beam techniques. Thus, the correlation of CL with high-resolution TEM (HRTEM) and EBIC has been used to characterize defects, such as dislocations or stacking faults. As for the variation of concentration/composition, the combination of CL with TEM, EDS or Auger spectroscopy can result in a better understanding of the origin of the luminescence.
Here, we illustrate this aspect by investigating the emission of Si-doped AlN powder. Figure 7 shows the CS-CL and CS-EDS images (a, b) and local spectra (c, d) of AlN particle doped with 4.0% Si doping. The CS-CL image was taken at 350 nm, while the CS-EDS image consists of the superposition of Si and Al distribution. The CS-CL image shows darker elongated structure in the center of the particles. Local CL spectra taken in the bright region consist of a strong peak at 350 nm with shoulders at 280, 380, and 460 nm. However, there are clear changes in the ratios between these different bands with the position. Areas showing a brighter emission at 350 nm (point 1) shows a higher 280 nm emission and smaller 460 nm emission compared to the main band at 350 nm, while the darker elongated patch (point 2) shows a smaller 280 nm emission and higher 460 nm emission compared to the main band at 350 nm. The 460 nm is originated from Si-accommodating defects in AlN24. EDS images and local spectra reveal that the darker elongated area show a smaller Al and higher Si composition compared to the rest of the particles. Compared with the results observed in Figure 5, we can assume that by increasing the amount of Si into AlN, a secondary reaction occurs between Si and AlN, which induces the formation of SiAlON phases.
The two important parameters for a material used in devices are materials high performance and stability under stress. Indeed, a degradation of the material properties under stress will reduce its lifetime, which is not industrially viable. Thus, for electron-beam stimulated devices, such as cathode ray tubes (CRTs) and FEDs, it is necessary to develop electron-beam irradiation resistant phosphors and/or to understand the electron-beam induced mechanisms in order to prevent or reduce such effects. The luminescence degradation can occur via different mechanisms, such adsorption/desorption or charging at the surfaces, creation or activation of defects, etc.25-27. Although these intensity variations complicate the quantitative analysis of CL results, they can be used to investigate the lifetime of optoelectronic devices.
To illustrate this point, we have the CL spectra and evolutions of two blue-emitting phosphors, Ce-doped La5Si3O12N and Si/Eu-doped AlN. Figure 8a shows the CL spectra for Ce-doped La5Si3O12N and Si/Eu-doped AlN after 20 sec of irradiation at 5 kV. Both samples show an intense blue emission: the band position and intensity for Ce-doped La5Si3O12N are 456 nm and 3,270 cps, respectively, while those for Si/Eu-codoped AlN are 466 nm and 3,100 cps. A priori, the main difference between these 2 samples is the broadness of the emission, since the emission for Ce-doped La5Si3O12N is larger due to the coexistence of several bands. Thus, it seems that both materials are suitable as blue-emitting phosphors for FEDs, and that we have to consider criteria as fabrication cost, the compatibility with the other phosphors or the stability of the luminescence properties under electron-beam irradiation, to determine the most suitable. Figure 8b shows the evolutions of CL intensity of Ce-doped La5Si3O12N and Si/Eu-doped AlN during electron-beam irradiation at 5 kV. For Ce-doped La5Si3O12N, the intensity decreases from 3,270 to 450 cps in 5 min and to 95 cps in 60 min. Namely, under 3,600 sec of 5-kV irradiation, the intensity decreases more than 95% of the initial intensity. For Si/Eu-doped AlN, the intensity decreases 3,100 to 2,500 cps in 60 min, namely a decrease of 20% of this initial intensity. These results clearly show that the Si/Eu-doped AlN is much better candidate than Ce-doped La5Si3O12N is due to its higher stability.

Figure 1: Luminescence of rare-earth doped SiAlON phosphors. Pictures of different phosphors under visible (a) and ultraviolet (b) light. (c) Normalized CL spectra of Eu2+ in different host lattices. Please click here to view a larger version of this figure.
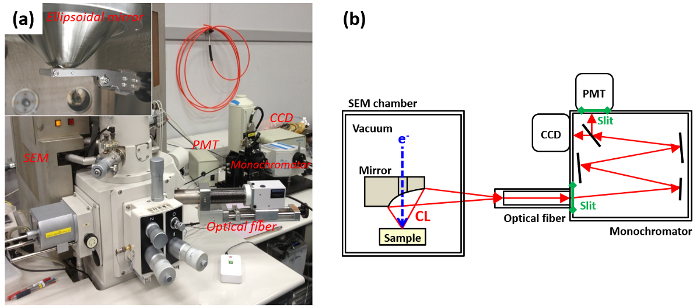
Figure 2: Setup of CL. (a) Photograph of the SEM with CL system, with inset a photograph of the ellipsoidal mirror. (b) Schematic image of light detection system. Please click here to view a larger version of this figure.

Figure 3: Preparation of SiAlON phosphors. (a) Determination of the starting powders, weight and sintering conditions; (b) Mixing of the raw powders; (c) Sintering of the powder mixture; (d) Sintered powders before and after crushing. Please click here to view a larger version of this figure.
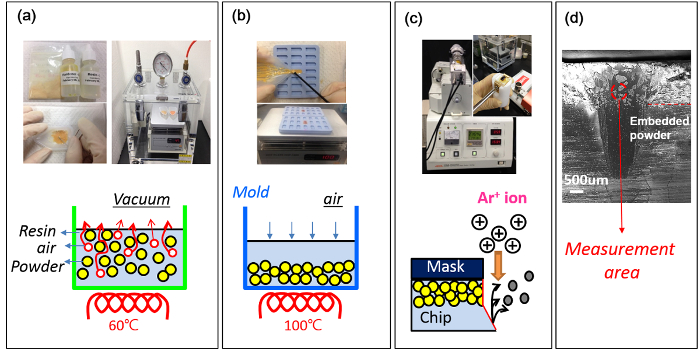
Figure 4: Cross-section preparation. (a) Mixing of the powders with resin and hardener, and evaporating air in the mixture. (b) Pouring into a silicon mold and heating. (c) Polishing of the chips by handy-lap and Ar-ion cross-section polisher. (d) Measuring cross-sectional polished area. Please click here to view a larger version of this figure.
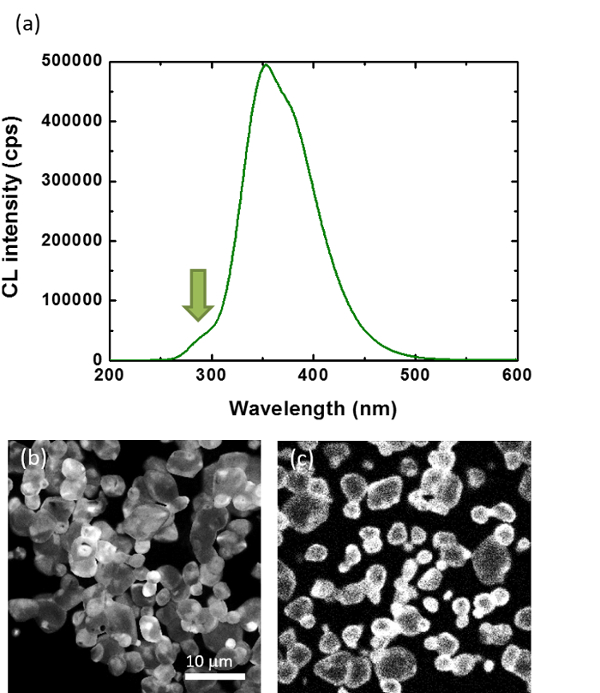
Figure 5: Core-shell distribution in Si-doped AlN. (a) CL spectra of AlN powders doped with 1.6% of Si at 5 kV. (b-c) CL images taken at 5 kV and 280 nm for as-sintered (b) and cross-sectioned (c) AlN powders doped with 1.6% of Si, respectively. Please click here to view a larger version of this figure.
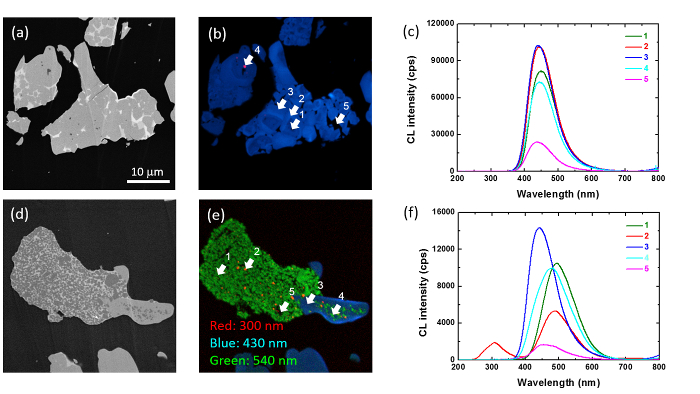
Figure 6: Local analysis of Ca-doped JEM phosphor. CS-SE, combined CS-CL images at 300 nm (red), 430 nm (blue) and 540 nm (green) and local CL spectra taken at 5 kV for JEM phosphors doped with 0 (a, b, c) and 0.69 (d, e, f) at. % of Ca, respectively. Please click here to view a larger version of this figure.
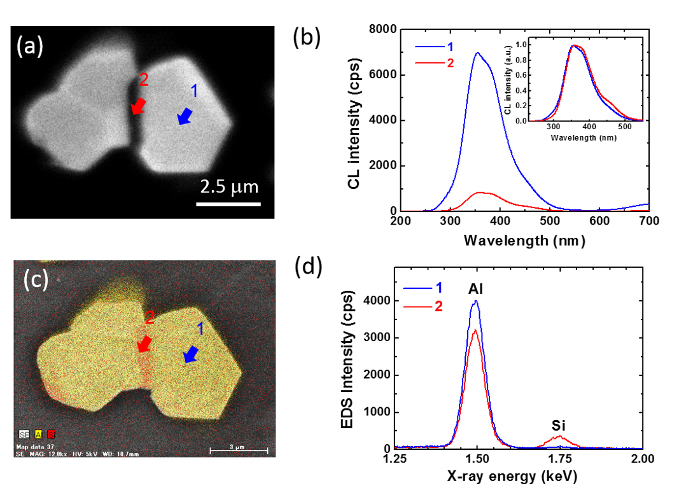
Figure 7: CL and EDS comparison of Si-doped AlN. CS-CL and CS-EDS images (a, c) and local spectra (b, d) of AlN particle doped with 4.0% Si doping. Please click here to view a larger version of this figure.

Figure 8: Luminescence stability of two blue phosphors. (a) CL spectra of Ce-doped La5Si3O12N and Si/Eu-doped AlN after 20 sec of irradiation at 5 kV. (b) Evolutions of CL intensity of Ce-doped La5Si3O12N and Si/Eu-doped AlN during electron-beam irradiation at 5 kV. Please click here to view a larger version of this figure.
Discussion
Through these representative examples of low-energy CL characterization on Sialon phosphors, we have shown how powerful and quick technique for phosphors investigation can be. By measuring the local CL measurements and mapping, taking advantage of the flexibility in the sample preparation and combining CL with other techniques, we can attribute more accurately the origins of the luminescence, clarify the growth mechanisms and determine the most suitable phosphors for applications. These results are mainly achievable due to the improvements of the electron microscopes and the light detectors, which enhance the measurement collection time, the sensitivity and the spatial resolution.
Both Sialon phosphors and CL fields are not naturally limited to the aspects presented in this paper. In the following, in order to enlarge the discussion, we are going to discuss a little bit more about them separately.
In case of Sialon phosphors, with their superior luminescence and stability properties, they are being more and more used for lighting applications. However, they also display very interesting mechanical, thermal, magnetic, superconductivity, electrical, electronic, and optical properties, which can be tuned by changing their composition. Thus, they are also found in a wide range of applications such as antireflection coatings, solar absorbers, heat mirrors, colored pigments, visible-light-driven photocatalysts, transparent windows and armors, or fluorescent probes for bio-medical imaging29. We can anticipate that they are going to play crucial roles in many energy and environment-related aspects, such as efficiently harvesting solar energy, realizing the hydrogen economy, reducing the environmental pollutions, saving the natural resources, etc. However, a lot of work is still required to continue improving their properties while reducing their production cost, such as decreasing the sintering temperature or limiting the use of rare-earth ions. It can be achieved by finding novel Sialon phosphors, and clarifying the role of the composition and growth conditions on the properties. We have seen that CL can play an important role to achieve these objectives. But, recent new approaches have also revealed very promising possibilities. Two of these approaches are time-of-flight secondary ion mass spectrometry (TOF-SIMS) and single-particle diagnosis. TOF-SIMS is able to spatially resolve the entire mass spectrum with high-sensitivity, which enables not only the detection of species at trace-level but also the differences in oxidation state31. The single-particle diagnosis consists in the treatment of an individual luminescent particle in a complex mixture as a tiny single crystal, and to investigate the optical and structural properties by means of super-resolution single-crystal X-ray diffraction and single-particle fluorescence31.
As for low-energy CL characterization, in this paper, we have mainly concentrated on the use of CL for Sialon phosphors, while CL can also be used for other materials, such as semiconductors, nanostructures, organic materials, and ceramics. On the other hand, although CL is an invaluable technique for qualitative characterization of optoelectronic materials, it also induces some cautions for quantitative measurements. Indeed, CL results depend not only on the excitation conditions, beam current and electron energy, but also on the amount of investigated materials25. Thus, a small variation of these parameters may significantly change the CL intensity. In addition, electron-beam irradiation may increase the possibility to damage the samples. It may induce a drastic change in the intensity, or induce the creation/activation of new luminescence centers, which may affect the reliability of quantitative CL measurements. The development of CL in materials characterization was and will be strongly related to the improvements in the electron-beam microscopes and the light detectors. Thus, it is now possible to perform TEM. It allows a higher spatial resolution and a direct observation of the luminescence change in-situ observation of luminescence change accompanied with microstructure change caused by electron-beam induced atomic displacement, for instance32-34. Moreover, with the addition of an in-column beam blanker synchronized with the optical detector, it is now available to use electron-beam in pulse mode, which allows performing decay profile measurements into an electron microscope35. It may be also thought that the use of pulsed electron-beam irradiation may reduce the electron-beam induced damages, which will improve the reliability of quantitative measurements and help in the characterization of electron-beam sensitive materials. These 2 examples illustrate how CL analysis may improve in the future.
Disclosures
The authors have nothing to disclose.
Acknowledgements
This work was supported in part by Green Network of Excellence (GRENE) project from the Ministry of Education, Culture, Sport, and Technology (MEXT) in Japan. The authors are also grateful to the technicians of the Sialon Unit for their help in the phosphors synthesis, to MANA for its help in EDS measurements and to K. Nakagawa for the help in the CL system.
Materials
| Name | Company | Catalog Number | Comments |
|---|---|---|---|
| SEM | Hitachi | S4300 | |
| Triple-grating monochromator | Horiba Jobin-Yvon | Triax 320 | |
| Photomultiplier | Hamamatsu | R943-02 | |
| Charge-coupled device with 2048 channels | Horiba Jobin-Yvon | Spectrum One | |
| Gas-pressure sintering furnace with a graphite heater | Fujidempa Kogyo Co. Ltd. | FVPHR-R-10, FRET-40 | |
| Silicone mold | LADD | 21780 | |
| Ar-ion cross-section polisher | JEOL | SM-09010 | |
| EDS | BRUKER | Xflash6/100 | |
| Resins | JEOL | Part No 780028520 |
References
- Spindt, C. A., Holland, C. E., Brodie, I., Mooney, J. B., Westerberg, E. R. Field-emitter arrays applied to vacuum fluorescent display. IEEE Trans. Electron Devices. 36 (1), 225-228 (1989).
- Holloway, P. H., et al. Advances in field emission displays phosphors. J. Vac. Sci. Technol. B. 17 (2), 758-764 (1999).
- Itoh, S., Tanaka, M., Tonegawa, T. Development of field emission displays. J. Vac. Sci. Technol. 22 (3), 1362-1366 (2004).
- Schubert, E. F., Kim, J. K., Luo, H., Xi, J. Q. Solid-state lighting - a benevolent technology. Rep. Prog. Phys. 69 (12), 3069-3099 (2006).
- McKittrick, J., Shea-Rohwer, L. E. Review: Down Conversion Materials for Solid-State Lighting. J. Am. Ceram. Soc. 97 (5), 1327-1352 (2014).
- Smet, P. F., Parmentier, A. B., Poelman, D. Selecting Conversion Phosphors for White Light-Emitting Diodes. J. Electrochem. Soc. 158 (6), 37-54 (2011).
- Xie, R. J., Hirosaki, N., Sakuma, K., Kimura, N. White light-emitting diodes (LEDs) using (oxy)nitride phosphors. J. Phys. D: Appl. Phys. 41 (14), 144013(2008).
- Xie, R. J., Hirosaki, N. Silicon-based oxynitride and nitride phosphors for white LEDs - A review. Sci. Technol. Adv. Mater. 8 (7-8), 588-600 (2013).
- George, N. C., Denault, K. A., Seshadri, R. Phosphors for Solid-State White Lighting. Annu. Rev. Mater. Res. 43, 481-501 (2013).
- Gustafsson, A., Pistol, M. E., Montelius, L., Samuelson, L. Local probe techniques for luminescence studies of low-dimensional semiconductor structures. J. Appl. Phys. 84 (4), 1715-1775 (1998).
- Dierre, B., Yuan, X. L., Sekiguchi, T. Low-energy cathodoluminescence microscopy for the characterization of nanostructures. Sci. Technol. Adv. Mater. 11 (4), 043001(2010).
- García de Abajo, F. J. Optical excitations in electron microscopy. Rev. Mod. Phys. 82 (1), 208-275 (2010).
- Yacobi, B. G., Holt, D. B. Cathodoluminescence scanning electron-microscopy of semiconductors. J. Appl. Phys. 59 (4), 1-24 (1986).
- Cho, Y., et al. Influence of Si on the particle growth of AlN ceramics. Appl. Phys. Express. 7 (11), 115503(2014).
- Takahashi, T., et al. Luminescence properties of blue La1-xCexAl(Si6-zAlz)(N10-zOz) (z.~1) oxynitride phosphors and their application in white light-emitting diode. Appl. Phys. Lett. 91 (9), 091923(2007).
- Hirosaki, N., et al. Blue-emitting AlN : Eu2+ nitride phosphor for field emission displays. Appl. Phys. Lett. 91 (6), 061101(2007).
- Dierre, B., et al. Role of Si in the Luminescence of AlN :Eu,Si Phosphors. J. Am. Ceram. Soc. 92 (6), 1272-1275 (2009).
- Dierre, B., Xie, R. J., Hirosaki, N., Sekiguchi, T. Blue emission of Ce3+ in lanthanide silicon oxynitride phosphors. J. Mater. Res. 22 (7), 1933-1941 (2007).
- Dierre, B., et al. Luminescence distribution of Yb-doped Ca-alpha-SiAlON phosphors. J. Mater. Res. 23 (6), 1701-1705 (2008).
- Dierre, B., et al. Local analysis of Eu2+ emission in CaAlSiN3. Sci. Technol. Adv. Mater. 14 (6), 064201(2013).
- Brillson, L. J. Applications of depth-resolved cathodoluminescence spectroscopy. J. Phys. D: Appl. Phys. 45 (18), 183001(2012).
- Liu, L., et al. Optical Properties of Blue-Emitting CexSi6-zAlz-xOz+1.5xM8-z-x for White Light-Emitting Diodes. J. Electrochem. Soc. 157 (1), 50-54 (2010).
- Xie, R. -J., et al. Photoluminescence of Cerium-Doped a-SiAlON Materials. J. Am. Ceram. Soc. 87 (7), 1368-1370 (2004).
- Cho, Y., et al. Defects and luminescence control of AlN ceramic by Si-doping. Scripta Materialia. 110 (1), 109-112 (2016).
- Itoh, S., Kimizuka, T., Tonegawa, T. Degradation mechanism for low-voltage cathodoluminescence of sulfide phosphors. J. Electrochem. Soc. 136 (6), 1819-1823 (1989).
- Swart, H. C., et al. Review on electron stimulated surface chemical reaction mechanism for phosphor degradation. J. Vac. Sci. Technol. A. 25 (4), 917-921 (2007).
- Dierre, B., Yuan, X. L., Ueda, K., Sekiguchi, T. Hydrogen released from bulk ZnO single crystals investigated by time-of-flight electron-stimulated desorption. J. Appl. Phys. 108 (10), 104902(2010).
- Dierre, B., Yuan, X. L., Ohashi, N., Sekiguchi, T. Effects of specimen preparation on the cathodoluminescence properties of ZnO nanoparticles. J. Appl. Phys. 103 (8), 083551(2008).
- Xie, R. J., Hintzen, H. T. Optical Properties of (Oxy)Nitride Materials: A Review. J. Am. Ceram. Soc. 96 (3), 665-687 (2013).
- Swart, H. C., Nagpure, I. M., Ntwaeaborwa, O. M., Fisher, G. L., Terblans, J. J. Identification of Eu oxidation states in a doped Sr5(PO4)3F phosphor by TOF-SIMS imaging. Opt. Express. 20 (15), 17119-17125 (2012).
- Hirosaki, N., Takeda, T., Funahashi, S., Xie, R. J. Discovery of New Nitridosilicate Phosphors for Solid State Lighting by the Single-Particle-Diagnosis Approach. Chem. Mater. 26 (14), 4280-4288 (2014).
- Lim, S. K., et al. Direct Correlation between Structural and Optical Properties of III-V Nitride Nanowire Heterostructures with Nanoscale Resolution. Nano Lett. 9 (11), 3940-3944 (2009).
- Zagonel, L. F., et al. Nanometer Scale Spectral Imaging of Quantum Emitters in Nanowires and its Correlation to Their Atomically Resolved Structure. Nano Lett. 11 (2), 568-573 (2011).
- Furamoto, K., et al. Development of Novel Optical Fiber System for Cathodoluminescence Detection in High Voltage Transmission Electron Microscope. Materials Transactions. 54 (5), 854-856 (2013).
- Poelman, D., Smet, P. F. Time resolved microscopic cathodoluminescence spectroscopy for phosphor research. Physica B. 439, 35-40 (2014).
Reprints and Permissions
Request permission to reuse the text or figures of this JoVE article
Request Permission