Conventional methods to initiate suspension aggregate based cardiac differentiation of human pluripotent stems cells (hPSCs) are plagued with culture heterogeneity with respect to aggregate size and shape. Here, we describe a robust method for cardiac differentiation employing microwells to generate size-controlled hPSC aggregates cultured under cardiac-promoting conditions.
Method Article
Aggregate Size Optimization in Microwells for Suspension-based Cardiac Differentiation of Human Pluripotent Stem Cells
* These authors contributed equally
In This Article
Summary
Abstract
Cardiac differentiation of human pluripotent stems cells (hPSCs) is typically carried out in suspension cell aggregates. Conventional aggregate formation of hPSCs involves dissociating cell colonies into smaller clumps, with size control of the clumps crudely controlled by pipetting the cell suspension until the desired clump size is achieved. One of the main challenges of conventional aggregate-based cardiac differentiation of hPSCs is that culture heterogeneity and spatial disorganization lead to variable and inefficient cardiomyocyte yield. We and others have previously reported that human embryonic stem cell (hESC) aggregate size can be modulated to optimize cardiac induction efficiency. We have addressed this challenge by employing a scalable, microwell-based approach to control physical parameters of aggregate formation, specifically aggregate size and shape. The method we describe here consists of forced aggregation of defined hPSC numbers in microwells, and the subsequent culture of these aggregates in conditions that direct cardiac induction. This protocol can be readily scaled depending on the size and number of wells used. Using this method, we can consistently achieve culture outputs with cardiomyocyte frequencies greater than 70%.
Introduction
In vitro cell culture can be performed under a number of modalities, but is typically carried out either in two-dimensional adherent conditions or in three-dimensional suspension conditions that more fully recapitulate in vivo systems. Consequently there is a growing trend in many fields of research to develop robust methods for generating three-dimensional tissue constructs. In scenarios where cell types and processes require a supportive extracellular matrix (ECM) surface and adhesion signals, three-dimensional culture may be enabled via scaffolded constructs, where cells are cultured on or in an exogenous supporting matrix1. Cells and processes that do not require adhesion to a supportive matrix can be carried out in suspension as unscaffolded systems composed primarily or exclusively of cells (which may then proceed to generate their own endogenous matrices)2,3. Here, we present a protocol for cardiac differentiation of human pluripotent stem cells (hPSCs — stem cells capable of becoming any cell type in the body, whether from embryonic or other sources) in size-controlled, uniform, unscaffolded aggregates.
Differentiation of hPSCs as suspension aggregates is plagued by large variations in aggregate size both within a run and between runs. This variability is a consequence of the method typically employed to generate these aggregates, which involves mechanical dissociation of cell colonies. To reduce this variability, a number of approaches have been used to control the number of cells per aggregate as well as aggregate diameter and uniformity. Examples include formation of aggregates in microcentrifuge tubes4 or as hanging drops5, micropatterning defined two-dimensional hPSC colonies6 which can then be transferred to suspension, or centrifugation of cells into U- or V-bottom multi-well plates7,8,9. However, all these approaches are limited by their low throughput of aggregate generation. Well-based systems employ a similar approach to V-bottom plate systems, however the smaller size of the microwells (in this protocol each having a width of 400 µm) enables the generation of larger numbers of uniform aggregates from a single culture-plate well (standard diameter of ~ 15.5 mm containing ~ 1,200 microwells) than would be generated from a whole V-bottom plate10. Well-based aggregate formation has been used in a number of settings including differentiation of hPSCs to ectodermal11, endodermal12, mesodermal13 and extraembryonic14 fates; chondrogenesis from mesenchymal stem cells15; generation of uniform substrates for toxicological screening16; and investigations of mechanobiology17.
One major challenge in developing robust manufacturing protocols for the production of hPSC-derived cardiomyocytes has been the lack of reproducibility in cardiac differentiation efficiency between runs. We previously demonstrated that this variability can be attributed to heterogeneity in the starting hPSC population, which comprises both self-renewing hPSCs and differentiating cells that express genes associated with endoderm and neural differentiation6,18. Signals secreted by these differentiating cells impact cardiac induction. Specifically, extraembryonic endoderm promotes cardiac induction, while neural progenitors inhibit cardiac induction. Upon hPSC aggregation, cells within the aggregate differentiate and organize so that undifferentiated hPSCs are surrounded by a layer of extraembryonic endoderm cells that develop on the aggregate surface13. By controlling aggregate size, we can modulate the ratio of cardiac-inducing endoderm cells to undifferentiated hPSCs (surface area to volume ratio) and optimize this ratio for maximum cardiac induction13.
Protocol
1. Preparation of Medium Components
- Prepare Wash Medium. Per 100 ml of DMEM/F12, add 1 ml of 100x Penicillin/Streptomycin (Pen/Strep), 1 ml of 100x L-glutamine, and 5 ml of serum replacement.
- Prepare the chemically defined Basal Cardiac Induction Medium according to the manufacturer's instructions.
- Prepare the following stock reagents for media that will be used in this protocol.
- L-Ascorbic Acid: Prepare a stock solution of 5 mg per ml in 4 °C, sterile ultra-pure distilled water in a conical tube.
- Leave this solution on ice and vortex the tube periodically until the solute is completely dissolved. Filter-sterilize the Ascorbic Acid solution using a 0.22 μm syringe filter.
- Prepare 1 ml aliquots of the ascorbic acid solution and store these aliquots at -20 °C. Use a freshly thawed aliquot each time medium is prepared.
- On the day of medium preparation, dilute 13 μl of monothioglycerol (MTG) in 1 ml of Basal Cardiac Induction Medium. Discard unused, diluted MTG.
- Prepare 1 ml aliquots of Transferrin (30 mg/ml) to store at -20 °C. Store thawed aliquots at 4 °C for up to 3 months.
- Prepare 4 mM hydrochloric acid (HCl) containing 0.1% Bovine Serum Albumin (BSA). In a fume hood, add 30 μl of 6.0 N HCl solution to 50 ml of ultra-pure distilled water. Filter-sterilize the solution using a 0.22 μm syringe filter. Add 2 ml of 25% BSA solution to the 50 ml HCl solution.
- Prepare Phosphate Buffered Saline (PBS) containing 0.1% BSA. Add 20 μl of 25% BSA solution per ml PBS.
- Prepare Human Bone Morphogenetic Protein 4 (BMP-4) stock solution (10 ng/µl). Dissolve 10 µg lyophilized BMP-4 in 1 ml of 4 mM HCl buffer solution containing 0.1% BSA. Prepare 50 µl aliquots to store at -20 °C.
- Prepare Human Fibroblast Growth Factor 2 (bFGF) stock solution (10 ng/µl). Dissolve 10 µg lyophilized bFGF in 1 ml of Phosphate Buffered Saline (PBS) containing 0.1% BSA. Prepare 50 µl aliquots to store at -20 °C.
- Prepare Human Vascular Endothelial Growth Factor (VEGF) stock solution (5 ng/µl). Dissolve 5 µg lyophilized VEGF in 1 ml of PBS containing 0.1% BSA. Prepare 50 µl aliquots to store at -20 °C.
- Prepare Activin A stock solution (10 ng/µl). Dissolve 10 µg lyophilized Activin A in 1 ml of PBS containing 0.1% Bovine Serum Albumin (BSA). Prepare 50 µl aliquots to store at -20 °C.
- Prepare Inhibitor of Wnt Production-2 (IWP-2) stock solution (10 mM). Dissolve 2 mg IWP-2 in 429 µl Dimethyl Sulfoxide (DMSO). Prepare 10 µl aliquots to store at -80 °C.
- L-Ascorbic Acid: Prepare a stock solution of 5 mg per ml in 4 °C, sterile ultra-pure distilled water in a conical tube.
- Prepare Complete Cardiac Induction Medium. To 100 ml of Basal Cardiac Induction Medium, add 1 ml of 100x Pen/Strep, 1 ml of 100x L-glutamine, 500 µl of Transferrin, 1 ml of freshly thawed ascorbic acid, and 300 µl of MTG. Discard unused medium.
2. Preparation of the Microwell Plate
NOTE: All steps should be performed in a biological safety cabinet.
- Add 0.5 ml Rinsing Solution (kit component) to each well that will be used on the plate. To ensure that the solution contacts the entire surface inside each microwell, centrifuge the plate at 840 x g for 2 min.
- Incubate the plate for 30 to 60 min at RT.
- Aspirate the Rinsing Solution from the wells. Wash each well twice as follows: Add 1 ml of PBS to each well, centrifuge the plate at 840 x g for 2 min, and then aspirate the PBS.
3. Formation of hPSC Aggregates in the Microwell Plate
NOTE: All steps should be performed in a biological safety cabinet.
- Place Wash Medium in a 37 °C water bath.
NOTE: The volume required = 1 ml x number of wells of hPSC that will be dissociated. - Dissociate hPSCs to single cells
NOTE: These steps describe the dissociation of cells cultured on 6 well plates — the reagent volumes can be scaled proportionally for different culture formats.- Aspirate the culture medium from each hPSC culture well for dissociation. Rinse each well with 1 ml of dissociation enzyme, and then immediately aspirate the dissociation enzyme from each well.
NOTE: Residual dissociation enzyme should be sufficient to dissociate the cells. - Incubate the plate at 37 °C for 3 min.
- Add 1 ml of Wash Medium to each well and mechanically dissociate the cells from the tissue culture surface by pipetting the Wash Medium with a P1000 micropipettor over the tissue culture surface. If the dissociation appears to be incomplete and cell clumps remain, pass the suspension through a strainer at this point.
- Transfer the cell suspension to a 15 ml conical tube and store the tube in the incubator while the cell count is performed in the next step.
- Perform a cell count:
- Take a 10 µl sample of the cell suspension collected in the previous step. Add 30 µl of Trypan Blue and mix the suspension well by pipetting.
- Transfer 10 µl of Trypan Blue-stained cells to each chamber of a hemocytometer and visualize under the inverted microscope with the 10X objective. Count the cells.
- From the cell count results, calculate how many wells can be seeded at 1.2 x 10⁶ cells per well of the microwell plate. Calculate Aggregation Medium required to seed the cells at 1 ml per well.
- Prepare aggregation medium. Per 10 ml of Complete Cardiac Induction Medium, add 0.5 µl of BMP4 stock solution (final concentration = 0.5 ng/ml) and Y-27632 ROCK Inhibitor (final concentration = 10 µM).
- Remove the conical tube containing the hPSCs from the incubator and centrifuge the tube at 200 x g for 5 min. Aspirate the wash medium and resuspend the cells in aggregation medium at a density of 1.2 x 10⁶ cells per ml.
- Aspirate the PBS wash solution from each well of the microwell plate. Using a P1000 micropipettor, evenly distribute and seed 1 ml of the cell suspension to each well on the microwell plate. To seed a large number of wells, periodically vortex the cell suspension to prevent settling.
- Centrifuge the plate at 200 x g for 5 min. Observe the plate under the microscope to confirm cells have spun to the bottom of each microwell.
- Incubate the plate for 24 hr at 37 °C in a 5% CO2, 5% O2 (hypoxic) incubator.
- Aspirate the culture medium from each hPSC culture well for dissociation. Rinse each well with 1 ml of dissociation enzyme, and then immediately aspirate the dissociation enzyme from each well.
4. Cardiac Induction Stage 1
- One day following aggregation (day 1), prepare the required volume of Stage 1 Induction medium (for a 24 well plate, volume = 1 ml x number of wells). For 1 ml of complete cardiac induction medium, add 1 µl of BMP4 stock solution (final concentration = 10 ng/ml), 0.5 µl of bFGF stock solution (final concentration = 5 ng/ml), and 0.6 µl of Activin A (final concentration = 6 ng/ml). Place the medium in a 37 °C water bath for at least 15 min.
- Remove the microwell plate from the incubator. Inspect the aggregates under the microscope. Compared to immediately post-centrifuge aggregation, they should appear intact with smooth edges (more round and less square than the previous day).
- Remove the supernatant without disturbing the aggregates inside the microwells:
- Hold the microwell plate horizontally level (i.e., do not tilt it). For each well on the microwell plate, place the tip of a P1000 micropipettor at the surface of the culture medium and against the edge of the well.
- Slowly remove the medium, being careful not to disturb the aggregates at the bottom of the microwells. After reducing the medium level to about 1 to 2 mm from the textured microwell surface, slowly tilt the plate to collect medium at one side of the well (once the volume is sufficiently low, fluid motion is greatly reduced and it is easier to avoid aggregates getting lifted out of their individual microwells). Slowly pipette out the remaining medium in the well.
- To add fresh Stage 1 Induction Medium while ensuring the aggregates remain in their individual microwells: Draw 1 ml of Stage 1 induction medium with a P1000 micropipettor. Hold the pipette tip against the inside edge of the well and very slowly dispense the medium against the inside wall of the well. Repeat for the remaining wells.
- Return the plate to the incubator under hypoxic conditions for 3 days.
5. Cardiac Induction Stage 2
- On day 4, place wash medium (volume = number of wells x 2 ml) in a 37 °C water bath for a minimum of 15 min.
- Prepare the necessary volume of Stage 2 Induction Medium (volume = number of wells x 1 ml): Per ml of Complete Cardiac Induction Medium, add 2 µl of VEGF stock solution (final concentration = 10 ng/ml) and 0.5 µl IWP-2 stock solution (final concentration = 5 µM). Place the prepared Stage 2 Induction medium in a 37 °C water bath for a minimum of 15 min.
- Using a 5 ml serological pipette, harvest the aggregates from each well of the microwell plate and collect the aggregate suspension in a 15 ml conical tube (collect up to 10 wells per 15 ml tube).
- Allow the aggregates to settle for 15 min in a hypoxic incubator.
NOTE: This step is important to separate single cells and cellular debris from the intact aggregates. - Aspirate the supernatant carefully and resuspend the aggregates in 10 ml of the pre-warmed Wash Medium to remove residual inductive cytokines (e.g., Activin A is a potent signaling molecule even at very low concentrations).
- Centrifuge the aggregates at 50 x g for 2 min. Aspirate the supernatant. Resuspend the pelleted aggregates in the pre-warmed Induction 2 Medium.
- Transfer the aggregate suspension to a 24-well ultra-low attachment (ULA) plate at 1 ml per well. Observe the aggregates under the microscope as uniform, tight cell clusters. Incubate under hypoxic conditions until day 6.
6. Cardiac Induction Stage 3
- On day 6, prepare the necessary volume of Stage 3 Induction Medium (volume = number of wells x 1 ml). For 1 ml of Complete Cardiac Induction Medium, add 2 µl VEGF stock solution (final concentration = 10 ng/ml), and 0.5 µl of bFGF stock solution (final concentration = 5 ng/ml). Place prepared Stage 3 induction medium in a 37 °C water bath for a minimum of 15 min.
- Use a 5 ml serological pipette to transfer the aggregates to 15 ml conical tubes, pooling up to 10 ml of aggregates per tube.
- Allow 10 min for the aggregates to settle. Aspirate the supernatant and resuspend the aggregates in the pre-warmed Stage 3 Induction Medium. Using a 5 ml serological pipette, redistribute the aggregates into a 24-well ULA plate at 1 ml per well.
- On day 10, prepare the necessary volume of Stage 3 Induction Medium (volume = number of wells x 1 ml) as per Step 6.1.
- Use a 5 ml serological pipette to transfer the aggregates to 15 ml conical tubes, pooling up to 10 ml of aggregates per tube.
- Allow 10 min for the aggregates to settle. Aspirate the supernatant and resuspend the aggregates in Stage 3 Induction Medium. Using a 5 ml serological pipette, redistribute the aggregates into a 24-well ULA plate at 1 ml per well.
- Incubate under hypoxic conditions for two days. On day 12, begin incubating the cells at normoxic oxygen levels for the remainder of the culture period (37 °C, 20% O2, 5% CO2).
NOTE: After this time point, cells are no longer cultured under hypoxic conditions. - Repeat this complete medium exchange (Steps 6.2 and 6.3) every 4 days, beginning day 14 until cell harvest (typically, peak cardiomyocyte concentrations are observed after day 14 of differentiation).
7. Flow Cytometry Analysis of Cardiac Troponin T (cTnT) Expression Frequency of Microwell Culture Output
- Dissociate the aggregates as follows:
- Use a 5 ml serological pipette to transfer 1 well of aggregates to a 15 ml conical tube. Centrifuge the aggregates at 50 x g for 2 min and carefully aspirate the supernatant.
- Add 1 ml of freshly dissolved 1 mg/ml Collagenase Type II solution to the aggregates. Transfer the aggregate suspension to a 1.5 ml microcentrifuge tube. Incubate the aggregates in Collagenase Type II overnight at room temperature.
- The following day, use a P1000 micropipettor to gently dissociate the aggregates into a homogenous single cell suspension. If the aggregates do not readily dissociate, settle the aggregates, aspirate the supernatant, and incubate the aggregates in 700 μl of Dissociation enzyme for 1 to 2 min at RT. Gently pipette the aggregates 1 to 2 times with a P1000 micropipettor to dissociate.
- Dilute the dissociation enzyme: Add 700 μl of Wash Medium containing 14 μl of 1 mg/ml DNAse stock solution. Take a 10 μl sample to perform a cell count, and centrifuge the remaining suspension using a bench-top microcentrifuge at 300 x g for 2 min.
- Perform a cell count: Stain the 10 μl counting sample with an equal volume of Trypan Blue and count using a hemocytometer.
- Remove the 1.5 ml microcentrifuge tube containing the remaining cells from the microcentrifuge. Aspirate the supernatant and resuspend the cells, at a concentration of 200,000 to 500,000 cells per 100 μl, in Hanks Balanced Salt Solution containing 2% Fetal Bovine Serum (HF).
- For each condition, transfer 100 μl of cell suspension per well to 2 wells of a 96-well plate (one well will be stained with the cTnT antibody and the other will be the secondary antibody control).
- Centrifuge the plate at 300 x g for 2 min. Remove the supernatant with a multichannel micropipettor.
- Fix the cells: Add 200 μl of Fixation Solution (kit component) per well and incubate the plate for 15 min at RT.
- Centrifuge the plate at 300 x g for 2 min. Use a multichannel micropipettor to carefully withdraw the supernatant from the wells. Dispose the supernatant in a paraformaldehyde waste container.
- Wash the fixed cells twice: Add 200 μl of HF to each well. Centrifuge the plate at 300 x g for 2 min. Aspirate the supernatant, and repeat the wash step once more. Fixed cells can be stored for up to one week in HF at 4 °C.
- Permeabilize the cells:
- Centrifuge the plate at 300 x g for 2 min.
- Add 100 μl of Permeabilization Solution (kit component) to each well and incubate the plate at room temperature for 5 min.
- Centrifuge the plate at 300 x g for 2 min and aspirate the supernatant.
- Prepare a master mix of anti-cTnT in HF at the optimal concentration for the given lot number (The optimal dilution must be determined by titration and typically ranges from 1:500 to 1:2,000).
- For each condition (2 wells per condition), add 100 μl of master mix to one well (stained sample) and 100 μl of plain HF to the other well (secondary antibody control). Incubate the cells at 4 °C for 30 min.
- Centrifuge the cells at 300 x g for 2 min. Aspirate the supernatant and add 200 μl of HF per well. Repeat this wash step one more time.
- Prepare a master mix of the secondary antibody. Transfer a volume of HF that corresponds to 100 μl for every well (secondary antibody control and cTnT-stained) being treated. Add 1 μl of goat anti-mouse-APC secondary antibody per 200 μl of HF (1:200 dilution).
- Stain the samples. Add 100 μl of staining solution to each well (both the secondary antibody control and anti-cTnT-stained wells). Incubate cells in the dark at 4 °C for 30 min (keep the plate covered or in the dark after adding fluorescent secondary antibody to avoid photobleaching).
- Centrifuge the cells at 300 x g for 2 min. Aspirate the supernatant and add 200 μl of HF per well. Repeat this wash step one more time.
- Transfer the samples to 5 ml round bottom flow cytometer analysis tubes and perform flow cytometry for signal in the APC channel using the standard protocols for the instrument19.
Results
Size-controlled aggregates of hPSCs can effectively be formed using the microwell system, dependent only on the concentration of cells and the microwell surface area. Following a short centrifugation, the appropriate numbers of cells (1,000 in this protocol) are brought together in each microwell (Figure 1A). Importantly, these cells reestablish intracellular connections within 24 hr, and should no longer fill the well, but appear as compact aggregates with smooth edges (Figure 1B). These aggregates provide the starting materials for further differentiation towards a cardiac fate. If the cells fail to form tight clusters, this suggests possible cell death following dissociation and reaggregation, and the suitability of single cell passaging and ROCK inhibitor concentrations for a particular cell line should be examined. The following three days in microwells show little change in aggregate morphology, although some growth is evident. When removed from the microwells, aggregates should maintain their round, tightly packed morphology and be of a similar size to one another (Figure 1C). Culture in ULA 24-well plates will permit further cell expansion and growth.
By day 8, after exposure first to Activin signaling, and Wnt inhibition, the aggregates will begin to appear as larger and brighter aggregates (Figure 1D). During this period, considerable cellular debris will be evident at the bottom of each well and must be removed by allowing aggregates to settle before removing media. Occasionally, many aggregates will fuse together. This will not inhibit the differentiation of other aggregates in the well, although these "super aggregates" tend not to exhibit the morphological changes seen with smaller aggregates and are less likely to undergo complete differentiation.
Continued differentiation results in notable morphological changes to the aggregates with an increased size and the appearance of organized fibrous regions. By day 12, contracting aggregates can be observed. These will always be made up of large, transparent cells and often include extensive extracellular matrix outside of the aggregate (Figure 2). While aggregate-wide contractions indicate a successful differentiation, cardiac marker expression may also be observed in aggregates that do not appear to contract. Following dissociation of aggregates and immunolabeling, a majority of cells will be positive for the cardiomyocyte marker cTnT by flow cytometry (Figure 3). The expression of this marker is stable in the cells and may be observed in aggregates as late as day 19 of differentiation.
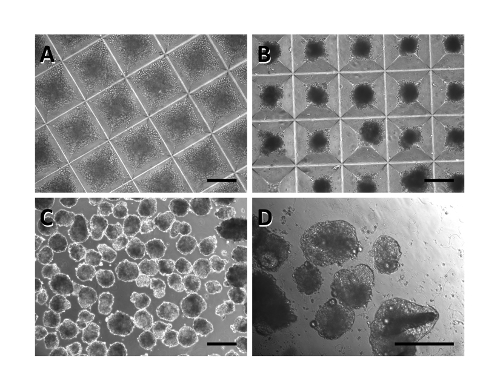
Figure 1: Timeline of hPSC differentiated towards a cardiac fate. Immediately after aggregation, cells nearly fill each microwell (A). One day later, the aggregates appear condensed and smooth (B). This morphology persists even when the aggregates are removed from the microwells and plated into well plates (C). By day 8, aggregates begin to expand and appear lighter in color (D). Scale bar: 250 µm. Please click here to view a larger version of this figure.
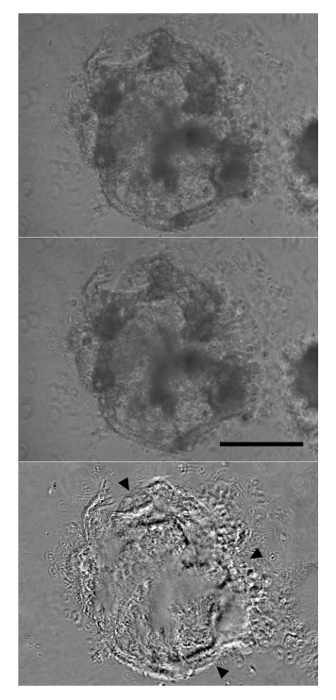
Figure 2: Aggregates Begin Contracting by Day 12 of Differentiation. After six days in Cardiac Induction Stage 3 Medium, forceful aggregate-wide contractions were observed (top panel: relaxation, middle panel: contraction). The lower panel is derived from subtracting the upper and middle panels, with most significant differences appearing as black or white (arrowheads). Scale bar: 250 µm. Please click here to view a larger version of this figure.
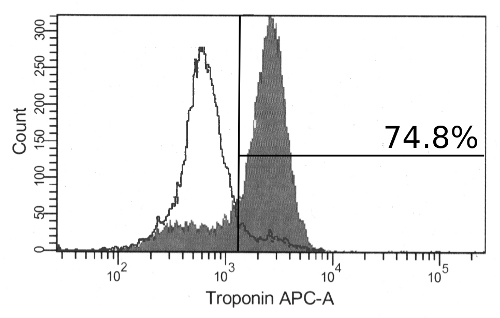
Figure 3: Immunolabeling for Cardiac Troponin T in Differentiated hPSCs. At day 17, most of the cells are positive for cardiac troponin T by flow cytometry (filled histogram). Also shown are cells stained with secondary antibody alone (unfilled histogram). Please click here to view a larger version of this figure.
Discussion
It has been observed that efficient cardiac differentiation of pluripotent stem cells is a highly variable process. While it is not surprising that different cell lines exhibit varying propensities for differentiation capacity to specific cell types, it has been observed that cardiac differentiation efficiency fluctuates dramatically between replicate runs using the same cell line6. The protocol described here addresses one major source of this variability by directly controlling the input cell number per aggregate. To further reduce variability between runs, it is recommended that hPSC lines adapted for single cell passaging are used, as this form of hPSC expansion and maintenance results in more consistent pluripotent populations with respect to expression frequencies of pluripotency markers (e.g., Oct4, Nanog, Tra-1-60, etc.).
The protocol as written here specifies an aggregate size of 1,000 cells for optimal cardiac induction from the HES-2 embryonic stem cell line. To apply this protocol to different cell lines, it is critical that an initial aggregate size screen be performed to determine the cell line-specific optimal aggregate size. While it does not directly impact the procedures to be followed here, we remind the reader that changes in aggregate size and overall cell density are expected to affect oxygen delivery. This may become a relevant consideration in downstream applications. Additionally, apoptotic cell death is a concern during dissociation of hPSCs to single cells. Therefore, it is critical to ensure that ROCK inhibitor is present during forced cell aggregation in the microwells. Finally, it is critical that on day 4 of differentiation the aggregates are well washed to remove trace Activin A, present in the Induction 1 Medium, prior to resuspension in Induction 2 Medium. After day 4 of differentiation, Activin A promotes endoderm differentiation at the expense of mesoderm induction20.
The main application of this technique is to screen aggregate sizes that promote efficient cardiac differentiation. However, one of the limitations of the current technique is that it is challenging to scale cardiac production to clinically relevant levels using microwell plates. Scale up of cardiac differentiation is typically carried out in bulk culture conditions in stirred suspension bioreactors21. Therefore, once the microwell system has been used to determine acceptable ranges of aggregate size for efficient cardiac induction, the next step to scale up is to determine bioreactor impeller speeds that can generate the desired cell aggregate size.
One of the significant differences of this technique with respect to other methods for aggregate-based cardiac differentiation is that it enables direct investigations into modulating the effects of endogenous signaling in aggregates as well as the co-culture of inductive/inhibitory tissue types with the hPSCs in the aggregate13. These types of investigations can inform process development of large scale cardiac production.
Disclosures
M.U. has a financial interest in the underlying microwell technology.
Acknowledgements
We thank Dr. Peter Zandstra, in whose laboratory this protocol was developed, and Drs. Mark Gagliardi and Gordon Keller who provided assistance in establishing the initial methods on which this process was based. Protocol development was supported by an Ontario Graduate Scholarship in Science and Technology to C.B. and a grant from the Heart and Stroke Foundation of Ontario to Peter Zandstra.
Materials
| Name | Company | Catalog Number | Comments |
|---|---|---|---|
| Biological safety cabinet | |||
| Pipette aid | |||
| Serological pipettes (5 to 25 ml) | |||
| Aspirator | |||
| Aspirator or Pasteur pipettes | |||
| 15 and 50 ml conical tubes | |||
| Fume hood | |||
| 0.22 µm syringe filter | |||
| 5% CO2, 5% O2, and humidity controlled cell culture incubator | Hypoxic (low oxygen) incubator | ||
| 5% CO2, 20% O2, and humidity controlled cell culture incubator | |||
| Low speed centrifuge with a swinging bucket rotor fitted with a plate holder | |||
| P2, P20, P200, and P1000 micropipettors and associated tips | |||
| Inverted microscope with 4X, 10X and 20X phase objectives | |||
| Ultra-Low Attachment (ULA) 24 well plates | Corning/Costar | 3473 | |
| 1.5 ml microcentrifuge tubes | |||
| Bench-top microcentrifuge | |||
| L-Ascorbic Acid | Sigma-Aldrich | A4403 | |
| Sterile Ultrapure distilled water | Sigma-Aldrich | W3500 | |
| Vortex | |||
| Ice | |||
| -20 °C freezer | |||
| Monothioglycerol | Sigma-Aldrich | M6145 | Toxic; Aliquoting of MTG is strongly recommended to minimize oxidation due to repeated opening. Aliquots can be stored at 4 °C for up to 3 months, -20 °C is recommended for long-term storage. |
| StemPro-34 Medium | Thermo Fisher Scientific | 10639-011 | Basal Cardiac Induction Medium; The supplement is stored at -20 °C and the basal medium at 4 °C. |
| Transferrin | Roche | 10652202001 | |
| BMP-4 | R&D Technologies | 314-BP | |
| bFGF | R&D Technologies | 233-FB | |
| VEGF | R&D Technologies | 293-VE | |
| Activin A | R&D Technologies | 338-AC | |
| IWP-2 | Reagents Direct | 57-G89 | |
| Phosphate buffered saline (PBS) | Thermo Fisher Scientific | 14190 | |
| Bovine Serum Albumin (BSA) | Thermo Fisher Scientific | 15561 | |
| Hydrochloric acid | Sigma-Aldrich | 258148 | Corrosive |
| Dimethylsulfoxide (DMSO) | Sigma-Aldrich | D2650 | |
| DMEM/F-12 | Thermo Fisher Scientific | 12660 | |
| 100x Penicillin/Streptomycin | Thermo Fisher Scientific | 15140 | |
| 100x L-glutamine | Thermo Fisher Scientific | 25030 | |
| Knockout Serum Replacement | Thermo Fisher Scientific | 10828010 | |
| TrypLE Select | Thermo Fisher Scientific | 12563 | Dissociation enzyme |
| Hemocytometer | |||
| Trypan Blue | |||
| Aggrewell 400 plates | StemCell Technologies | 27845 | Microwell Plates |
| Aggrewell Rinsing Solution | StemCell Technologies | 7010 | Microwell Rinsing Solution |
| Y-27632 ROCK Inhibitor | Tocris | 1254 | |
| Collagenase Type II | Sigma-Aldrich | C6885 | |
| Hank's Balanced Salt Solution | Thermo Fisher Scientific | 14025092 | |
| Fetal Bovine Serum | Thermo Fisher Scientific | 12483 | |
| 96 well plate (for FACS staining) | |||
| Intraprep Permeabilization Reagent | Beckman Coulter | IM2389 | Kit with 2 parts: Fixation Solution and Permeabilization Solution; Toxic |
| cTnT antibody | Neomarkers | MS-295 | |
| goat anti-mouse-IgG APC antibodyThermoFisher | Molecular Probes | A865 | |
| 5 ml round bottom flow cytometry tubes | FACS machine dependent |
References
- Wintermantel, E., et al. Tissue engineering scaffolds using superstructures. Biomaterials. 17, 83-91 (1996).
- Lazar, A., et al. Formation of porcine hepatocyte spheroids for use in a bioartificial liver. Cell Transplant. 4, 259-268 (1995).
- Sachlos, E., Auguste, D. T. Embryoid body morphology influences diffusive transport of inductive biochemicals: a strategy for stem cell differentiation. Biomaterials. 29, 4471-4480 (2008).
- Johnstone, B., Hering, T. M., Caplan, A. I., Goldberg, V. M., Yoo, J. U. In vitro chondrogenesis of bone marrow-derived mesenchymal progenitor cells. Exp. Cell Res. 238, 265-272 (1998).
- Steinberg, M. S. Does differential adhesion govern self-assembly processes in histogenesis? Equilibrium configurations and the emergence of a hierarchy among populations of embryonic cells. J. Exp. Zool. 173, 395-433 (1970).
- Bauwens, C. L., et al. Control of human embryonic stem cell colony and aggregate size heterogeneity influences differentiation trajectories. Stem Cells Dayt. Ohio. 26, 2300-2310 (2008).
- Koike, M., Kurosawa, H., Amano, Y. A Round-bottom 96-well Polystyrene Plate Coated with 2-methacryloyloxyethyl Phosphorylcholine as an Effective Tool for Embryoid Body Formation. Cytotechnology. 47, 3-10 (2005).
- Ng, E. S., Davis, R. P., Azzola, L., Stanley, E. G., Elefanty, A. G. Forced aggregation of defined numbers of human embryonic stem cells into embryoid bodies fosters robust, reproducible hematopoietic differentiation. Blood. 106, 1601-1603 (2005).
- Burridge, P. W., et al. Improved human embryonic stem cell embryoid body homogeneity and cardiomyocyte differentiation from a novel V-96 plate aggregation system highlights interline variability. Stem Cells Dayt. Ohio. 25, 929-938 (2007).
- Ungrin, M. D., Joshi, C., Nica, A., Bauwens, C., Zandstra, P. W. Reproducible, ultra high-throughput formation of multicellular organization from single cell suspension-derived human embryonic stem cell aggregates. PloS One. 3, e1565(2008).
- Kozhich, O. A., Hamilton, R. S., Mallon, B. S. Standardized generation and differentiation of neural precursor cells from human pluripotent stem cells. Stem Cell Rev. 9, 531-536 (2013).
- Ungrin, M. D., et al. Rational bioprocess design for human pluripotent stem cell expansion and endoderm differentiation based on cellular dynamics. Biotechnol. Bioeng. 109, 853-866 (2012).
- Bauwens, C. L., et al. Geometric control of cardiomyogenic induction in human pluripotent stem cells. Tissue Eng. Part A. 17, 1901-1909 (2011).
- Golos, T. G., Giakoumopoulos, M., Garthwaite, M. A. Embryonic stem cells as models of trophoblast differentiation: progress, opportunities, and limitations. Reprod. Camb. Engl. 140, 3-9 (2010).
- Markway, B. D., et al. Enhanced chondrogenic differentiation of human bone marrow-derived mesenchymal stem cells in low oxygen environment micropellet cultures. Cell Transplant. 19, 29-42 (2010).
- Fey, S. J., Wrzesinski, K. Determination of drug toxicity using 3D spheroids constructed from an immortal human hepatocyte cell. Toxicol. Sci. Off. J. Soc. Toxicol. 127, 403-411 (2012).
- Wallace, L., Reichelt, J. Using 3D culture to investigate the role of mechanical signaling in keratinocyte stem cells. Methods Mol. Biol. Clifton NJ. 989, 153-164 (2013).
- Ungrin, M., O'Connor, M., Eaves, C., Zandstra, P. W. Phenotypic analysis of human embryonic stem cells. Curr. Protoc. Stem Cell Biol. , (2007).
- Bhattacharya, S., et al. High efficiency differentiation of human pluripotent stem cells to cardiomyocytes and characterization by flow cytometry. J. Vis. Exp. JoVE. , e52010(2014).
- Nostro, M. C., et al. Stage-specific signaling through TGFβ family members and WNT regulates patterning and pancreatic specification of human pluripotent stem cells. Dev. Camb. Engl. 138, 861-871 (2011).
- Niebruegge, S., et al. Generation of human embryonic stem cell-derived mesoderm and cardiac cells using size-specified aggregates in an oxygen-controlled bioreactor. Biotechnol. Bioeng. 102, 493-507 (2009).
Reprints and Permissions
