Oxidation stability of transport fuels has become a concern for future fuel development. This work presents an original methodology developed by IFP Energies Nouvelles for assessing fuel stability using two different reactors. This methodology was successfully applied to gain an in-depth understanding of the oxidation kinetics and pathways of model molecules and commercial fuels.
Method Article
Original Experimental Approach for Assessing Transport Fuel Stability
In This Article
Summary
Abstract
The study of fuel oxidation stability is an important issue for the development of future fuels. Diesel and kerosene fuel systems have undergone several technological changes to fulfill environmental and economic requirements. These developments have resulted in increasingly severe operating conditions whose suitability for conventional and alternative fuels needs to be addressed. For example, fatty acid methyl esters (FAMEs) introduced as biodiesel are more prone to oxidation and may lead to deposit formation. Although several methods exist to evaluate fuel stability (induction period, peroxides, acids, and insolubles), no technique allows one to monitor the real-time oxidation mechanism and to measure the formation of oxidation intermediates that may lead to deposit formation. In this article, we developed an advanced oxidation procedure (AOP) based on two existing reactors. This procedure allows the simulation of different oxidation conditions and the monitoring of the oxidation progress by the means of macroscopic parameters, such as total acid number (TAN) and advanced analytical methods like gas chromatography coupled to mass spectrometry (GC-MS) and Fourier Transform Infrared - Attenuated Total Reflection (FTIR-ATR). We successfully applied AOP to gain an in-depth understanding of the oxidation kinetics of a model molecule (methyl oleate) and commercial diesel and biodiesel fuels. These developments represent a key strategy for fuel quality monitoring during logistics and on-board utilization.
Introduction
Oxidation stability is a criterion for evaluating fuel quality. The oxidation stability of a fuel can be monitored by several methods such as induction period, peroxides, acids, and insolubles. The induction period (IP) is the period at the beginning of the oxidation process during which the reactions are slow, due to a low concentration of reaction intermediates or the presence of antioxidants.
Figure 1 represents a simplified mechanism of the oxidation of hydrocarbons. As reported1,2, the oxidation of hydrocarbons in the liquid phase mainly follows a radical mechanism. It proceeds according to three steps: initiation, propagation and termination. During the initiation step, free radicals are formed by hydrogen abstraction from the initial hydrocarbon (RH) or the decomposition of hydroperoxides already present in the fuel (R1a-c). The addition of di-oxygen to the formed radical results in peroxide formation according to reaction (R2). The propagation step proceeds mainly through the peroxide route. The peroxide formed reacts with the initial hydrocarbon by hydrogen abstraction or by addition producing hydroperoxides or polyperoxides, according to reactions (R3a) and (R3b), respectively. The decomposition of hydroperoxides generates different oxygenated products, mainly, alcohols, carbonyls, epoxides and alkanes (R4). The termination step occurs when stable products are formed through free radical recombination (R5-R7). In this work we developed a procedure to monitor the oxidation process using two existing oxidation reactors.
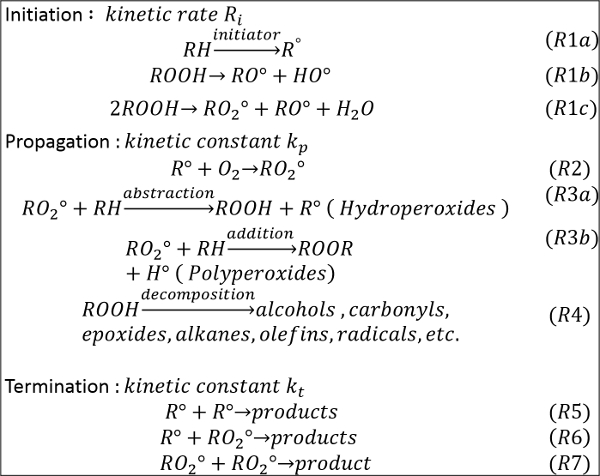
Figure 1. Simplified mechanism of hydrocarbon oxidation. The mechanism represents globalized key-steps of the oxidation of hydrocarbons including several known steps: initiation propagation and termination. This figure has been reprinted with permission from8, Copyright 2015 American Chemical Society. Please click here to view a larger version of this figure.
Accelerated oxidation was performed using a Rancimat device (Reactor 1). This device is used for the standard test of FAME and FAME containing diesel fuels according to the standard EN 157513. Reactor 1 is equipped with two heating blocks: heating block A and heating block B. Each heating block contains 4 reaction vessels, numbered from 1 to 4, linked to 4 measuring cells. A part of the volatile species, generated during the oxidation is entrained by the circulating air and captured by a measuring cell filled with distilled water. The variation in the water conductivity signal is monitored continuously. The induction period (IP) is characterized by a sudden rise of conductivity associated especially with volatile acid species. Further details about the standard method can be found elsewhere4,5.
The PetroOxy device (Reactor 2) was also used to perform an accelerated fuel oxidation test. This equipment is used for the measurement of the oxidation stability of middle distillate and gasoline fuels according to the ASTM D 7545 and ASTM D 7525 standards6,7. The induction period measured by the apparatus is defined as the time necessary to reach a 10% pressure drop (ΔP) measured in the test cell head space.
These techniques have been largely used for the standard characterization of oxidation stability of middle distillate fuels as well as for oxidation kinetics studies8, 9, 10,11.
Protocol
NOTE: Please consult all relevant material safety data sheets (MSDS) before use. The operator needs to be equipped with personal protective equipment, including gloves, gown and goggles. Before use, fresh reagents need to be stored in a refrigerator. Oxidized fuels are rich in corrosive acidic species. They cannot be stored in metal flasks and must be stored in the refrigerator in suitable glass vessels, with limited headspace air, in a vertical position to avoid contact between the fuel and the flask cap. The refrigerator was kept at 6 °C. The oxidation produces volatile oxidation products that may cause respiratory irritation. Thus, all oxidation experiments need to be carried under an extraction hood.
1. Advanced Oxidation Procedure in Reactor 1
NOTE: Reactor 1 was used to perform the controlled oxidation of methyl oleate (MO), a mono-unsaturated model molecule representative of commercial FAME3. The tests aimed at monitoring MO oxidation through the following steps.
- Determine the average induction period (IP)
- Prepare the reaction vessels and the measurement cells according to the standard test method4.
- Remove possible dust or contaminants from the reaction vessels before fuel introduction using compressed air.
- Fill the reaction vessels of Block A: 1 to 4 with 7 ml of a fresh fuel sample of methyl oleate using a pipette.
- Configure the test.
- Set the heating setpoint temperature of Block A to 110 °C (± 0.3 °C).
- Set the air flow rate to be bubbled through the sample to 10 L/hr.
- Set the shutoff criteria to either a conductivity threshold of 400 µS/cm or an IP determined by the software. The test stops when one of the two criteria is reached.
- Enter the name and reference of each of the samples of Block A in the software.
- Launch the test by pressing the "start" button.
NOTE: This implies simultaneously bubbling air through the sample and raising the heating block temperature (the heating time is about 45 min for a setpoint temperature of 120 °C). When the shutoff criterion is reached, the air bubbling and the block heating are automatically interrupted. - Extract the reaction vessels from the heating block.
- Manually and thoroughly agitate the contents of the reaction vessel in order to homogenize the fuel composition. Transfer the contents of each reaction vessel into a 10 ml glass flask and place the glass flasks vertically in the refrigerator immediately after extraction.
- Determine the induction period (IP) from the conductivity signal using the method of tangents intersection illustrated in Figure 2. The induction period is given by the position of the intersection of the extrapolated baseline (T1) and the tangent line drawn from the curve inflection (T2) on the x-axis.
- Calculate the average IP (IPavg) using the IP measurements that are within 10% of IP dispersion according to: IPavg = ΣIPvalid/n, where IPvalid represents the IP measurements within 10% of IP dispersion and n their number.
- Generate samples with different oxidation levels
- Using Block B, repeat steps 1.1.-1.5. However, modify the shutoff criterion by indicating an ending time equal to 4 times the IPavg determined in step 1.1.9.
- Extract "manually" the first reaction vessel from the heating block at 0.5 the IP, the second reaction vessel at the IP, the third reaction vessel at 2 times the IP and the fourth and last reaction vessel at 4 times the IP.
- For each reaction vessel, manually and thoroughly agitate the contents of the vessel to have a homogenous sample. Transfer the entire contents in to 10 ml glass flask, label each sample (0.5 IP, IP, 2 IP and 4 IP, respectively) and place the glass flasks vertically in the refrigerator immediately after extraction.
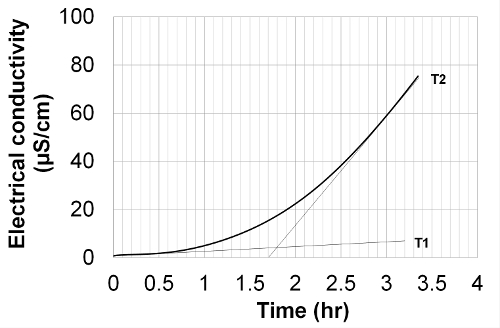
Figure 2. Induction period determination method by tangents intersection; test on methyl oleate at 110 °C. The induction period is given by the position of the intersection of the extrapolated baseline (T1) and the tangent line drawn from the curve inflection (T2) on the x-axis. Please click here to view a larger version of this figure.
- Analyze the generated samples
- Determine the TAN of methyl oleate sampled at increasing oxidation stages using the µTAN method (derived from ASTM D6649).
- Rinse all parts in contact with the sample (sample vessel, electrode, and magnetic stirrer) with ultrapure water followed by isopropanol.
- Weigh out 2 g of the sample and place it in the measurement vessel.
- Dilute the sample in 10 g of isopropanol in the measurement vessel.
- Gradually add a solution of 0.1 mol/L KOH diluted in isopropanol until the equivalence point is reached. This is indicated by a significant potential variation (above 9 mV) measured by using a glass electrode.
- Report the TAN of the sample in milligram KOH per gram of fuel (mg KOH/g).
- Analyze methyl oleate sampled at increasing oxidation stages by GC-MS.
- Inject 1 µl of the sample into a GC-MS equipped with an FFAP column (60 m, 0.250 mm, 0.25 µm) using a split ratio of 1:75.
- Perform the following heating program of the column: 40 °C for 10 min, then heated at 5 °C/min to 100 °C, finally at 1 °C/min up to 250 °C.
- Use the following parameters on the mass spectrometer: potential of the electron ionization source: 70 eV - mass range: m/z = 10 to 400 - full-scan mode.
- Report the gas chromatogram spectra and proceed to the identification of significant peaks.
- Determine the TAN of methyl oleate sampled at increasing oxidation stages using the µTAN method (derived from ASTM D6649).
2. Advanced Oxidation Procedure in Reactor 2
Note: Reactor 2 was used to perform successive oxidation cycles on biodiesel-free diesel fuel (B0) and Rapeseed Methyl Ester (RME). The tests aimed at monitoring fuel oxidation through the following procedure.
- Perform the first oxidation cycle.
- Configure the test.
- Set the heating temperature to 150 °C using the user interface. Set the pressure in the cell to 7 bar using the user interface. Set the shutoff criterion: pressure drop (ΔP) of 10% of the maximum pressure reached.
- Prepare the test cell. Remove possible dust or contaminants using laboratory wipers soaked with acetone and replace the sealing ring.
- Fill the cell with 5 ml of the fuel sample using a pipette. Close the test cell with a screw cap followed by a protective locked cover.
- Launch the test by pressing the "RUN" button in the user interface of Reactor 2.
NOTE: First, the cell is pressurized with oxygen, injected through a supply line, then the cell is depressurized to evacuate the gases through an extraction duct. Then, pressurized again with oxygen. When the head space pressure reaches 7 bar, the test starts. Temperature is raised to 150 °C, and the pressure rises alongside with the temperature until a stable maximum value is reached. - Record using the computer the pressure variation at intervals of 1 second until the shutoff criterion is reached. At this time, the measurement and the cell heating automatically stop.
- Wait for 15 min until the temperature is reduced around 20 °C.
- Depressurize the test cell using the user interface. This purge allows to reach atmospheric pressure in the cell. Open the protective cover and the screw cap.
- Configure the test.
- Perform "x" successive oxidation cycles.
- Repeat steps 2.1.3 to 2.1.6 the desired "x" times.
- At the end of the "x" tests, transfer all of the oxidized fuel remaining in the cell using a pipette to a 10 ml glass flask and place the glass flask vertically in the refrigerator.
- Clean the cell using laboratory wipers soaked with acetone.
- Analyze the generated samples
- Analyze the samples using FTIR-ATR.
- Clean the ATR diamond cell using laboratory paper soaked with ethanol.
- Configure the software parameters: Set 100 scans to build the FTIR spectrum, fix the resolution at 4 cm-1 and set the spectral range from 600 to 4,000 cm-1.
- Extract the fuel flask from the refrigerator and agitate its contents thoroughly in order to homogenize the fuel composition.
- Sample 10 µl of fuel from the fuel flask using a pipette and place the droplet on a horizontal ATR diamond cell at ambient temperature, then start the analysis.
- Analyze the samples using FTIR-ATR.
Results
Study of methyl oleate oxidation using AOP in Reactor 1
The IP of methyl oleate (MO) was measured at 110 °C three times, with an error of less than 5% (absolute deviation 0.06 hr). IP measurements according to the tangent intersection method indicate an average IP time of 1.8 hr. The AOP was performed according to the abovementioned protocol to achieve oxidized samples at 0.5 IP, IP, 2 IP and 4 IP, respectively.
Figure 3 presents the variation of total acid number during the oxidation procedure. The TAN measurement allows the evaluation of the overall oxidation status of the fuel. The TAN of fresh MO is lower than the quantification limit of the TAN device and therefore can be considered as insignificant. From 0 to 0.5 IP, the TAN remains very low (around 0.1 mg KOH/g), and then increases from 0.5 to 1 IP by a factor larger than 8 times. At 4 IP, the TAN is around 52 times higher than at 0.5 IP indicating an exponential increase of TAN with the oxidation time. This behavior suggests that acid species formation is relatively slow during the initial oxidation regime. However, it becomes significant at intermediate and advanced oxidation regimes: i.e., from 0.5 to IP and after the IP.
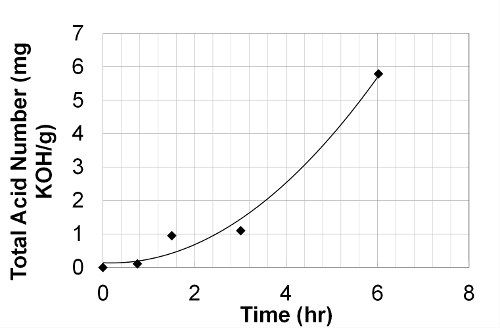
Figure 3. Variation of total acid number (TAN) at different oxidation levels of methyl oleate from 0 IP to 4 IP. The Total Acid Number of methyl oleate increases with the oxidation progress. Please click here to view a larger version of this figure.
Total-ion currents (TIC), acquired during GC-MS coupling, are presented in Figure 4 for the various oxidation stages of the MO sample. TIC, which is equivalent to a GC/FID trace, represents the overall signal coming out of the gas chromatograph.
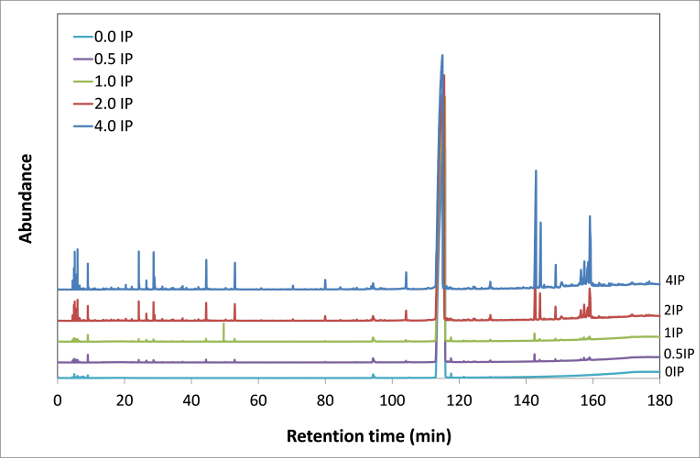
Figure 4. Gas chromatograms of MO samples at different oxidation levels from 0 IP to 4 IP. Overall comparison of the gas chromatograms on a wide range of retention times (0-180 min) presenting the formation of several new peaks related to the oxidation products. Please click here to view a larger version of this figure.
In the fresh MO (0 IP), there are already several peaks but with very low intensities, most likely from impurities. As the purity of standard, MO is above 99%, the sum of the concentrations of all impurities is less than 1%. The peaks associated with the impurities can be identified, which underlines the sensitivity of this analytical technique. All chromatograms are normalized to the same scale to qualitatively compare the relative intensities of the peaks. It is interesting to notice the increase of intensities of several peaks from 0 IP (fresh sample) to 4 IP (highly oxidized sample). Besides, some species that were not present in the initial chromatogram are formed at mid to high oxidation levels with gradually increasing intensities. For ease of readability, Figure 7 presents only the range from 0 to 30 minutes. MO, having a retention time of 115 minutes, does not appear in this time range. The coupling with mass spectrometry (MS) enables the user to perform a molecular identification of the oxidation products. The identification was performed on the MO sample oxidized at 4 times the IP. In fact, this latter sample presents almost all the oxidation products generated at earlier stages with a higher concentration.
For each peak on the chromatogram (Figure 5), the identification of the associated compound was made through comparison between the experimental mass spectrum and the theoretical one (NIST database). For example, the peak with a retention time of 26.5 minutes was methyl-6-heptenoate according to MS identification. Results indicate that methyl-6-heptenoate, initially absent from the fresh product, is produced during the oxidation process. Qualitatively, from 0.5 to 4 times the IP, the intensity of the associated peak rises by a factor of around 10.
Results obtained on the entire chromatogram (from 0 to 190 minutes) highlight the formation, then the rise of concentration of molecules, originally absent, as the oxidation time increases.
The identification of all molecules indicates the formation of various chemical moieties during the oxidation process. First, through the molecular cleavage, several short chain molecules are formed such as C5 to C8 alkenes, C6 to C8 alkanes, C7-C8 methylesters with retention times around 90-120min. Through the direct reaction of molecular oxygen with the alkyl radicals or hydroperoxides, C8-C9 aldehydes, C8-C9 methyl esters containing other oxygenated functional groups (e.g., alcohol or epoxides) are formed at similar retention times. Methylesters and aldehydes with longer chain lengths are also found at retention times greater than 30 minutes such as 2-decenal and 2-undecenal.
Some of the products identified in the present work with GC-MS were consistent with what has been previously reported in literature. For example, Berdeaux et al.12 carried out the oxidation of MO under slightly different experimental conditions (180 °C, 15 hr heating, no oxygen). A separation was carried out to remove the nonpolar compounds and the polar fraction was injected into a GC-MS device. The authors found various aldehydes and methylesters, thus in agreement with our results. Because the non-polar fraction was not characterized by these authors, no comparison is possible concerning alkanes and alkenes. The consistency of our findings with literature results highlights the potential of the AOP for studying the oxidation kinetics of fuels and biofuels.
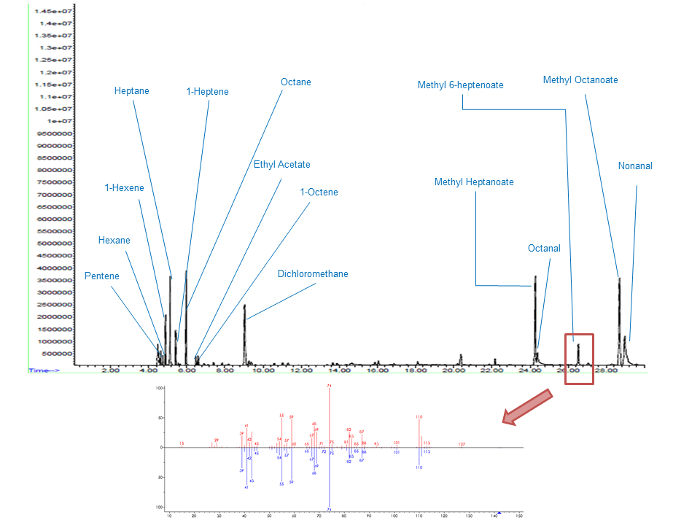
Figure 5. Gas chromatograms of MO oxidized at 4 IP. Molecular identification of the products within a retention time range of 0 - 30 min (top graph) and a focus on methyl-6-heptenoate peak (bottom graph) the upper mass spectrum corresponds to the experimental data and the lower one to the theoretical mass spectrum (NIST database). Please click here to view a larger version of this figure.
Study of biodiesel oxidation using the AOP in Reactor 2
Figure 6 presents samples of B0, and oxidized B0 following 1, 4 and 6 oxidation cycles (B0-1) (B0-4) and (B0-6), respectively. The fuel color changes during the oxidation from transparent to yellowish then brownish. This change is due to the formation of polar compounds. The molecular weight of these products increases along with the oxidation level. Oxidized B0 samples show the formation of a dark viscous phase composed of high molecular weight polar products.
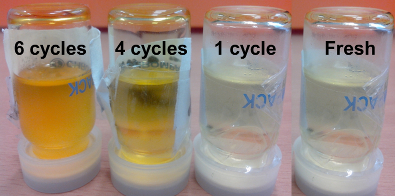
Figure 6. B0 and oxidized B0 samples in reactor 2 following 1, 4 and 6 oxidation cycles in Reactor 2. Color variation of B0 during the oxidation. Please click here to view a larger version of this figure.
Figure 7 presents the evolution of the RME composition identified with FTIR during oxidation at 1, 4 and 6 runs in Reactor 2. Three regions are studied (Figure 7). Peaks observed in the region R1 at [800-1,400 cm-1] suggest the presence of C-O and C-O-C bonds that could be attributed to alcohol, epoxy and oxirane functions. R2 shows the formation of polar products such as acids, aldehydes, ketones and esters. The peaks identified between 1,650 and 1,760 cm-1 broaden along with the oxidation level. In parallel, a pronounced decrease of the double bonds (C=C-H) represented here by the peak at 3,010 cm-1 is observed13: a conversion rate of nearly 30%, 90% and almost 100% were observed after 1, 4 and 6 runs in Reactor 2, respectively. This trend suggests the formation of the oxidation products described in R1 and R2 following the conversion of the double bonds in unsaturated FAME.
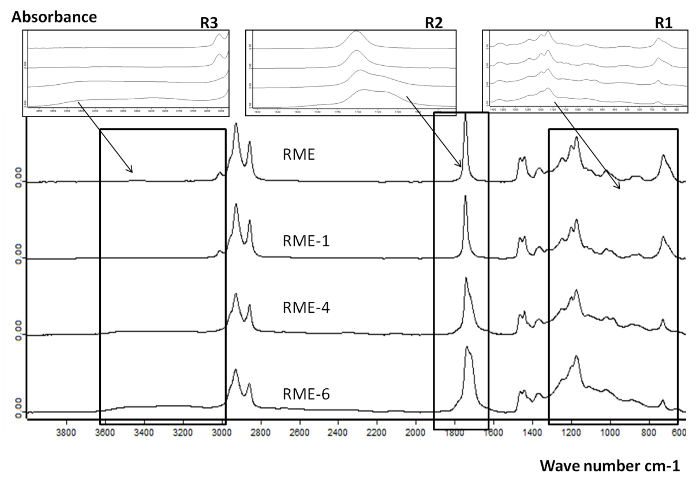
Figure 7. FTIR spectra for RME and oxidized RME samples in reactor 2 following 1, 4 and 6 oxidation cycles. Overall comparison of the FTIR spectra of fresh and oxidized RME on a wide wavelength range (600-3,800 cm-1) presenting the variation of the absorbance signal associated with the oxidation. This figure has been reprinted with permission from8, Copyright 2015 American Chemical Society. Please click here to view a larger version of this figure.
Figure 8 represents FTIR analysis of B0 and oxidized B0 following 1, 4 and 6 oxidation cycles. Three regions are shown R1 (600 - 1,300 cm-1), R2 (1,600 - 1,800 cm-1) and R3 (3,000 - 3,600 cm-1). The carbonyl bond (C=O) was detected in the region R2 of B0-1, B0-4 and B0-6. The area of the carbonyl bond was used for a comparison of the oxidation level 14,15, as the carbonyl peak at 1,710 cm-1 increases with the oxidation level. This peak is attributed to the formation of polar products such as aldehydes, ketones, acids. The peak in the region R3 shows the formation of (OH) functional groups, indicating the presence of alcohols and acids.
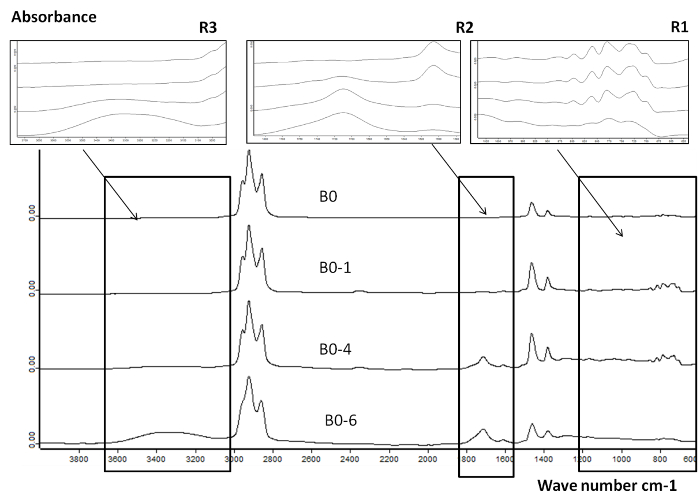
Figure 8. FTIR spectra for B0 and oxidized B0 samples in reactor 2 following 1, 4 and 6 oxidation cycles. Overall comparison of the FTIR spectra of fresh and oxidized B0 on a wide wavelength range (600 - 3,800 cm-1) presenting the variation of the absorbance signal associated with the oxidation. This figure has been reprinted with permission from8, Copyright 2015 American Chemical Society. Please click here to view a larger version of this figure.
In summary, the AOP applied here to the oxidation of commercial diesel and biodiesel allowed to monitor the global oxidation rate of these fuels and the formation of several polar oxygenated compounds throughout the oxidation process on a wide molecular weight range. According to the FTIR results on B0 fuel, a small amount of carbonyl products, mainly ketones and aldehydes, are formed after the first oxidation cycle (B0-1). After 6 oxidation cycles (B0-6), the brownish and more viscous sample indicates a more severe oxidation level. The FTIR analysis provides further knowledge on the main functional groups present, including polar oxidation products such as alcohols, acids and lactones. A higher oxidation rate was observed on RME compared to B0. FTIR results on RME show the conversion of unsaturated molecules (peak at 3,010 cm-1) and the formation of polar oxidation products. Thus, suggesting that unsaturated molecules in RME are driving the oxidation process and leading to a higher oxidation rate compared with B0.
Discussion
An advanced oxidation protocol (AOP) was developed in this work using two oxidation reactors (Reactor 1 and Reactor 2). This protocol was applied to study the oxidation of commercial diesel and biodiesel fuels as well as pure reagents such as methyl oleate. In this section we discuss some aspects of the protocol and its application.
When using Reactor 1 and Reactor 2 as ageing devices, the homogeneity of the oxidized samples should be considered as the oxidation can lead to the formation of insoluble products that can stick to the internal surfaces of the apparatus. Those cannot be collected entirely with a pipette after the cooling of the apparatus. Even after the sample collection, two phases can sometimes be observed at high oxidation levels. In such cases, a part of the supernatant is collected to be analyzed but cannot be considered to be representative of the whole oxidized sample. Besides, the collected samples do not contain intermediate species that are important to assess the oxidation kinetics. Online analysis of the sample during the oxidation may help addressing this issue. Previous works have implemented online analysis during hydrocarbon oxidation using different reactors such as stirred reactors16,17 or autoclaves18. These reactors allow the monitoring of the oxidation products in both the liquid and the gas phases at a higher sampling frequency. They may cover wider range of oxidation conditions (e.g., air flow rate, temperature, mixing speed). However, they require specific and costly test equipment and are more time consuming. In addition, as their design and test conditions are different from standard oxidation stability tests, it is difficult to establish accurately the relationship between fuel reactivity in the standard and alternative tests.
Typical oxidation tests in Reactor 1 or Reactor 2 produce lower than 5 ml and 7 ml, respectively. These small quantities are not sufficient to carry out multiple analyses in optimal conditions. For example, conventional total acid number analysis requires a minimum of 20 grams of the analyzed sample (ASTM D664) which explains the use of µTAN in this work.
The IP calculation (in Reactor 1) was based on the tangents intersection method. A second possible methodology is to calculate the induction period using the secondary derivative4 where the IP is indicated by a maximum in the second derivative. However, this method is limited when the conductivity signal is fluctuating which frequently occurs. The use of the tangents method allows the user to overcome this limitation. However, the tangent method is user-dependent, as it relies on the user for drawing the tangents. In the present study, the determination was performed by the same operator for all the samples. Replicate analyses were performed to validate the results accuracy. According to the experimental results, the induction period precision (IPp) depends on the IP following the equation IPp (hr) = 0.15 IP−0.37, with IP being the induction period, in agreement with the precision of around 0.6 hr previously reported in standard conditions5.
The TAN is a gross indicator for acidic species formation, however, the precision of the µTAN measurement is still dependent on the amount of the sample, particularly, for samples with a low acid number. Besides, the TAN does not provide any molecular information. Nevertheless, it is an interesting technique since a strong relationship between the TAN increase and insoluble deposits formation during oxidation process has been reported in the literature16,19,20. Therefore, a more detailed characterization of oxidized MO samples was performed with GC-MS.
Concerning the GC-MS technique, the system should be checked for possible contamination by injecting a solvent (blank) before analyzing the samples. As this technique is very sensitive, the formation of trace compounds can be monitored. By this means, the absence of any parasite peak can be verified.
Whichever the analytical technique, the sample characterization should be carried out as soon as possible after the oxidation process. In fact, oxidized samples are highly unstable and a long storage time would lead to a change in the sample composition. If storage is unavoidable, attention should be paid to use glass flasks hermetically selected and to store them at a low temperature (e.g., 6 °C).
In conclusion, the AOP allowed the user to monitor the oxidation process of several single and multi-component systems. First, by characterizing the global reactivity through the induction period, then, by generating oxidized samples under controlled conditions. Several characterization techniques such as GC-MS, FTIR, or µTAN can be employed with the generated samples to monitor the variation of their properties and chemical composition. The results provide rich and original information on the oxidation kinetics, the main degradation pathways and the oxidation products. Besides, AOP represents a very useful tool to study the influence of the oxidation conditions such as temperature, oxidation time and oxygen concentration. This work provides an efficient and promising approach that may be of use for studying the oxidation kinetics for transport or biological applications.
Disclosures
The authors have nothing to disclose.
Acknowledgements
The authors would like to thank the French National Association of Research and Technology (ANRT) for funding this research through the PhD grant awarded to Dr. Kenza Bacha.
Materials
| Name | Company | Catalog Number | Comments |
|---|---|---|---|
| Rancimat | Metrohm | Rancimat 843 | Standard test apparatus for diesel and biodiesel oxidation stability |
| PetroOxy | Petrotest | 13-3000 | Standard test apparatus for diesel and biodiesel oxidation stability |
| FTIR spectrometer | Brucker | Brucker IFS66 | Apparatus for chemical composition analysis through chemical functions identification |
| Total acid number titrator | Metrohm | Titrino Plus 848 | Test apparatus for diesel and biodiesel oxidation stability |
| Gas Chromatograph | Agilent | 6890 Agilent GC/MS | Analatical chemistry technique used to separate the compounds present in a sample |
| Gas Chromatography column | Agilent | DB-FFAP column | Component of Gas Chromatogram that separates the molecules |
| Mass Spectrometer | Agilent | 5973 inert mass spectrometer | Analytical chemistry technique used to identify the compounds present in a sample |
| Methyl Oleate 99% | SIGMA ALDRICH | 311111 ALDRICH | Pure reagent |
| EMAG-free ultra-low sulfur diesel | Total ACS | CEC RF-06-03 | Commercial Diesel fuel |
| Rapeseed methyl Ester | ASG | Biodiesel 3826 00 10 | Commercial Biodiesel |
| Isopropanol >99.9% | VWR | 84881.290 | Solvent for Total Acid Number determination |
| KOH 0.1 M in isopropanol | VWR | 1.05544.1000 | Titration agent for Total Acid Number determination |
References
- Watkinson, A., Wilson, D. Chemical reaction fouling: A review. Exp. Therm Fluid Sci. 14 (4), 361-374 (1997).
- Denisov, E., Afanas'ev, I. Oxidation and Antioxidants in Organic Chemistry and Biology. , CRC Press. (2005).
- European standard. Automotive fuels - Fatty acid methyl ester (FAME) fuel and blends with diesel fuel - Determination of oxidation stability by accelerated oxidation method. , EN 15751, ICS: 75.160.20 - Liquid fuels (2014).
- Ben Amara, A., Nicolle, A., Alves-Fortunato, M., Jeuland, N. Toward Predictive Modeling of Petroleum and Biobased Fuel Stability: Kinetics of Methyl Oleate/n-Dodecane Autoxidation. Energy Fuels. 27 (10), 6125-6133 (2013).
- Pullen, J., Saeed, K. An overview of biodiesel oxidation stability. Renew. Sustainable Energy Rev. 16 (8), 5924-5950 (2012).
- ASTM International. Standard Test Method for Oxidation Stability of Middle Distillate Fuels - Rapid Small Scale Oxidation Test (RSSOT) - ASTM D 7545-14. , ASTM Standard. West Conshohocken, PA. (2014).
- ASTM International. ASTM Standard Test Method for Oxidation Stability of Spark Ignition Fuel - Rapid Small Scale Oxidation Test (RSSOT) - ASTM D 7524-14. , ASTM Standard. West Conshohocken, PA. (2014).
- Bacha, K., Ben Amara, A., Vannier, A., Alves-Fortunato, M., Nardin, M. Oxidation Stability of Diesel/Biodiesel Fuels Measured by a PetroOxy Device and Characterization of Oxidation Products. Energy Fuels. 29 (7), 4345-4355 (2015).
- ASTM Standard. Standard Test Method for Acid Number of Petroleum Products by Potentiometric Titration - ASTM D 664-11A. , ASTM International. West Conshohocken, PA. (2011).
- Chatelain, K., Nicolle, A., Ben Amara, A., Catoire, L., Starck, L. A wide range experimental and kinetic modeling study of chain length impact on n-alkanes autoxidation. Energy & Fuels. , (2016).
- Ben Amara, A., Kaoubi, S., Starck, L. Toward an optimal formulation of alternative jet fuels: Enhanced oxidation and thermal stability by the addition of cyclic molecules. Fuel. 173, 98-105 (2016).
- Berdeaux, O., et al. A detailed identification study on high-temperature degradation products of oleic and linoleic acid methyl esters by GC-MS and GC-FTIR. Chem. Phys. Lipids. 165 (3), 338-347 (2012).
- Pillar, R., Ginic-Markovic, M., Clarke, S., Matisons, J. Effect of Alkyl Chain Unsaturation on Methyl Ester Thermo-Oxidative Decomposition and Residue Formation. J. Am. Oil Chem. Soc. 86 (4), 363-373 (2009).
- Singer, P., Ruhe, J. On the mechanism of deposit formation during thermal oxidation of mineral diesel and diesel/biodiesel blends under accelerated conditions. Fuel. 133, 245-252 (2014).
- Araujo, S. V., et al. FTIR assessment of the oxidation process of castor oil FAME submitted to PetroOXY and Rancimat methods. Fuel Process Technol. 92 (5), 1152-1155 (2011).
- Ben Amara, A., Lecointe, B., Jeuland, N., et al. Experimental study of the impact of diesel/biodiesel blends stability on the fuel injection system. SAE Int. J. Fuels Lubr. , (2014).
- Gernigon, S. Hydrocarbon liquid fuel thermal stability, antioxidant influence and behavior (in French). , Paris. (2010).
- Lin, S. S., Hung-Shan, W. 34;Liquid-phase oxidation of cyclohexane using CoAPO-5 as the catalyst.". Appl. Catal., A. 105 (2), 289-308 (1993).
- Fortunato, M. A., Starck, L., Takahashi, T., Ohmae, K., IIda, Y. SAE Technical Paper 2015-01-1930. Oxidation Stability of Diesel/Biodiesel Blends: Impact of Fuels Physical-Chemical Properties over Ageing during Storage and Accelerated Oxidation. , (2015).
- Bouilly, J., Mohammadi, A. SAE Technical Paper 2012-01-0860. Biodiesel Stability and its Effects on Diesel Fuel Injection Equipment. , (2012).
Reprints and Permissions
