Here, we present a protocol to quantify allergen-loaded particles by flow cytometry. Ambient particulate matter particles may act as carriers of adsorbed allergens. We show here that flow cytometry, a method widely used to characterize suspended solids >0.5 µm in diameter, can be used to measure these allergen-loaded particles.
Method Article
Flow Cytometric Analysis of Particle-bound Bet v 1 Allergen in PM10
In This Article
Summary
Abstract
Flow cytometry is a method widely used to quantify suspended solids such as cells or bacteria in a size range from 0.5 to several tens of micrometers in diameter. In addition to a characterization of forward and sideward scatter properties, it enables the use of fluorescent labeled markers like antibodies to detect respective structures. Using indirect antibody staining, flow cytometry is employed here to quantify birch pollen allergen (precisely Bet v 1)-loaded particles of 0.5 to 10 µm in diameter in inhalable particulate matter (PM10, particle size ≤10 µm in diameter). PM10 particles may act as carriers of adsorbed allergens possibly transporting them to the lower respiratory tract, where they could trigger allergic reactions.
So far the allergen content of PM10 has been studied by means of enzyme linked immunosorbent assays (ELISAs) and scanning electron microscopy. ELISA measures the dissolved and not the particle-bound allergen. Compared to scanning electron microscopy, which can visualize allergen-loaded particles, flow cytometry may additionally quantify them. As allergen content of ambient air can deviate from birch pollen count, allergic symptoms might perhaps correlate better with allergen exposure than with pollen count. In conjunction with clinical data, the presented method offers the opportunity to test in future experiments whether allergic reactions to birch pollen antigens are associated with the Bet v 1 allergen content of PM10 particles >0.5 µm.
Introduction
Air pollution is being considered as an important environmental cause of the increased incidence and severity of respiratory allergies observed in recent decades1-3. Moreover, there was growing interest in the distribution of common allergens in dust4,5.
Birch pollen can provoke hay fever but can also be an important trigger of allergic asthma6-8. Whole birch pollen is not likely to enter the lower respiratory tract or to be found in PM10 as a result of its size (22 µm in diameter). However, birch pollen allergens like Bet v 1, the major birch pollen allergen component, can be released after pollen rupture9 and can bind to ambient air particles10, thus possibly enter the lower respiratory airways. Indeed, it has been shown that PM10 may contain biologically active allergens as demonstrated by in vitro activation of basophiles from a pollen allergic proband11.
Bet v 1 allergen content in PM10 samples has been studied by extracting the respective allergen and subsequent quantification with ELISA12-14. With the ELISA technique, the dissolved allergen was measured, but the amount of allergen-loaded particles still remained unknown. Scanning electron microscopy revealed allergen-loaded particles but did not allow quantification10,15.
This study employs flow cytometry to quantify the proportion of Bet v 1-loaded PM10 particles in ambient air samples. Due to the detection limit of the flow cytometer only particles larger than 0.5 µm can be examined. The >0.5 µm fraction of PM10 will be further referred to as PM10>0.5.
Protocol
NOTE: This protocol describes the indirect staining of PM10 particles with a monoclonal antibody (monoclonal mouse IgG1 antibody, clone MA-3B4) against Bet v 1, the major birch pollen antigen component, plus an Allophycocyanin (APC)-labeled secondary antibody (anti-Mouse IgG1 antibody, clone A85-1) and the subsequent analysis on a flow cytometer. With appropriate other antibodies available, this method might be extended to the detection of other antigens bound to ambient air particles.
1. PM10 Sampling
- Collect PM10 from ambient air on polytetrafluoroethylene (PTFE) filters using a low volume sampler with a flow rate of 2.3 m3/hr (Figure 1). A characterization of the sampler used for the experiments described here is found in16. Running time depends on the amount of PM10 needed (usually between 1 and 10 days).
- At the end of the incubation time, remove the filter from the sampler and freeze it at -20 °C until use.
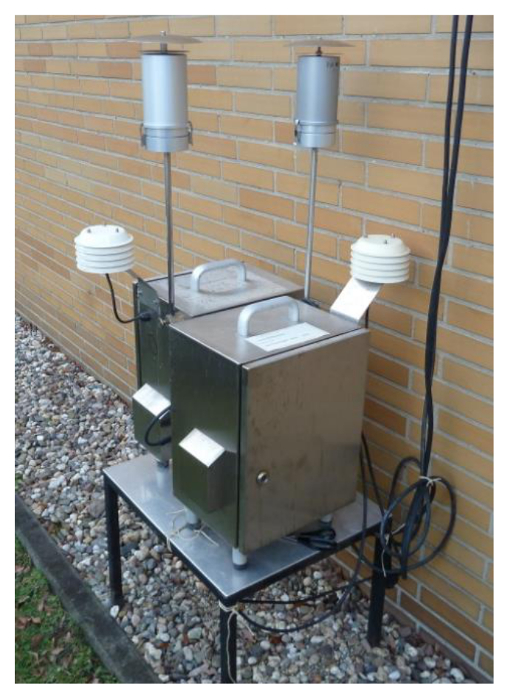
Figure 1. Low volume PM10 sampler. Example of a low volume PM10 sampler. Please click here to view a larger version of this figure.
2. PM10 Removal and Particle Count
- Let the PTFE filter thaw for about 5 min. Then, put the filter in a clean polystyrol Petri dish (Figure 2A). Take a new Petri dish for each filter, if more than one filter is processed.
- Subsequently, overlay the PTFE filter with phosphate-buffered saline (PBS). This protocol is established for a final PM10 concentration of 8x10⁶ particles per ml (see step 3.3). To obtain at least that concentration, use the following empirical volume of PBS to overlay the filter with: If the PM10 collection time was <2 days, use 2 ml. For incubation times ≥2 days, use 4 ml.
NOTE: In order to increase the particle concentration of the PM10 suspension, suspensions from different filters can be pooled, if this is appropriate. - Hold the PTFE filter with tweezers and brush with an electrical toothbrush with a sensitive brush head for 1 min (Figures 2B, 2C). Transfer the particle-PBS-suspension, hereafter termed PM10 suspension, to a clean reaction tube.
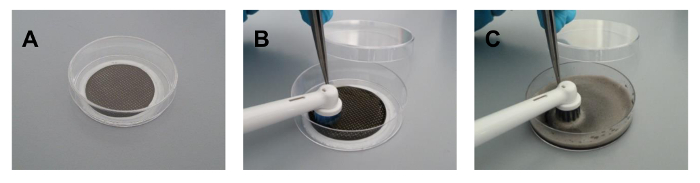
Figure 2. PM10 removal with an electrical toothbrush. A polytetrafluoroethylene filter with sampled PM10 is placed in a polystyrol Petri dish (A) and is overlaid with 4 ml PBS. Then, PM10 is removed with an electrical toothbrush (B: before brushing and C: after brushing for 1 min). Please click here to view a larger version of this figure.
- Measure the concentration of PM10 particles, e.g., by use of a particle counter. Dilute an adequate volume of PM10 suspension such as 50 µl in 10 ml isotonic measurement buffer, measure three times and calculate the mean total number of particles per ml. Be sure to use a particle counter which can detect particles of the relevant size.
3. Bet v 1 Staining
- Calculate the number of reaction tubes required for analysis of the sample: At least three reaction tubes are needed: (i) one tube with sample only (native control) (ii) one tube with sample plus secondary antibody (negative control), and (iii) one tube with sample plus primary and secondary antibody (specific sample). If measured for the first time, prepare at least two reaction tubes for (i) (ii), and (iii) to have enough material to properly adjust cytometer settings (see step 4.1).
- Calculate the amount of PM10 suspension required for the number of reaction tubes. Each reaction tube requires 50 µl of suspension.
- Adjust the particle concentration measured in step 2.4 for the volume of suspension calculated in step 3.2 to a final concentration of 8x10⁶ particles per ml by adding an appropriate amount of PBS.
NOTE: The remaining PM10 suspension may be frozen at -20 °C for future experiments, although for this protocol freshly prepared PM10 suspension is recommended. - Block unspecific binding by supplementing the PM10 suspension with bovine serum albumin (BSA) at a final concentration of 0.02%, using a stock solution such as 1% BSA prepared with PBS. Vortex briefly and incubate for 20 min at room temperature.
- For each sample to be analyzed by flow cytometry, transfer 50 µl of the suspension from step 3.4 to a clean reaction tube. Add a monoclonal mouse antibody against Bet v 1 at a final concentration of 0.02 µg/µl to the reaction tubes designated for specific staining, vortex briefly and incubate for 60 min at room temperature.
- Let the reaction tubes with the PM10-BSA suspension designated for the native control and the negative control also stay for 60 min at room temperature.
- Wash all samples by adding 500 µl PBS supplemented with 0.02% BSA to each reaction tube, vortex briefly and centrifuge the samples subsequently at 4,700 x g for 5 min at room temperature. Discard the supernatant carefully by using a vacuum pump.
- Repeat step 3.6.
- Determine the total amount of APC-labeled secondary anti-Mouse IgG1 antibody needed: 1 µg antibody dissolved in 50 µl PBS supplemented with 0.02% BSA per reaction tube. Dilute the appropriate quantity of antibody with the respective volume of PBS supplemented with 0.02% BSA.
- Add 50 µl of diluted secondary antibody to all reaction tubes except for the reaction tube designated for the native control. Supplement the latter with 50 µl PBS supplemented with 0.02% BSA. Vortex all samples for a few seconds.
- Incubate all samples for 30 min in the dark.
- Repeat step 3.6 twice.
- Add 50 µl PBS to each reaction tube, vortex and analyze the samples on a flow cytometer.
4. Flow Cytometric Analysis
- Using the native control, adjust the following cytometer parameters to optimize data analysis.
- By using the forward scatter (FSC) threshold controller displayed on the device control board, set the FSC threshold at the lowest value (200) and start the analysis.
- By using the scatter voltage controller, adjust the FSC and sideward scatter (SSC) in that way that all PM10 particles can be detected and that the population of particles is located approximately in the middle of the FSC axis and in the lower half of the SSC axis.
- By using the fluorescence voltage controller, adjust the APC voltage and another fluorescence voltage like fluorescein isothiocyanate (FITC), which does not emit at the same wave length like APC, if necessary. Make sure, that all particles are visible in the lower half of both fluorescence axes.
- Consecutively, examine each sample including the native control and store the FSC, SSC, APC, and FITC data of at least 10,000 particles per sample.
- Evaluate the data with the respective software. Adsorbed allergen content in the specific sample can be quantified in two ways:
- Analyze the APC fluorescence intensity of all particles (median value) as a measure of Bet v 1 load over all PM10 particles.
NOTE: If the specific sample contained allergen, APC fluorescence intensity should increase in the specific sample compared to the negative control. In contrast, other fluorescence intensities (e.g., FITC fluorescence intensity) should not significantly change. - Calculate the percentage of PM10 particles with bound anti-Bet v 1 antibody. Thereby, in the negative control, set a gate around the particles considered APC positive, copy and paste this gate into the specific sample and subtract the percentage of APC positive particles in the negative control from the percentage of APC positive particles in the specific sample.
- Analyze the APC fluorescence intensity of all particles (median value) as a measure of Bet v 1 load over all PM10 particles.
Results
Bet v 1 allergen adsorption to PM10>0.5 particles was quantified by indirect antibody staining and subsequent analysis on a flow cytometer. A PM10 sample from high pollen season served as template. As stated in step 3.1, the negative control consisted of PM10 particles incubated with APC labeled secondary antibody only (Figure 3A). PM10 particles stained with anti-Bet v 1 antibody plus secondary antibody displayed the allergen loaded particles (Figure 3B). As described in step 4.3, two ways of quantifying the allergen load were used: On the one hand, the median value of the APC fluorescence intensity of all particles was analyzed being 137 for the negative control and 904 for the specific sample. On the other hand, the percentage of particles with bound anti-Bet v 1 antibody was determined: A gate was set around the APC positive particles in the negative control and subsequently copied and pasted into the specific sample. In the negative control, 3% of the PM10>0.5 particles were considered APC positive. This percentage of false positive particles was subtracted from the percentage of positive particles in the specific sample thus resulting in 77.5% APC positive PM10>0.5 particles in the specific sample. To prove that the observed binding of the anti-Bet v 1 antibody was specific, binding capacity was blocked with the corresponding antigen prior to staining. This diminished binding of the anti-Bet v 1 antibody by 69%, if quantified by APC fluorescence intensity, and by 84%, if quantified by percentage of Bet v 1 positive PM10>0.5 particles (Figure 3C).
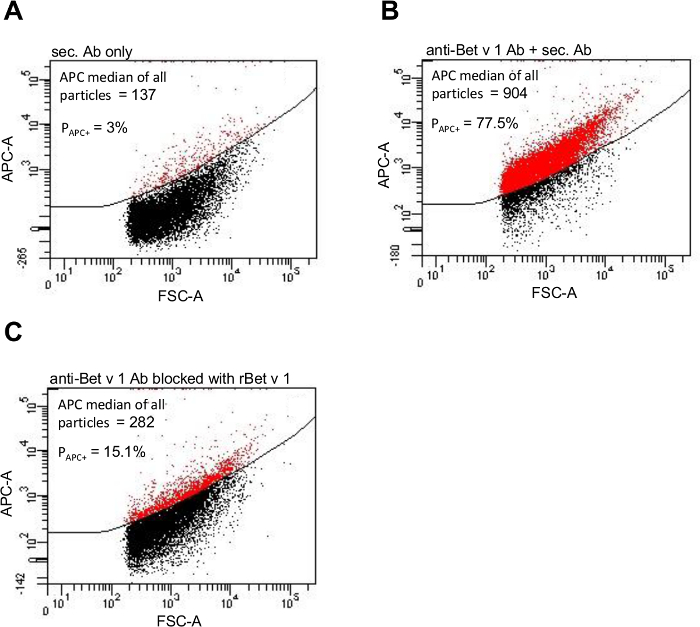
Figure 3. Particle-bound Bet v 1 allergen can be visualized by flow cytometry. APC fluorescence intensity of a PM10 sample from high pollen season stained only with the APC labeled secondary antibody (A), stained with the anti-Bet v 1 primary antibody and subsequently with the APC labeled secondary antibody (B), and after blocking the primary antibody with recombinant Bet v 1 antigen (C). The gate PAPC+ was set around the particles considered APC positive (displayed in red) and respective percentages are given. This figure has been slightly modified from11. Please click here to view a larger version of this figure.
To test whether this method could be adopted to reveal differences in the amount of adsorbed Bet v 1 content of PM10>0.5 samples from high and from low pollen season, 13 PM10 samples from high and 6 PM10 samples from low pollen season were analyzed. Figure 4 depicts significant differences in the APC fluorescence intensity and in the proportion of Bet v 1 positive PM10>0.5 particles of PM10 samples from high pollen season compared to PM10 samples from low pollen season. Both quantification methods hereby showed similar results.
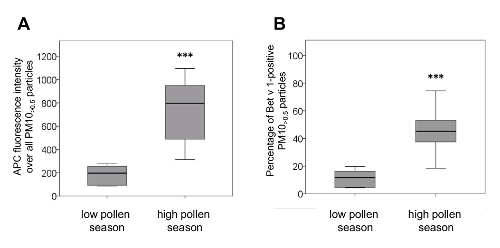
Figure 4. PM10 samples from low and high pollen season differ in their amount of adsorbed Bet v 1. Low pollen season PM10 was sampled in autumn/winter 2013 (n=6), high pollen season PM10 in May 2012 and 2013 (n=13). (A) The APC fluorescence intensity of PM10>0.5 particles from high pollen season was significantly higher than from low pollen season (median/min/max high pollen season: 796/313/1097; median/min/max low pollen season: 197/85/277). (B) PM10 from high pollen season contained significantly more Bet v 1-positive PM10>0.5 particles than PM10 from low pollen season (median/min/max high pollen season: 45.2/18.5/74.5; median/min/max low pollen season: 11.8/4.4/19.8). Box plots show median values (inner line of the box), 25. and 75. percentiles, respectively (lower and upper borders of the box) and minimum and maximum values (whiskers). ***p<0.001 versus low pollen season, Mann Whitney U test. This figure has been slightly modified from11. Please click here to view a larger version of this figure.
Discussion
A critical step of the protocol is the use of an appropriate filter for the collection of PM10 particles from ambient air (see step 1.1). The filter has to be strong enough to endure brushing with an electrical toothbrush, and not all filter materials fulfill this requirement. The staining protocol was established with a PM10 particle concentration of 8x10⁶ particles per ml. However if the material is limited and pooling of samples is not appropriate, the method will probably function as well, but the antibody concentrations (see steps 3.5 and 3.8) might have to be adjusted.
Bet v 1 staining of PM10 particles did not result in distinct populations of positively and negatively stained particles. This might be caused by the varying amounts of Bet v 1 allergen adsorbed to each of the particles ranging from very little up to a high amount. This could result in the expansion of the APC signal thus shifting the population towards APC positivity. As it is difficult to separate the positive from the negative particles, two quantification methods were used to determine the differences in the Bet v 1 content of the PM10>0.5 specimens: (i) relative quantification by measuring the median APC fluorescence intensity of all particles, and (ii) determining the percentage of APC positive particles. Regarding the Bet v 1 load of particles from low and high pollen season PM10>0.5, both methods revealed similar results. Still, relative quantification by median fluorescence intensity of all particles is recommended as it is independent of placing the gate and therefore probably less error-prone.
To date many studies examine the allergen content in ambient air particulate matter by extracting the respective allergen and subsequent quantification with ELISA5,12-14,17. There is a fundamental difference between the procedure described here and the quantification with ELISA: ELISA quantifies the extracted and dissolved antigen, while flow cytometry analyzes the particle-bound antigen. By means of ELISA the Bet v 1 load of the tested PM10 samples (n=8) was below the detection limit of 1.2 ng/ml (data not shown). Similarly, Buters and others identified no Bet v 1 in the PM <2.5 µm fraction and only about 7% in the 10 µm >PM >2.5 µm fraction, but more than 93% in the PM >10 µm fraction of ambient air13. The contrasting results of the ELISA on the one hand and the FACS analysis on the other hand, may be caused by differences in the detection method in conjunction with divergent sensitivity. Further research however is needed to fully understand this difference.
A method to visualize particle-bound antigen is scanning electron microscopy10,14. By scanning electron microscopy, Ormstad et al. visualized Bet v 1 on the surface of suspended particulate matter soot particles sampled in the high pollen season and to a lesser extent on particles sampled in the low pollen season15. Additionally, allergens from pollen, latex and also β-glucans were found to be adsorbed to combustion particles in ambient air10. This method, however, does not allow quantification of the particle-bound allergen.
By use of flow cytometry, particle-bound Bet v 1 allergen could be quantified. Thus, flow cytometry may offer a new way to characterize the 10 to 0.5 µm biological fraction of PM10 as with other suitable antibodies on hand, this method might be extended to the detection of other antigens on ambient air particles, e.g., mold, dust mite allergens or LPS. As PM10 particles adsorb not only biological material, but also chemicals and metals quite easily, unspecific binding of antibodies could, however, pose a problem. If a new antibody is tested, a critical step is to prove specific binding. This can be done by, for example, blocking the binding capacity of the specific antibody with the corresponding antigen prior to staining11.
As Bet v 1 content of ambient air can differ from birch pollen count12,13,18, allergic symptoms might perhaps correlate better with allergen level than with pollen count14,18. Hence, the presented method in conjunction with clinical data enables to examine in future experiments whether allergic reactions to birch correspond to the Bet v 1 allergen load of PM10>0.5.
Disclosures
The authors have nothing to disclose.
Acknowledgements
The authors would like to thank Katrin Bossmann, Anett Neumann and Eike Wolter (German Environment Agency) for their valuable preparatory work.
Materials
| Name | Company | Catalog Number | Comments |
|---|---|---|---|
| Teflon filter | Pall Life Sciences, USA | R2PL047 | 47 mm, 1.0 µm |
| low volume sampler | Sven Leckel Ingenieur Büro GmbH, Germany | LVS3 | air flow of 2.3 m3/hr |
| Phosphate-buffered saline | Biochrom, Germany | L1825 | without Ca/Mg, low endotoxin |
| electrical toothbrush | Braun, Germany | Oral-B Vitality Sensitive | |
| Casy cell counter | Schärfe System GmbH, Germany | Model TTC | range of detectable particle size: 0.7 µm to 45 µm |
| FACSCanto II | Becton Dickinson, USA | 3-laser, 8-color (4-2-2) | |
| FACS Diva Software v6.1.3 | Becton Dickinson | ||
| bovine serum albumin (BSA) | Sigma-Aldrich, USA | A2153-10G | |
| monoclonal mouse IgG1 antibody against Bet v 1 | Indoor Biotechnologies, UK | MA-3B4 | clone MA-3B4 |
| APC (Allophycocyanin)-labeled secondary anti-Mouse IgG1 antibody | Becton Dickinson | 560089 | clone A85-1 |
| SPSSTM software version 18 | PASW Statistics 18, Hongkong, China | ||
| Petri Dish | Gosselin, France | BP50-02 | D 55 mm, H 15 mm |
| FACS Tube | Becton Dickinson, USA | REF 352054 | 5 ml Polystyrene |
| CASYton | Roche Germany | REF 05651808001 | |
| Matrix Blank Tubes | Thermo Scientific, USA | 4140 | 1.4 ml, PP |
| Centrifuge | Heraeus, Thermo Scientific | Megafuge 40R | |
| Vacuum Pump | INTEGRA Biosciences AG, Switzerland | Model 158 320 | Inetrgra Vacusafe |
| recombinant Bet v 1a antigen | Indoor Biotechnologies, UK | LTR-BV1A-1 | Concentration: 2.0 mg/ml |
References
- Cakmak, S., Dales, R. E., Coates, F. Does air pollution increase the effect of aeroallergens on hospitalization for asthma? J Allergy Clin Immunol. 129 (1), 228-231 (2012).
- Barraza-Villarreal, A., et al. Air pollution, airway inflammation, and lung function in a cohort study of Mexico City schoolchildren. Environ Health Perspect. 116 (6), 832-838 (2008).
- Chen, B. Y., et al. The association of ambient air pollution with airway inflammation in schoolchildren. Am J Epidemiol. 175 (8), 764-774 (2012).
- Cyprowski, M., Buczynska, A., Szadkowska-Stanczyk, I. Indoor allergens in settled dust from kindergartens in city of Lodz, Poland. Int J Occup Med Environ Health. 26 (6), 890-899 (2013).
- Brough, H. A., et al. Distribution of peanut protein in the home environment. J Allergy Clin Immunol. 132 (3), 623-629 (2013).
- Galli, S. J., Tsai, M., Piliponsky, A. M. The development of allergic inflammation. Nature. 454 (7203), 445-454 (2008).
- World Health Organisation, R. O. f. E. Phenology and human health: allergic disorders: report on WHO meeting Rome, Italy. 16-17 January 2003, Copenhagen, Denmark, , WHO Regional Office for Europe. Chicago. 256(2003).
- Wuthrich, B., Schindler, C., Leuenberger, P., Ackermann-Liebrich, U. Prevalence of atopy and pollinosis in the adult population of Switzerland (SAPALDIA study). Swiss Study on Air Pollution and Lung Diseases in Adults. Int Arch Allergy Immunol. 106 (2), 149-156 (1995).
- Grote, M., Valenta, R., Reichelt, R. Abortive pollen germination: a mechanism of allergen release in birch, alder, and hazel revealed by immunogold electron microscopy. J Allergy Clin Immunol. 111 (5), 1017-1023 (2003).
- Namork, E., Johansen, B. V., Lovik, M. Detection of allergens adsorbed to ambient air particles collected in four European cities. Toxicol Lett. 165 (1), 71-78 (2006).
- Süring, K., et al. PM10 contains particle-bound allergens: Dust analysis by Flow Cytometry. Env Technol Inn. 5, 60-66 (2016).
- Schappi, G. F., Suphioglu, C., Taylor, P. E., Knox, R. B. Concentrations of the major birch tree allergen Bet v 1 in pollen and respirable fine particles in the atmosphere. J Allergy Clin Immunol. 100 (5), 656-661 (1997).
- Buters, J. T., et al. The allergen Bet v 1 in fractions of ambient air deviates from birch pollen counts. Allergy. 65 (7), 850-858 (2010).
- Buters, J. T. M., et al. Release of Bet v 1 from birch pollen from 5 European countries. Results from the HIALINE study. Atmos Environ. 55, 496-505 (2012).
- Ormstad, H., Johansen, B. V., Gaarder, P. I. Airborne house dust particles and diesel exhaust particles as allergen carriers. Clin Exp Allergy. 28 (6), 702-708 (1998).
- Sven Leckel Ingenieurburo GmbH. LVS3/MVS6. , Available from: http://www.leckel.de/index.php?option=com_docman&task=doc_download&gid=18 (2016).
- Brough, H. A., et al. Peanut protein in household dust is related to household peanut consumption and is biologically active. J Allergy Clin Immunol. 132 (3), 630-638 (2013).
- Jochner, S., et al. Seasonal variation of birch and grass pollen loads and allergen release at two sites in the German Alps. Atmos Env. , (2015).
Reprints and Permissions
Request permission to reuse the text or figures of this JoVE article
Request Permission