Metabolic competency of in vitro systems is a key requirement for the biotransformation and disposition of drugs and toxicants. In this protocol, we describe the application of reference metabolic probes to assess phase I metabolism in cell cultures.
Method Article
Mass Spectrometry and Luminogenic-based Approaches to Characterize Phase I Metabolic Competency of In Vitro Cell Cultures
In This Article
Summary
Abstract
Xenobiotic metabolizing enzymes play a key function in the biotransformation of medicines and toxicants by adding functional groups that increase solubility and facilitate excretion. On some occasions those structural modifications lead to the formation of new toxic products. In order to reduce animal testing, chemical risk can be assessed using metabolically competent cells. The expression of metabolic enzymes, however, is not stable over time in many in vitro primary culture systems and is often partial or absent in cell lines. Therefore, the study of medicines, additives, and environmental pollutants metabolism in vitro should ideally be conducted in cell systems where metabolic activity has been characterized. We explain here an approach to measure the activity of a class of metabolic enzymes (Human Phase I) in 2D cell lines and primary 3D cultures using chemical probes and their metabolic products quantifiable by UPLC mass spectrometry and luminometry. The method can be implemented to test the metabolic activity in cell lines and primary cells derived from a variety of tissues.
Introduction
Xenobiotic metabolism is the process through which chemicals foreign to the body are modified by the addition of hydrophilic groups and conjugates to facilitate their excretion1. Typically the metabolism of xenobiotics is a two-step process with Phase I consisting mostly of an oxidation with the addition of one or multiple hydroxyl groups1,2. In Phase II, the hydroxyl groups are used as acceptors for a hydrophilic conjugate such as glucuronide or a sulfate moiety1,2. If an acceptor group is already present on the molecules, the conjugation step can happen independently of Phase I metabolism. Each reaction is performed by a specific group of enzymes, e.g., CYPs (cytochrome P450s), that catalyze the hydroxylation (Figure 1) and dealkylation of chemical substrates3. Conjugation is catalyzed by sulfotransferases, UDP-glucuronosyltransferases (Figure 1), glutathione-S-transferases and N-acetyltransferases4. Each tissue and organ will have a specific metabolic enzyme expression profile, with the liver expressing most of those proteins.
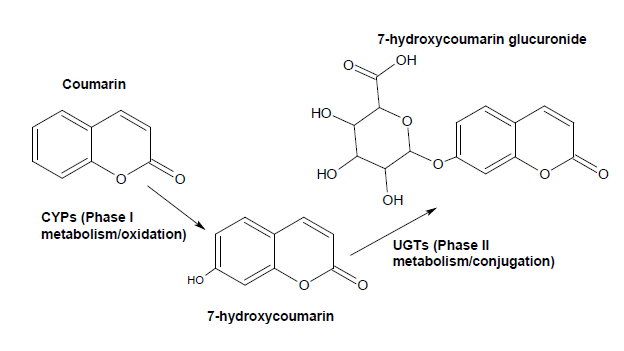
Figure 1: Example of Phase I and Phase II Metabolism for Coumarin. CYP2A6/CYP2A13 catalyze the 7-hydroxylation of coumarin. 7-hydroxycoumarin is conjugated to a glucuronide moiety by phase II enzymes UGTs, with UGT1A6 and UGT1A9 showing the highest activity.
Understanding the metabolism of xenobiotics is critical in the evaluation of drug safety and for chemical risk assessment for two reasons: the reaction kinetics will determine how long a drug or chemical will remain in the body in an active or inactive form before excretion; and the parent compound can be modified to a more reactive, unstable and toxic species by metabolic enzymes. Such reactions also known as "bioactivation" are mostly driven by phase I CYP enzymes but also on rarer occasions by phase II conjugation5.
Based on this, the ability of an in vitro model to accurately predict the risk associated with a drug or a chemical is highly dependent on the metabolic competency of the cell system. Cell lines derived from diseased tissues or from transformation of normal cells often lose part if not all of the metabolic enzyme profile representative of their tissue of origin6. The maintenance of the normal metabolic enzyme profile appears better in primary cell cultures (at least in short term cultures) and is further improved if the tissue is cultured in a matrix allowing it to retain its 3D structure1. Therefore, the characterization of the metabolic competency of an in vitro cell system is an important preliminary step in guiding the decision regarding which cell model is appropriate to conduct chemical safety evaluations.
In this paper we present a protocol to profile the activity and expression of Phase I CYP enzymes in vitro with examples of their application with a hepatic cell line7 and 3D primary lung cell cultures8. CYP specific substrates, their metabolic products and inhibitor controls are described along with mass spectrometry- and luminogenic-based quantification methods. Since some CYPs are inducible and others are constitutive, examples will also be given for those two scenarios.
Protocol
NOTE: The general workflow for the metabolic activity assay is outlined in Figure 2. Each step of this workflow is subsequently detailed in the next paragraphs. Detailed tables of reagents and equipment are given in the Table of Materials.
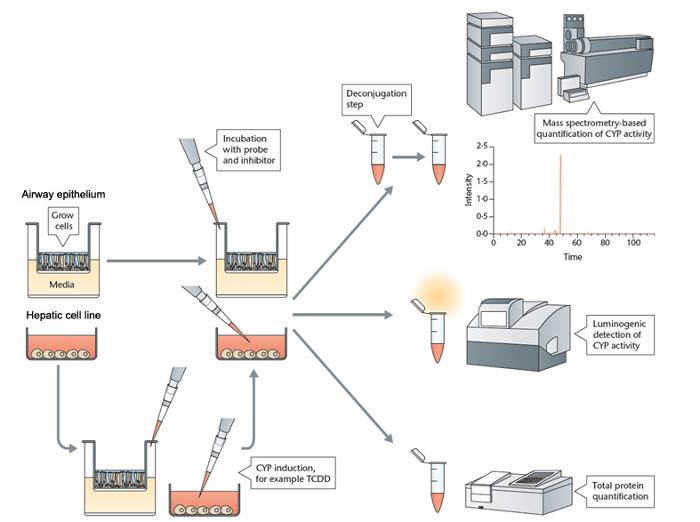
Figure 2: Workflow for the Metabolic Probe Assay. The cells are seeded and grown to adequate density. A CYP induction step might be required depending on the enzyme activity assayed. The probe substrate and inhibitor is added to the cell culture. After an incubation period, the medium is collected for analysis and the cells are lysed for protein quantification. The medium is processed for analysis of the metabolic product of the probe substrate by mass spectrometry or luminometry. Please click here to view a larger version of this figure.
1. Cell Culture
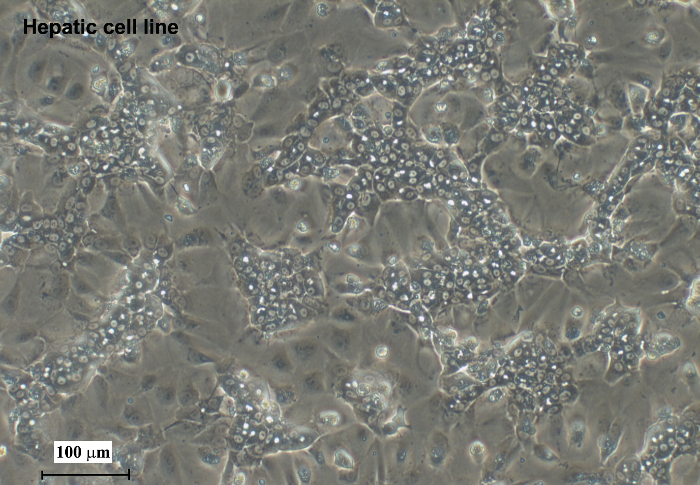
Figure 3: Light Transmission Micrography of a Hepatic Cell Line Culture. The cell line described in this protocol5 typically differentiate with a 50% split between cholangiocytes and hepatocytes in culture (100x). Scale bar = 100 μm. Please click here to view a larger version of this figure.
- Hepatic cell line culture
NOTE: A commercially available hepatic cell line was used as an example of metabolically competent cells. The cell line was derived from a hepatocarcinoma caused by viral infection7. At confluency, this cell line differentiates into cholangiocyte- and hepatocyte-like cells (Figure 3) and further details can be found in Guillouzo7. The inclusion of 2% DMSO to the culture medium supports the differentiation of this cell line and expression of a variety of CYPs.- Remove the cryogenic vials with cells from the liquid nitrogen and place on dry ice for transport. Transfer the cryovial to a water bath pre-warmed to 37 °C for 1-2 min, and sterilize the outside of the vial with 70% ethanol before placing in a laminar flow hood.
- Whilst working under sterile conditions, carefully open the cryogenic vial to release any excess pressure and pipette the contents of the cryogenic vial into a 10 mL tube filled with 9 mL of pre-warmed Williams' E medium at 37 °C.
- Centrifuge the solution for 10 min at 400 x g at room temperature, discard the supernatant, and resuspend the cells in 5 mL of proprietary thaw medium pre-warmed at 37 °C, supplemented with glutamine or a glutamine supplement (2 mM final concentration) (Williams' E + glutamine supplement + thaw supplements).
- Count viable cells using a 500 μL aliquot with a cell counter or any other suitable cell counting technique.
- Seed the cells in a 24-well collagen-coated plate at a density of 0.6 x 10⁶ viable cells/well in a final volume of 0.5 mL of thaw medium.
- Place the plate(s) in an incubator at 37 °C with a 5%/95% CO2/air and 100% relative humidity.
- 24 h after seeding the cells, replace the medium with 0.5 mL of pre-warmed maintenance/metabolism working medium (Williams' E + glutamine supplement + metabolism supplement (this medium already contains DMSO)). Change the medium every two days.
- After a few days in culture the cells form a sub-confluent trabecular structure (Figure 3). The optimum metabolic activity is typically observed between day 7 and 10 and is lowest at day 4.
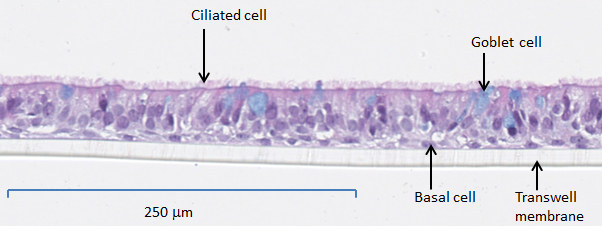
Figure 4: Cross Section of Alcian Blue Stained Airway Cells Grown at the Air-liquid Interface8.
Ciliated, mucus producing and basal cells are clearly visible. Scale bar = 250 μm.
- Differentiated airway epithelium cultures
NOTE: The protocol is shown with a commercially available fully differentiated primary airway epithelium grown at the air-liquid interface on an insert8 (Figure 4). The tissue culture retains a mucocilliary phenotype and cell polarity8. Cells can be of nasal or bronchial origin. Here, use human nasal cells. The cells are delivered on a culture plate format with 24 inserts at the air-liquid interface. To facilitate transport and avoid medium spillage the inserts are shipped with the basal section embedded in an agarose matrix mixed with culture medium.- Upon delivery of the cells, sterilize the plates containing the 24 inserts with a 70% ethanol solution before placing in a clean laminar flow hood.
- Prepare a sterile 24-well plate by adding pre-warmed 700 μL proprietary culture medium.
- Using sterile tweezers transfer the cell inserts to the new plate pre-loaded with medium by gently dislodging the insert from the agarose matrix.
- Place the plate(s) in an incubator at 37 °C with a 5% / 95% CO2/air and 100% relative humidity.
- Every 2 days transfer the inserts to a new sterile 24-well plate pre-loaded with 700 μL warm proprietary airway cell culture medium.
- Assess the integrity of the airway tissue using methods, such as trans-epithelial resistance (TEER), or cilia beat frequency (CBF) using a microscope fitted with a live video imaging system9. The measurement of TEER and CBF is described in Kuehn10.
2. CYP Activity Quantification in Cell Cultures
NOTE: As a general rule, solvents such as DMSO and methanol can be used to prepare stock solutions for the different metabolic probes and inhibitors presented in this paper. However, it is recommended to keep the final DMSO concentration in the culture medium to a minimum (1% or lower) since high concentrations can inhibit metabolic enzymes. When possible, it is also recommended to use phenol red free and serum free medium during the incubation with metabolic probes since phenol red can interfere with CYPs and Phase II enzyme activity and serum component such as albumin can decrease the probe availability. It is not always possible to strictly adhere to these guidelines. For instance, airway cell culture medium is proprietary and contains phenol red. Proprietary hepatic cell line metabolism medium7 already contains DMSO above 1% as it is required for the cells to adopt the hepatocyte-like phenotype.
NOTE: Finally, here, the term specific probe/inhibitor is used but this terminology has to be considered with caution. Indeed, it is very rare for a metabolic probe to be an enzyme exclusive substrate. The probes described here, however, have a high affinity for their enzyme target and therefore are regarded as reliable markers of activity.
- Metabolic probes, inducers, and inhibitors
- Probes using Mass Spectrometry based methods
NOTE: The probes and inhibitors described in this section are suitable to test the activity of CYP2As11, CYP1A212,13, CYP2B67,14, CYP2F115,16, and CYP2E117 by UPLC-mass spectrometry. The probes, inhibitors and corresponding CYP are described in Table 1 with corresponding references. Table 1 also lists the metabolic product of the CYP activity which is quantified by mass spectrometry. All work involving tissue culture and solutions for use in tissue culture is to be carried out in a sterile tissue culture hood. A stock solution can be prepared in DMSO for all the probe substrates.- Prior to the experiment prepare two series of cell inserts or wells, use one series for the inhibition experiment, the other for the metabolic probe only. Prepare a third series of cells as a medium blank control. They can be on separate plates or in the same plates with a minimum of three replicates. An example of plate layout is presented in Figure 5.
- On the day of the experiment, replace the cell culture medium with 450 μL of fresh medium.
- Prepare in a sterile hood a 10x concentration of the following solutions using the cell culture medium. Mix 10x CYP probe, 10x CYP inhibitor, and 10x CYP inhibitor plus 10x probe.
NOTE: Master stock solutions of inhibitor and probe can be prepared in 100% DMSO (e.g., 1,000x stocks) and further diluted in media to obtain a 10x solution in order to avoid a final DMSO concentration in excess of 1% with the cell culture. The final 1x concentrations that are aimed for the incubation with the cells are shown in Table 1. - Filter the different 10x probe solution with a 0.2 μm syringe filter.
- Add 50 μL of medium containing the 10x CYP inhibitor to the series of cells prepared for the inhibition experiment and pre-incubate for 30 min.
- Replace the medium of cells in the inhibition series with 450 μL of fresh medium and add 50 μL of medium containing both 10x CYP inhibitor and the 10x probe substrate.
- Add to the other cells 50 μL of medium with the 10x probe substrate and add an equivalent amount of vehicle diluted in medium (e.g., DMSO) to the blank cell controls as shown in Figure 5.
- Incubate the cells for 0 - 5 min (time 0, background control) and 16 h in the cell incubator.
NOTE: This incubation time was used successfully with the airway cells and hepatic cell line; however fresh primary hepatocytes have a high metabolic competency, pending the quality of the cell preparation and genetic makeup of donor, hence shorter times (e.g., 2-4 h) might be suitable. It is always recommended to perform a time course experiment when testing different cell lines or cell types. - At the end of the incubation period, collect the medium in separate labelled tubes for quantification of the metabolic product of the probes. Freeze the medium for future processing.
- Lyse the cells for protein quantification.
NOTE: Any standard protein quantification kit and protocol is suitable for this step. BCA is one suitable option. This step is optional if the cells have to be used in another assay.
- Medium treatment
NOTE: The medium collected from the incubation stage contains the parent probe chemical as well as its metabolic products. To measure a specific CYP activity only the product of the reaction catalyzed by the CYP of interest should be quantified. Phase I metabolism products are often processed in tandem with phase II metabolism (conjugation) and therefore cannot be detected as such. Thus in order to obtain the most accurate quantification of a CYP activity, a deconjugation step is required to remove any Phase II metabolism modification. Since conjugation of Phase I metabolites often involves glucuronidation or sulfation, deconjugation is achieved by treatment of the samples by glucuronidases and sulfatases18. Glucuronidase and sulfatase activity is pH dependent with highest glucuronidase activity being achieved at pH 4.5-5.0 and sulfatase activity being highest at pH 6.0-6.5. Therefore, this step requires pH adjustment. In the method described here, we measure the pH using pH strips for practical reasons since most pH meter probes do not fit in a 1.5 mL microcentrifuge tube. Commercially available pH strips can be found with a resolution as low as 0.3 to 0.2 pH units.- Transfer 250 μL of incubation medium to a 1.5 mL microtube and add 4-methylumbelliferone internal standard stock solution to reach a final concentration of 100 nM.
- Adjust the pH of the medium to 4.5-5.0 by adding 1 M HCl. Add 1 μL of HCl at a time and verify pH by pipetting 2 μL of medium onto a pH strip. Reaching a pH of 5.0 would typically require no more than 5-10 μL of 1 M HCl.
- Add 150 units (1.8 μL of an 85,000 unit/mL stock) of β-glucuronidase/arylsulfatase from Helix pomatia and incubate for 1 h at 37 °C. Stop the reaction by adding 250 μL of cold methanol (-20 °C). Store the samples at -20 °C or process further.
- Evaporate the solvent using a vacuum centrifuge at 45 °C. Reconstitute the samples with 500 μL of a 30% acetonitrile:water solution. The samples are ready for mass spectrometry analysis and can be stored at -20 °C in amber glass vials.
- Mass Spectrometry based quantification
NOTE: All the UPLC and mass spectrometer settings are detailed in the dedicated Supplemental Table 1. For a quantitative analysis, establishing a calibration curve is required. The calibration curve is obtained by running a known dilution range of the compound to be quantified. In this case, the calibration curves were generated over 10 different concentrations (Table 2), at least 6 of which should be within 20% of the linear range19. Lowest level of detection is determined as the lowest concentration which gives a signal greater than, or equal to 3x the average background signal. The lowest level of quantification is determined as the sample of lowest concentration which gives a signal greater, or equal to 10x the average background signal both of which are determined over at least 3 independent runs with triplicate samples.- Prepare a serial dilution of a synthetic metabolite in the tissue culture medium according to Table 2, including the internal standard. A final volume of 250 μL per standard dilution is adequate .
- Evaporate the serial dilutions of standard as described in step 2.1.2.4 and resuspend in a volume of 30% acetonitrile:water equivalent to the volume of media prior evaporation (e.g., 250 μL 30% acetonitrile:water if the starting standard solution was 250 μL of medium).
- Add 250 μL of each serial dilution standard to an amber UPLC glass vial for injection in the UPLC-MS autosampler.
- Add the test samples (250 μL) to amber UPLC vials and place them in the UPLC autosampler.
- Randomize all the vials.
NOTE: The mass spectrometer configuration we used is a hybrid triple quadrupole/linear ion trap mass spectrometer coupled to a UPLC detailed in the Supplemental Table 1. Other platforms would have different software and configuration but would follow similar steps to perform the quantification. - Run the UPLC-MS using the settings detailed in Supplemental Table 1 depending on the specific probe to quantify.
- Use the "Quantitate - Build Quantitation method" tool in mass spectrometer quantification tools (Table of Materials) to generate the calibration curve from the acquired synthetic standard and internal standard.
- Use the "Quantitation Wizard" to select the sample batch and samples to quantify and execute the "Quantitation Method". The mass spectrometer quantification software displays a spreadsheet with the quantitation values of the target compound in each test sample.
- Probes using Luminescence based methods
NOTE: Luminogenic probes to measure a range of CYP activities are commercially available; however, not all are suitable for cell based assays. Here, a protocol is presented to measure the activity of CYP1A1/CYP1B1. CYP1A1/1B1 was selected to illustrate how to assay the activity of inducible CYPs and to give an example of how luminogenic probes can be used as an alternative to mass spectrometry-based methods. Table 3 summarizes the concentrations and incubation time we used for the airway cells and the hepatic cell line; however, those might have to be adapted for other cell types. Other luminogenic probes are commercially available and can be used as substrates for a variety of CYPs.- Prepare sufficient cells to include a non-induced control, an induced test, and an induced + inhibitor test. An example of a plate layout is shown in Figure 5B.
- To induce CYP1A1/1B1, incubate the cells with a final concentration of 10 nM TCDD in medium for a period of 72 h (shorter periods of 24 to 48 h may also be suitable).
CAUTION: TCDD is a carcinogen and teratogen. Wear adequate protective equipment, review the supplier MSDS sheet and perform a risk assessment before use. - After this period, remove the medium, rinse the wells with PBS 3 times, and add some fresh medium.
- Prior to incubating the cells with the luminogenic reporter probe, pre-incubate the designated subset of induced cells for 30 min with a final concentration of 10 μM CYP1A1/1B1 inhibitor, α-naphthoflavone, in medium.
- Add the luminogenic probe LUC-CEE (Luciferin 6'-chloroethyl ether) at a final concentration of 50 μM to the non-induced, induced, and induced + inhibitor cells.
- Incubate for 4 h in a cell culture incubator. At the end of the incubation time collect the medium for quantification of the luminogenic probe.
- Transfer 25 μL of culture medium to a white opaque 96 well plate and add 25 μL of luciferin detection reagent supplied by the manufacturer. Incubate for 20 min at room temperature. Read the plate immediately using a luminometer.
- Rinse the cells with PBS and lyse for total protein quantification.
NOTE: This step is optional if live cells are retained for future experiments. It is important to note however that inducers such as TCDD are toxic and will damage the cells.
- Probes using Mass Spectrometry based methods
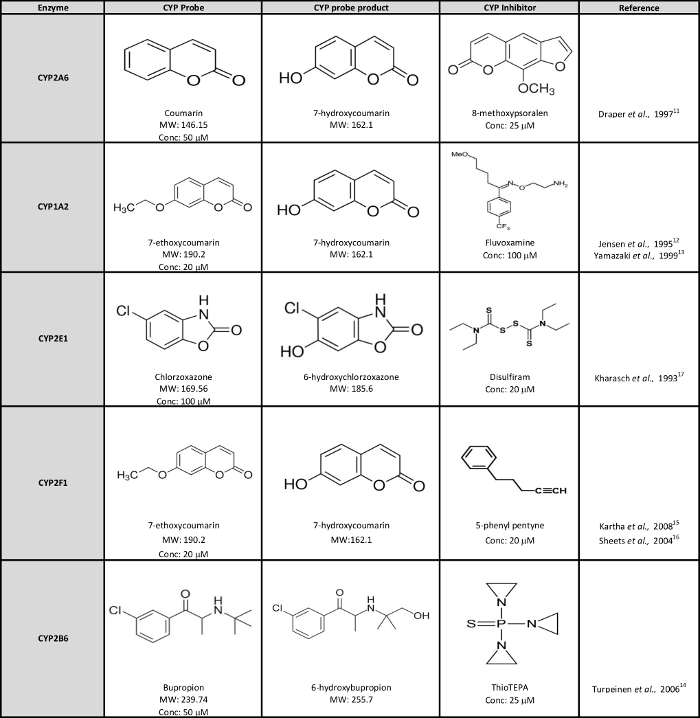
Table 1: List of Metabolic Probes, Products, and Inhibitors with their Corresponding Enzyme. Molecular weight and recommended concentrations used with the airway and hepatic cells are also indicated. Please click here to view a larger version of this figure.
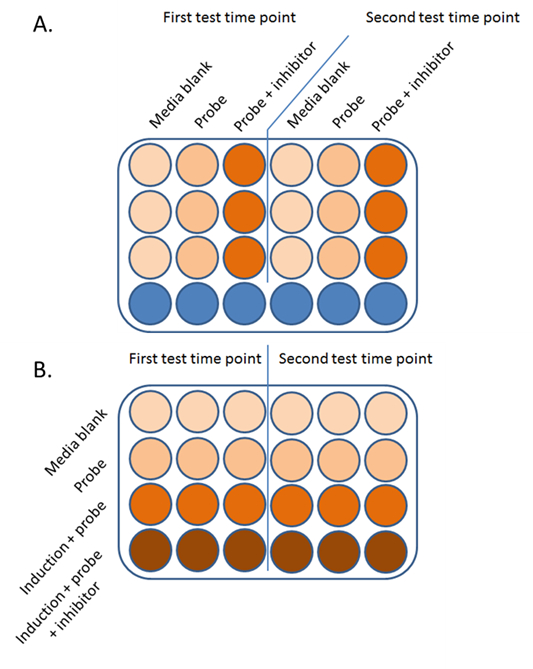
Figure 5: Suggested 24-well Plate Layout to Perform a CYP Assay. (A) The recommended layout for CYPs constitutively expressed includes a series of wells for the blank medium, the metabolic probe, and the metabolic probe plus inhibitor. This layout can be multiplied by the number of time points that are being tested. (B) The example layout for inducible CYPs includes a series of well for a medium blank, a metabolic probe only control, induced cells (e.g., with TCDD) incubated with the probes and incubated with the probes and an inhibitor.
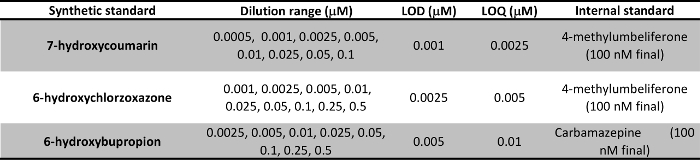
Table 2: Dilution of Synthetic Standards used for the Calibration Curves and Respective LODs and LOQs. The dilution range to use can vary based on the mass spectrometry platform and sensitivity. Here, we used a hybrid triple quadrupole/linear ion trap mass spectrometer linked to a UPLC. Please click here to view a larger version of this figure.
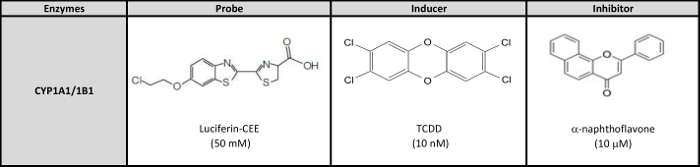
Table 3: Luminogenic Probe, Inducer and Inhibitor for CYP1A1/1B1 Assay. Please click here to view a larger version of this figure.
Results
Examples of metabolic activity measured for two pairs of CYPs (CYP1A1/1B1 and CYP2A6/2A13) in the airway cell cultures from three different donors (airway M360, M370, M417) and the hepatic cell line (Hep line) are shown in Figure 620.
CYP activity measured by luminometry
Figure 6A shows the relative luminescence produced by the CYP1A1/1B1 O-dealkylation activity of Luc-CEE (Luciferin 6'-chloroethyl ether) in airway cells (3 donors) and hepatic cells with and without TCDD induction. CYP1A1/1B1 are highly inducible enzymes and are typically not expressed at a constitutive level in most tissues. As can be seen in Figure 6A, no luminogenic signal is detected when the cells are not induced. When both cell types are pre-incubated with TCDD, a strong CYP1A1/1B1 inducer, a marked luminogenic signal is detected compared to the control (Figure 6A). This indicates that the Luc-CEE probe has been metabolized leading to the release of the luciferin moiety that is quantified subsequently. Overall the activity from the TCDD treated hepatic cell line is lower than for the airway cells, even after total protein normalization. This is not unusual since cell lines tend to be less metabolically active than primary cells. Addition of α-naphthoflavone has a clear inhibitory effect on CYP1A1/1B1 activity in all cell types which further confirms the CYP-dependency of Luc-CEE metabolism.
Quantification of CYP450 metabolites using UPLC-MS
Figure 6B illustrates the quantification of CYP2A6/2A13 activity in airway cells from 3 donors (Airway M343, M345, M347) and hepatic cells (Hep line) after incubation with coumarin in the presence and absence of the inhibitor 8-methoxypsoralen. The data is normalized for total protein. In the 0 min coumarin incubation control, no 7-hydroxycoumarin is detected (Figure 6B). CYP2A6/2A13 are expressed constitutively in certain tissues and therefore after 16 h incubation with coumarin formation of 7-hydroxycoumarin is detected in the different cell types tested, even without induction. When 8-methoxypsoralen, a CYP2A inhibitor is added (Figure 6B), the formation of 7-hydroxycoumarin is considerably reduced.
It should be noted that in the presence of the CYP inhibitor, it is normal to still detect some residual activity as inhibition is rarely complete and since other CYPs might also be able to recognize the substrate but process it far less efficiently. It can also be observed that the recorded metabolic activity can be different between donors when using primary cells as it is visible for CYP2A6 in airway cells (Figure 6B). This is expected as CYP activity is liable to each donor's genotype and polymorphisms.
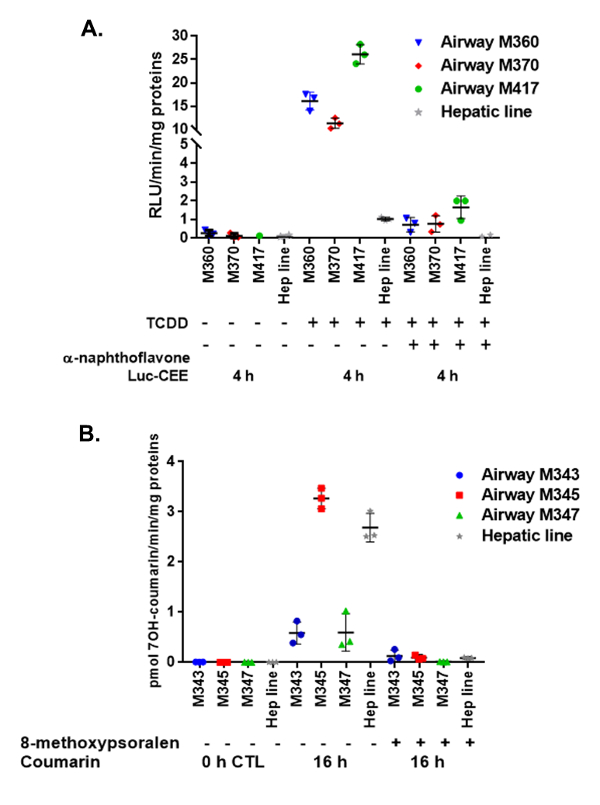
Figure 6: Activity Assay Result for CYP1A1/1B1 Activity (A) and CYP2A6/2A13 activity (B) in the Hepatic Cell Line and in Three Airway Cell Donors (M360, M370, M417). (A) Luc-CEE dealkylation activity is shown with and without induction of CYP1A1/1B1 by TCDD. α-naphthoflavone was used as CYP1A1/1B1 inhibitor. Activity is expressed as relative luminescence units (RLU) normalized by incubation time in minutes (min) and total protein (mg). (B) CYP2A6/2A13 do not require induction as they are expressed constitutively. Coumarin 7-hydroxylation activity in pmol/min/mg proteins is shown at different time points with and without the inhibitor 8-methoxypsoralen. All results are presented as a mean value of three independent measurements with standard deviations of the mean. This figure was modified from Baxter20.
Supplemental Table 1: UPLC and Mass Spectrometer Settings. Please click here to download this file.
Discussion
Currently, many standardized toxicological test systems use engineered bacteria, cell lines, or embryonic cells that are not representative of the normal human metabolism1. This can lead to inaccurate predictions of the potential toxic activity of a chemical or medicine. Innovative in vitro models, such as 3D cell cultures and organ on a chip, are being developed in an attempt to better replicate the normal morphology and metabolic activity of human tissues21,22,23. Metabolic competency is one criterion that can be used to decipher which models are best suited for toxicological assessment and drug biotransformation studies.
The protocol we have outlined in this paper is designed to measure the activity of CYP enzymes using live cells. It is flexible and can be used for different cell systems in 2D or 3D cultures and offers the option to use either a luminogenic probe- or a mass spectrometry-based approach. Both methods are sensitive enough to detect nanogram quantities of materials and only require a small number of cells grown in a multiwell format. They can also be applied to spheroid or cells grown in complex matrices. The selection of the probe substrate is obviously a critical element of the protocol. The specificity of the assay relies on the probe being selective of the CYP enzyme and another layer of assurance can be obtained by the use of a selective CYP inhibitor. The substrates and inhibitors listed in this paper are just a few examples, but others can be found in the literature.
It is important to consider multiple incubation times when working with a new cell type as a negative CYP activity result could be due to the enzyme being expressed at a low level. The addition of a cell type that can be used as a positive control is advisable to ensure that a negative result is not linked to a technical issue and to help with any troubleshooting. Primary hepatic cells are metabolically competent and can be used as control, for example primary hepatocytes in suspension are very easy to use but their viability is limited in time. Hepatic cell lines are possible alternatives which are relatively easy to use as described in this protocol, but some are better than others in terms of metabolic activity6,21.
Since the assay is non-destructive, unless total protein is quantified, it is possible to follow the CYP activity over time in longitudinal studies20. This is an important point because some cells will have variable CYP activity over time in culture. A negative result might be associated with the lack of confluency, progress with the differentiation or dedifferentiation in vitro. In that case, the approach is semi-quantitative since the data is not normalized by the total amount of protein in each cell culture. It is not always possible or recommended to reuse the tissue after measuring the CYP activity as exposure to probes, inhibitors or inducers can have a toxic effect on the tissue as is the case for TCDD.
Cell fractions such as microsomes could also be used to characterize the CYP activity of a given cell type. Microsome preparations, however, require a lot of cell material, the addition of adequate cofactors and buffer to ensure that the enzymes remain active. Using live cells eliminates the tricky microsome preparation step and working out which buffers and cofactors work best.
As a general recommendation, it is a best practice to further characterize the expression profile of CYPs in cell cultures to verify that it matches the enzymatic activity. This additional level of verification is recommended given that the metabolic probes are not entirely specific to a single CYP and it gives increased confidence that the measured metabolic activity is matched by the corresponding enzyme expression. Since CYPs are membrane proteins they are relatively difficult to prepare for western blots, therefore quantitative RT-PCR has been the preferred approach to profile these enzymes20.
It is important to note that this protocol describes a method to assay CYP enzyme activity that only represents one family of metabolic enzymes, albeit an important one. The flexibility of a mass spectrometry approach allows the development of acquisition methods for other metabolic transformations of probe substrates. However, those have to be developed one at a time and there are currently fewer known specific probes and selective inhibitors for other metabolic enzyme families. This gap should be addressed to allow for a comprehensive assessment of the metabolic competency of in vitro cell systems.
Disclosures
A.B. and E.M. were employees of British American Tobacco at the time this manuscript was written. The work described in this manuscript was funded by British American Tobacco, and publication fees for this video-article were paid by British American Tobacco.
Acknowledgements
The authors thank Epithelix Sarl and Biopredic International for providing the airway cells and hepatic cells micrographies and Neil Smith for the figure illustrating the experimental procedure.
Materials
| Name | Company | Catalog Number | Comments |
|---|---|---|---|
| Reagent & Cells | |||
| 2 μm syringe filter | Whatman | UN203NPEORG | |
| 24 well plate | Corning | 3524 | |
| 4-methylumbelliferone | Sigma Aldrich | M1381 | |
| 5-phenyl pentyne | Sigma Aldrich | CD5001437 | |
| 6-hydroxybupropion | Sigma Aldrich | H3167 | |
| 6-hydroxychlorzoxazone | Sigma Aldrich | UC148 | |
| 7-ethoxycoumarin | Sigma Aldrich | 195642 | |
| 7-hydroxycoumarin | Sigma Aldrich | H24003 | |
| 8-methoxypsoralen | Sigma Aldrich | M3501 | |
| acetic acid | Sigma Aldrich | 695092 | |
| acetonitrile | Fisher | A/0626/17 | |
| α-naphthoflavone | Sigma Aldrich | N5757 | |
| BCA kit | Thermo Scientific | 23227 | |
| b-glucuronidase/arylsulfatase | Sigma Aldrich | G0876 | |
| Bupropion | Sigma Aldrich | B102 | |
| Carbamazepine | Sigma Aldrich | C4024 | |
| chlorzoxasone | Sigma Aldrich | C4397 | |
| collagen | Cell Systems | 5005-B | |
| coumarin | Sigma Aldrich | C4261 | |
| disulfiram | Sigma Aldrich | 86720 | |
| fluvoxamine | Sigma Aldrich | F2802 | |
| Glutamax (Glutamine supplement) | Fisher | 35050061 | |
| HepaRG metabolism supplement | Merck | MMAD621 | |
| HepaRG thaw media supplement | Merck | MMADD671 | |
| HepaRG | Merck | MMHPR116 | |
| Luciferin-CEE | Promega | V8751 | |
| methanol | Fisher | M/4056/17 | |
| MucilAir airway cells | Epithelix | EP01 | |
| MucilAir airway cells maintenance media | Epithelix | EP04MM | |
| Phenomenex Kinetex 2.6 μm, PFP 100A | Phenomenex | 00B-4477-AN | |
| TCDD | Sigma Aldrich | 48599 | |
| thioTEPA | Sigma Aldrich | T6069 | |
| Waters Acquity UPLC HSS T3 1.8 µm 2.1 x 50 mm | Waters | 86003538 | |
| Williams’ E media | Fisher | 17704-024 | |
| Name | Company | Catalog Number | Comments |
| Equipment | |||
| UPLC | Waters | Acquity | |
| QTRAP MS | Sciex | ABI Sciex 4000 | |
| QTRAP MS software | Sciex | Analyst 1.4.2 | |
| luminometer | Molecular Devices | SpectraMax M3 | |
| spectrophotometer | Molecular Devices | SpectraMax M3 | |
| cell counter | Beckman Coulter | Vi-Cell XR | |
| rotary evaporator | Eppendorf | Eppendorf-5301 |
References
- Garcia-Canton, C., Minet, E. Metabolic Characterization of Cell Systems Used in In Vitro Toxicology Testing. Encyclopedia of Drug Metabolism and Interactions. , 1-31 (2016).
- Croom, E. Metabolism of xenobiotics of human environments. Prog. Mol. Biol. Transl. Sci. 112, 31-88 (2012).
- Lewis, D. F. 57 varieties: the human cytochromes P450. Pharmacogenomics. 5, 305-318 (2004).
- Jancova, P., Anzenbacher, P., Anzenbacherova, E. Phase II drug metabolizing enzymes. Biomed. Pap. Med. Fac. Univ Palacky. 154, Olomouc. Czech. Repub. 103-116 (2010).
- Dekant, W. The role of biotransformation and bioactivation in toxicity. EXS. 99, 57-86 (2009).
- Donato, M. T., Lahoz, A., Castell, J. V., Gomez-Lechon, M. J. Cell lines: a tool for in vitro drug metabolism studies. Curr. Drug Metab. 9, 1-11 (2008).
- Guillouzo, A., et al. The human hepatoma HepaRG cells: a highly differentiated model for studies of liver metabolism and toxicity of xenobiotics. Chem. Biol. Interact. 168, 66-73 (2007).
- Huang, S., Wiszniewski, L., Constant, S., Roggen, E. Potential of in vitro reconstituted 3D human airway epithelia (MucilAir) to assess respiratory sensitizers. Toxicol. In Vitro. 27, 1151-1156 (2013).
- Sisson, J. H., Stoner, J. A., Ammons, B. A., Wyatt, T. A. All-digital image capture and whole-field analysis of ciliary beat frequency. J. Microsc. 211, 103-111 (2003).
- Kuehn, D., et al. Impact assessment of repeated exposure of organotypic 3D bronchial and nasal tissue culture models to whole cigarette smoke. J. Vis. Exp. , (2015).
- Draper, A. J., Madan, A., Parkinson, A. Inhibition of coumarin 7-hydroxylase activity in human liver microsomes. Arch. Biochem. Biophys. 341, 47-61 (1997).
- Jensen, K. G., Poulsen, H. E., Doehmer, J., Loft, S. Kinetics and inhibition by fluvoxamine of phenacetin O-deethylation in V79 cells expressing human CYP1A2. Pharmacol. Toxicol. 76, 286-288 (1995).
- Yamazaki, H., Tanaka, M., Shimada, T. Highly sensitive high-performance liquid chromatographic assay for coumarin 7-hydroxylation and 7-ethoxycoumarin O-deethylation by human liver cytochrome P450 enzymes. J. Chromatogr. B. Biomed. Sci. Appl. 721, 13-19 (1999).
- Turpeinen, M., Raunio, H., Pelkonen, O. The functional role of CYP2B6 in human drug metabolism: substrates and inhibitors in vitro, in vivo and in silico. Curr. Drug Metab. 7, 705-714 (2006).
- Kartha, J. S., Yost, G. S. Mechanism-based inactivation of lung-selective cytochrome P450 CYP2F enzymes. Drug Metab. Dispos. 36, 155-162 (2008).
- Sheets, P. L., Yost, G. S., Carlson, G. P. Benzene metabolism in human lung cell lines BEAS-2B and A549 and cells overexpressing CYP2F1. J. Biochem. Mol. Toxicol. 18, 92-99 (2004).
- Kharasch, E. D., Thummel, K. E., Mhyre, J., Lillibridge, J. H. Single-dose disulfiram inhibition of chlorzoxazone metabolism: a clinical probe for P450 2E1. Clin. Pharmacol. Ther. 53, 643-650 (1993).
- Graef, V., Furuya, E., Nishikaze, O. Hydrolysis of steroid glucuronides with beta-glucuronidase preparations from bovine liver, Helix pomatia, and E. coli. Clin. Chem. 23, 532-535 (1977).
- Guide to achieving reliable quantitative LC-MS measurements. RSC Analytical Methods Committee. , Available from: http://www.lgcgroup.com/LGCGroup/media/PDFs/Our%20science/NMI%20landing%20page/Publications%20and%20resources/Guides/AMC_LCMS_Guide.pdf (2013).
- Baxter, A., et al. Targeted omics analyses, and metabolic enzyme activity assays demonstrate maintenance of key mucociliary characteristics in long term cultures of reconstituted human airway epithelia. Toxicol. In Vitro. 29, 864-875 (2015).
- Gomez-Lechon, M. J., Tolosa, L., Conde, I., Donato, M. T. Competency of different cell models to predict human hepatotoxic drugs. Expert. Opin. Drug Metab. Toxicol. 10, 1553-1568 (2014).
- Li, Z., et al. Assessment of metabolism-dependent drug efficacy and toxicity on a multilayer organs-on-a-chip. Integr. Biol. 8, Camb. 1022-1029 (2016).
- Takahashi, Y., et al. Three-dimensional (3D) spheroid cultures improve the metabolic gene expression profiles of HepaRG cells. Biosci. Rep. , (2015).
Reprints and Permissions
