The effect of short-term resistance training on elderly people was investigated through the simultaneous use of several methods. Compared to a control group, many improvements were seen, including on muscle aerobic capacity, glucose tolerance, strength, power, and muscle quality (i.e., protein involved in cell signaling and muscle fiber type composition).
Method Article
Improving Strength, Power, Muscle Aerobic Capacity, and Glucose Tolerance through Short-term Progressive Strength Training Among Elderly People
In This Article
Summary
Abstract
This protocol describes the simultaneous use of a broad span of methods to examine muscle aerobic capacity, glucose tolerance, strength, and power in elderly people performing short-term resistance training (RET). Supervised progressive resistance training for 1 h three times a week over 8 weeks was performed by RET participants (71±1 years, range 65-80). Compared to a control group without training, the RET showed improvements on the measures used to indicate strength, power, glucose tolerance, and several parameters of muscle aerobic capacity. Strength training was performed in a gym with only robust fitness equipment. An isokinetic dynamometer for knee extensor strength permitted the measurement of concentric, eccentric, and static strength, which increased for the RET group (8-12% post- versus pre-test). The power (rate of force development, RFD) at the initial 0-30 ms also showed an increase for the RET group (52%). A glucose tolerance test with frequent blood glucose measurements showed improvements only for the RET group in terms of blood glucose values after 2 h (14%) and the area under the curve (21%). The blood lipid profile also improved (8%). From muscle biopsy samples prepared using histochemistry, the amount of fiber type IIa increased, and a trend towards a decrease in IIx in the RET group reflected a change to a more oxidative profile in terms of fiber composition. Western blot (to determine the protein content related to the signaling for muscle protein synthesis) showed a rise of 69% in both Akt and mTOR in the RET group; this also showed an increase in mitochondrial proteins for OXPHOS complex II and citrate synthase (both ~30%) and for complex IV (90%), in only the RET group. We demonstrate that this type of progressive resistance training offers various improvements (e.g., strength, power, aerobic capacity, glucose tolerance, and plasma lipid profile).
Introduction
Aging is associated with a loss of muscle mass (sarcopenia), strength, and power. Reduced strength, and probably even more importantly, power, results in immobility, an increased risk of injury, and a reduced quality of life. Resistance training is a well-known strategy to counteract sarcopenia and deteriorating muscle function. A rough estimate of muscle strength can be obtained from the load or number of achieved repetitions. However, this study obtained more detailed and accurate information on muscle function using an isokinetic dynamometer to gather information on the torque during isometric, concentric and eccentric contraction, as well as on the kinetics of force development.
Aerobic capacity, both at the whole-body level (VO2max) and in skeletal muscle, is reduced in elderly people. The decline in heart rate with age explains a large part of the decrease in VO2max1, but reduced muscle oxidative capacity, largely related to reduced physical activity2, does contribute. Impaired mitochondrial function may also be involved in the development of sarcopenia and insulin resistance3. The muscle aerobic capacity was assessed in muscle biopsies through biochemical analyses of the contents of mitochondrial enzymes and protein complexes located both in the matrix (i.e., citrate synthase) and the inner mitochondrial membrane. In addition, histochemical techniques were used to measure the effect of resistance training on muscle morphology (i.e., fiber type composition, fiber cross-sectional area, and capillary density). An alternative method to assess muscle aerobic capacity would be to use magnetic resonance spectroscopy to measure the rate of creatine phosphate resynthesis after exercise-induced depletion4. This method provides an estimate of the in vivo muscle aerobic capacity but cannot discriminate between mitochondrial dysfunction and circulatory disorders. Furthermore, the high costs of equipment limit the use of this technique in most laboratories. Aerobic capacity (VO2max and mitochondrial density) can be improved by endurance exercise in both young and old people5,6. However, the effect of resistance training on these parameters has been less investigated, especially in elderly subjects, and the results are conflicting7,8,9,10.
Type 2 diabetes is a widespread disease in the elderly population. Physical inactivity and obesity are major lifestyle-related factors explaining the increased incidence of type 2 diabetes. Low-intensity aerobic exercise is often recommended to subjects with reduced glucose tolerance. However, it is unclear how strength training in the elderly affects glucose tolerance/insulin sensitivity11,12. The most accurate way to measure insulin sensitivity is to use the glucose clamp technique, where the blood glucose is maintained constant by glucose infusion during conditions of elevated insulin13. The disadvantages with this technique are that it is time consuming and invasive (arterial catheterization) and requires special laboratory facilities. In this study, the oral glucose tolerance test, which is common in healthcare units, was used. This method is suitable when several subjects are to be investigated for a limited period of time.
The testing and timeline of the experimental procedure can be summarized as follows. Use three separate days for testing before and after an eight-week period, with the same arrangement and approximate time schedules (≥24 h between each day, Figure 1). On the first test day, measure: anthropometric data, such as height, body mass, fat-free mass (FFM), and upper leg circumference (i.e., 15 cm above the apex patellae in a relaxed supine position); submaximal cycling ability; and knee muscle strength, as described in steps 4 and 5. Take a muscle biopsy from the thigh on the second test day. For further descriptions, see step 6.1. Test oral glucose tolerance (OGTT) on the last testing day. For further descriptions, see step 7.1. Ask all participants to avoid vigorous physical activity for 24 h and to fast overnight prior to each test day. However, ask them to avoid strenuous physical activity for 48 h before the OGTT test day. Ask them to follow their normal everyday physical activity and diet habits. Note that pre- and post-intervention, both groups' self-reported food intake and type of foods were unchanged.
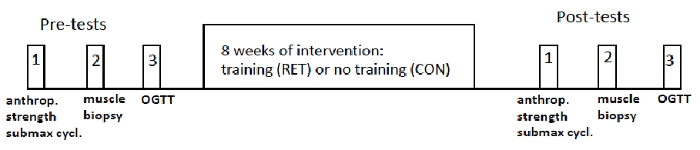
Figure 1: Experimental protocol. Schematic diagram. The timing between the three pre- and post-tests was similar for each subject and was at least 24 h. Further details are given in the text. This figure has been modified from Frank et al. Scand. J. Med. Sci. Sports. 2016: 26, 764-73.28 Please click here to view a larger version of this figure.
This study sought to investigate the effect of short-term resistance training in elderly people on muscle oxidative capacity and glucose tolerance. The second aim was to examine the effect on strength, power, and muscle qualitative improvements (i.e., proteins involved in cell signaling and muscle fiber type composition).
Access restricted. Please log in or start a trial to view this content.
Protocol
The Regional Ethics Committee of Stockholm, Sweden, approved the design of the investigation.
1. Material
- Recruit relatively healthy women and men 65-80 years old who have BMI values between 20 and 30 kg·m-2. Randomize them into two groups. Ensure that the individuals in both groups have relatively low physical activity levels (i.e., moderate daily physical activity and no regular exercise training).
- Exclude beta-blocker users and those with coronary artery disease and severe neurological or joint problems.
- Ask the subjects for their written consent after informing them of possible discomfort and risks in the test and training sessions.
- Balance the resistance training (RET) and control without training (CON) groups in terms of age, sex, and BMI. Ask one group to perform RET under a trainer for 1 h three times a week for eight weeks; the other group will serve as controls (CON).
2. Testing and Training
Note: The eight exercises are standard strength training exercises: seated leg press, seated abdominal crunch, supine chest press, seated back extension, seated shoulder press, seated rowing, seated leg extension (knee extension), and prone leg curl (knee flexion); see Figure 8 in the Representative Results section.
- During the first training session, assess the maximal strength at one maximal repetition (1 RM) for each training exercise.
NOTE: The 1 RM model is commonly used and is defined as the load at which the subject can lift or push the resistance only once but not twice.- Before the start, ask the participant to perform a short warm-up (with a few initial trials at very low weight loads) of the tested exercise. Subsequently increase the load until just below the probable 1 RM value (most often the maximum of 3-4 increased loads). Register the maximal load that the subject can perform only once (= 1 RM).
- Measure 1 RM in the eight standard strength training exercises (see Figure 8 in the Representative Results section). Ask the subjects to rest for at least 2-3 min between each tested exercise.
NOTE: Strength training equipment was used for all training exercises, including the tests of each training exercise.
- Ask the whole RET group to perform 1 h of supervised strength training three times a week for eight weeks. Ask the participants to perform, after warm-up, the eight abovementioned standard training exercises. They should repeat an exercise 12 times in each set and perform three sets of each exercise. Allow rest for 1 min between each set and 2-3 min between each exercise.
- Ask subjects to perform each exercise as fast as possible during the concentric phase (i.e., muscle shortening phase) and slowly during the eccentric phase (i.e., muscle elongation phase).
NOTE: Subjects can do the exercises in any order. However, ask them to start and end with a leg exercise and also to try to perform the eight exercises in the presented order. Use strength training equipment for all eight exercises. - During each training session, ask the participants to perform three sets at 75-80% of 1 RM for each exercise. Increase the load by approximately 5% the session after when a participant can do 12 repetitions in all three sets of an exercise.
- Ask subjects to perform each exercise as fast as possible during the concentric phase (i.e., muscle shortening phase) and slowly during the eccentric phase (i.e., muscle elongation phase).
3. Submaximal Cycling Test
Note: Perform the submaximal cycling test on test day 1 (see the Introduction and Figure 1).
- Perform a cycle ergometer test, including two submaximal levels, each for 4 min14,15. Set the first work rate to be low (30 W) and the second at 60-120 W, with no pause between the loads on the cycle ergometer.
NOTE: The first load is the same for all subjects, but the second and last submaximal level should be approximately 65-85% of maximal heart rate for each subject. Both loads should be the same before and after the intervention period of 8 weeks of training.- Base the second-highest load level on familiarization tests done before the trials by asking how physically active the person is and by having the subject initially cycle for a short while; the test leader will form an opinion based on the subject's heart rate as to what final submaximal load is appropriate.
- Record the mean steady heart rate (HR) using a heart rate monitor via a chest belt during the last minute on the low and high work rates, by taking the mean of the observed HR at 3:15, 3:30, 3:45, and 4:00 min at each work rate.
- Use an ergo-spirometric device to ascertain the composition of gas (O2 and CO2) in the expired and inspired air. Register the respiration exchange ratio (RER; i.e., CO2/O2), and quantify the RER mean values during the last minute (from four measures every 15 s) at both work rate loads.
4. Knee Extensor Strength: Static, Eccentric, and Concentric Peak Torque and the Rate of Force Development
Note: Perform knee strength measurements on test day 1 (see the Introduction and Figure 1).
- Before the recordings, ask the subject to perform a warm-up by cycling for 8-10 min on a cycle ergometer at submaximal level (i.e., approximately 65-85% of maximal heart rate).
- Ask the subject to sit on the bench of an isokinetic dynamometer. Fix the subject's trunk with straps over the shoulders and hips. Securely strap the subject's shank to the dynamometer shaft with two straps: one below the knee and one just above the ankle. Align the knee joint axis with the rotational center of the dynamometer shaft.
- When the subject is secured, assess the maximal voluntary knee strength as the peak torque, with the subject sitting in the isokinetic dynamometer. Initially allow the subject to perform several trials for familiarization with the knee strength equipment (isokinetic dynamometer).
- Ask the individual to perform four maximal voluntary eccentric and concentric knee extensions (alternately), with the right leg at a constant angular velocity of 30 deg/s. Set the range of motion between 90° and 15° (straight leg = 0°).
- In the eccentric task, ask the subject to resist the dynamometer shaft with maximal effort through the whole movement from the 15° to 90° knee angle. In the concentric task, ask the subject to press the lower leg in the dynamometer shaft in a knee extension, as hard as possible throughout the whole motion range.
- Allow a 4-min rest after the dynamic recordings. Thereafter, assess the static maximal voluntary contraction torque (MVC) four times at a 65° knee angle. In every static trial, ask the subjects, sitting in the same dynamometer, to kick as fast and hard as they can against the dynamometer shaft, which now is fixed (at 65°) and cannot be moved.
- For torque (strength) signals, convert the analog torque signals to digital using an analog-to-digital converter box connected to the isokinetic dynamometer.
NOTE: The converter automatically changes the analog signals from the dynamometer to digital signals, which thereafter are automatically exported to the computer where the data are collected.- Set the sampling frequency at 5 kHz in the software analysis program of the computer. Store the digital signals on the computer for a subsequent strength value analysis with the software analysis program.
- In the subsequent analysis, use the highest value obtained from four trials for each subject in the eccentric, concentric and static measurements. In the software program, click on the highest value of the four trials and write down the strength value shown on the computer screen.
- Register the highest peak torque in the eccentric and in the concentric recordings for each subject and the highest strength value among the four static trials.
NOTE: Isokinetic dynamometer testing of knee extensor strength in a seated position has proper reliability and validity16,17.
- Register the highest peak torque in the eccentric and in the concentric recordings for each subject and the highest strength value among the four static trials.
- Measure the rate of force (torque) development (RFD) during 0-30 ms and 0-200 ms in the highest value found among the static trials. Set the value of zero at the 7.5-Nm level for the onset of contraction for knee extensor strength (time: 0 ms)18,19. Move the cursor (in the software program for muscle strength analysis) to the "7.5 Nm" value on the y-scale to obtain the position for 0 ms.
- For the pre-test assessment, set the cursor on the 30-ms value (after the time 0 ms). Write down the value showing the raise in Nm at 30 ms (i.e., the increase in Nm from 7.5 Nm = 0 ms). Do the same procedure for the post-test value.
- Calculate the increase in percentage for the post-test Nm value (numerator) compared to the pre-test Nm value (denominator) over the period of 0-30 ms. Thus, present the RFD raise in percent from the pre-test to the post-test. Do the same analyses for the time interval of 0-200 ms.
5. Muscle Biopsy
Note: Perform a muscle biopsy on test day 2 (see the Introduction and Figure 1).
- Take a muscle biopsy from the middle portion of the thigh muscle vastus lateralis using a conchotome20.
- Prior to the biopsy, inject 1-2 mL of local anesthesia subcutaneously and into the fascia. After a couple of minutes, make an incision with a small scalpel through the skin and fascia, approximately 1/3 of the distance from the patella to the anterior superior iliac spine. Extract about 100-150 mg of muscle tissue using the conchotome.
- Freeze samples for histochemistry in isopentane cooled to its freezing point in liquid nitrogen and store it at -80 °C. Store a sample of 30-50 mg of muscle tissue.
- Rapidly freeze the samples for protein analysis in liquid nitrogen and store them at -80 °C. Store a sample of 30-50 mg of muscle tissue.
6. OGTT
Note: Perform OGTT (oral glucose tolerance test) on test day 3 (see the Introduction and Figure 1). The time between the exercise and OGTT must exceed 48 h and should be similar between the pre- and post-tests. A 2-h oral OGTT is used to investigate whether frequent blood samples during this time show normal or increased levels, indicating diabetes or prediabetes conditions.
- Perform the OGTT test in the morning on subjects who have fasted overnight and have not done any strenuous exercise on the testing day or the day before.
- Take blood samples (4 mL) from supine participants via a venous cannula in the antecubital vein 15 min before and just prior to the intake of glucose, followed by 15, 30, 60, 90, and 120 min after the ingestion of the glucose (75 g of glucose in a 250 g/L solution).
- Centrifuge the blood samples at 1,500 x g and 4 °C for 10 min and store the plasma at -20 °C for future analysis. Use the samples to perform standard glucose level tests (step 7).
- For glucose, insulin, and c-peptide, calculate the area under the curve (AUC) by determining the time integral of glucose above basal glucose levels. Use the OGTT results to calculate insulin sensitivity for the whole body using the Matsuda method21, as per the equation: 10 000*√[(Glucosebasal*Insulinbasal)*(Glucosemean*Insulinmean].
7. Blood Sample Analysis
- Quantify the glucose concentration in the venous plasma with an automated analyzer. Set the impaired glucose tolerance level at blood glucose values >7.8 mmol/L after a 2-h OGTT22.
- Use ELISA kits22 to perform a plasma analyses of insulin and c-peptide. Use a plate reader. Put the ELISA plates for both insulin and c-peptide in a plate reader (each on a separate occasion).
NOTE: The plate reader measures the amount of insulin and the amount of c-peptide by measuring the samples on the plate at certain absorbances. Blood lipids TG, HDL, apolipoprotein A1, and apolipoprotein B were analyzed with standard methods at the Karolinska University Hospital, Stockholm, Sweden.
8. Analysis of Muscle Samples
- Immunoblotting
- First, freeze-dry the muscle sample in a lyophilizer at a pressure below 10-1 mbar for 12 h. Dissect it so that it is free of blood and connective tissue using a needle and forceps under a light microscope. Store it at -80 °C.
NOTE: A suitable amount of muscle is between 1 and 5 mg of dry weight, but the protocol can be adjusted to less than 1 mg, all the way to single fibers. Due to the low amount of muscle tissue present in one biopsy, values from that RET participant were not used for immunoblotting. - Homogenize the muscle samples with a mini bead beater in ice-cold buffer (80 µL/mg) composed of 2 mM 4-(2-hydroxyethyl)-1-piperazineethanesulfonic acid (HEPES), 1 mM ethylenediaminetetraacetic acid (EDTA), 5 mM ethylene glycol-bis(β-aminoethyl ether)-N,N,N',N'-tetraacetic acid (EGTA), 10 mM MgCl2, 50 mM ß-glycerophosphate, 1% TritonX-100, 1 mM Na3VO4, 2 mM dithiothreitol, 20 µg/mL leupeptin, 50 µg/mL aprotinin, 1% phosphatase inhibitor cocktail, and 40 µg/µL PMSF (phenylmethylsulfonyl fluoride).
- Place a scoop of 0.5-mm zirconium oxide beads in each tube with the muscle. Add buffer and homogenize for 2 x 1 min at speed step 7-8 (here, the maximum is 10) and 4 °C.
- Centrifuge the homogenate for 10 min at 10,000 x g. Transfer the remaining supernatant to new tubes and discard the pellet containing the structural proteins.
- Spectrophotometrically determine the protein concentration in the supernatant with a commercially available kit using a plate reader at 660 nm23.
- Subsequently dilute the samples with 2x Laemmli sample buffer and homogenizing buffer (1:1) to a final protein concentration of 1.5 µg/µL. Heat them to 95 °C for 5 min to denature the proteins. Store the diluted samples at -20 °C prior to analysis.
- For Native-polyacrylamide gel electrophoresis (PAGE), load 30 µg of protein from each sample into 18-well precast gradient gels (4-20% acrylamide) and perform electrophoresis at 300 V for 30 min on ice.
- Equilibrate the gel in transfer buffer (25 mM Tris base, 192 mM glycine, and 10% methanol) for 30 min at 4 °C. Transfer proteins to polyvinylidene fluoride membranes with 0.2-µm pore sizes at a constant current of 300 mA for 3 h at 4 °C.
- To confirm equal loading and transfer, stain the membranes with a total protein stain24. For each target protein, load all samples from each subject onto the same gel and run all gels at the same time.
- Block the membrane for 1 h at room temperature in Tris-buffered saline (20 mM Tris-base, 192 mM NaCl; TBS; pH 7.6) containing 5% non-fat milk.
- Incubate the membranes over night with primary antibodies (see the Materials List) diluted in TBS containing 2.5% non-fat milk and supplemented with 0.1% Tween-20 (TBS-TM).
- Following primary antibody incubation, wash the membranes (2 x 1 min plus 3 x 5 min) with TBS-TM and incubate with secondary antibodies (see the Materials List) conjugated with horseradish peroxidase for 1 h at room temperature. Wash again with TBS-TM (2 x 1 min and 3 x 10 min) and again subject them to four additional 5-min washes with TBS.
- Apply 6-12 mL of chemiluminescent substrate to the membrane for 5 min. Place the membrane between two transparent plastic sheets. Place the membranes in front of a CCD camera blocking external light. Take serial exposures using a chemiluminescent camera filter.
- Use the software program to acquire 10 exposures for 2 min, or until the signals are saturated. Use a standard setup, both for the optical filter settings to acquire chemiluminescence, as well as for the lens settings.
- Use the highest exposure that does not lead to saturation and mark the contours of the band. Quantify the bands as the intensity x mm2 using the same software. Subtract the background noise from the band intensity. Present the results relative to the total protein stain and express it as the percent change as compared to baseline.
- First, freeze-dry the muscle sample in a lyophilizer at a pressure below 10-1 mbar for 12 h. Dissect it so that it is free of blood and connective tissue using a needle and forceps under a light microscope. Store it at -80 °C.
- Histochemistry
NOTE: The histochemistry technique below is based on methods described in an earlier publication25.- For histochemistry, cut serial cross sections (10 µm) at -20 °C using a cryostat. Mount the cross-sections on glass slides stored in a glass cuvette and air dry the biopsy slices at room temperature.
- Prepare buffer solutions for each pH level for pre-incubation at pH 4.3, 4.6, and 10.3 for ATPase staining26. To visualize capillaries, stain the cross-sections using the amylase-PAS method27.
- Calibrate a pH-meter by pouring calibration solutions into labeled calibration beakers. Push the appropriate button to select the pH from the main menu.
- Rinse the probe with deionized water and place the probe in the first calibration beaker. Make sure that there are no air bubbles in the membrane. Measure the first calibration solution and then present the next calibration solution (the display will ask for the next solution).
- Rinse the probe with deionized water and then place it in the second calibration beaker. Make sure that there are no air bubbles in the membrane. Measure a second calibration solution and proceed to the next calibration solution.
- Rinse the probe with deionized water and place it in a third calibration beaker. Make sure there are no air bubbles in the membrane. Measure the third calibration solution.
NOTE: When the calibration is good, the display will briefly show, "3rd Buffer OK" and will then return to the main menu.
- Use the buffers as follows for ATPase staining.
- To prepare a solution at pH 10.3, use two different solutions: (A) 4.506 g of glycine, 4.8 g of CaCl2, 3.51 g of NaCl, and 600 mL of dH2O and (B) 2.176 g of NaOH and 540 mL of dH2O. Store the solutions in a cold room or a refrigerator. Use them within one month.
- To prepare solutions at pH 4.3 and 4.6, perform "acid preincubation." Prepare the acid for preincubation using: 6.47 g of Na acetate, 3.7 g of KCl, and 500 mL of dH2O. Thereafter, prepare 1% CaCl2 solution by dissolving 2.5 g of it into 250 mL of dH2O. Prepare 2% CoCl2 solution by dissolving 5 g of it into 250 mL of dH2O.
- Store and use these solutions as mentioned above. Finally, prepare 0.2% ammonium sulphide by mixing 800 µL of 20% (NH4)2S into 40 mL of dH2O. Prepare the latter freshly.
- Prepare solutions at certain pH values as follows. After the calibration of the pH-meter, remove the cuvettes and calcium and cobalt chlorides from refrigerator and allow them to warm to room temperature before staining.
- For pH 10.3, add around 25 mL of solution A to a small (approximately 70 mL) glass beaker. Measure the pH. Keep adding solution B until the required pH of 10.37 is reached. If the staining is too dark, increase the pH. If it is too bright, reduce the pH.
- For pH 4.6, add around 25 mL of "acid preincubation" to a small glass beaker. Measure the pH. Reduce the pH using 5 M acetic acid. If the image of the stain is too dark, try to lighten with increased pH. If it is too bright, darken with a decreased pH. If staining does not help, try another pH: 4.8 instead of 4.6.
- For pH 4.3, do the same as for 4.6, but add more acetic acid. Decrease the pH if the stain is too bright, and increase the pH if it is too dark for the fibers to be specified.
- Prepare ATP solution as follows. Weigh 0.017 g of ATP per cuvette (10 mL), so 0.051 g per 3 cuvettes or 0.068 g for 4 cuvettes. Take 30 mL (for 3 cuvettes, 10 mL/cuvette) of solution at pH 10.3 (use a cylinder scale glass) and put it into a glass beaker with weighed ATP.
- Mix thoroughly and measure the pH. Reduce the pH using concentrated HCl until the pH reaches exactly 9.40.
- For incubation at various pH values, do the following. Place 10.3 solution into one cuvette and incubate it in a water bath at 37 °C for 9 min. Place 4.3 solution into another cuvette and incubate it at room temperature for 5 min. Place 4.6 solution into the last cuvette and incubate at RT for 1 min.
- Following the preferred pH incubation procedure, apply the contents of each cuvette as follows. Wash 15 times with dH2O. Add ATP solution (0.170 g of ATP/100 mL of H2O) to the biopsy sample. Incubate in a water bath at 37 °C for 30 min. Wash 15 times with dH2O.
- Add CaCl2 solution (1 g of CaCl2/100 mL of H2O) to the biopsy sample in the cuvettes. Incubate at RT for 3 min. Wash 15 times with dH2O. Add CoCl2 solution (2 g of CoCl2/100 mL of H2O) to the biopsy sample in the cuvettes. Incubate at RT for 3 min. Wash 15 times with dH2O.
- Put it in (NH4)2S solution for 30 s and wash quickly 15 times under the fume hood. Glue the biopsy slices onto slide glass. To avoid bubbles, squeeze the biopsies, but not too hard.
- Select one region of the cross-section without artifacts or longitudinal cuts of the fiber. Analyze under a light microscope using software.
- Assess the cross-sectional area (CSA), capillaries, and classification of fiber type (i.e., type-I, IIA, or IIX) via computer image analysis from a mean of at least 150-200 fibers per biopsy. From a microscope picture of muscle fibers in the cross-sections ensure that the three types of muscle fibers (i.e., type-I, IIA, and IIX) have various shades of white to gray to black, depending on the pH staining (i.e., 4.34, 4.65 and 10.37).
- Start by marking some type-I fibers. Thereafter, the program will automatically register the other type-I fibers. Check that all type-I fibers are marked correctly. To mark a certain fiber, click the "Vector" button. Use the cursor to measure the area for each individually selected muscle fiber.
- After the analysis of type-I fibers, continue the same procedure for type-IIA and type-IIX. The average ± SEM for each type of muscle fiber (i.e., type I, IIA, and IIX) should be calculated regarding amount of fiber and the CSA for the RET and CON groups.
Note: The cross-sectional area (CSA), capillaries, and classification of fiber type (i.e., type I, IIA and IIx) were assessed from a mean of 163 ± 9 fibers per biopsy.
Access restricted. Please log in or start a trial to view this content.
Results
Material
In the study, 21 relatively healthy women and men, 65-80 years old and with BMI values between 20 and 30 kg·m-2 participated and were randomized into two groups. Individuals in both groups had relatively low physical activity levels (i.e., a moderate everyday physical activity level and no regular exercise training). One group (n=12, 6 women and 6 men) performed RET under a trainer for 1 h three times a...
Access restricted. Please log in or start a trial to view this content.
Discussion
In this study, a number of techniques have been used to investigate the effects of short-term progressive resistance training on elderly subjects' muscle function/morphology, aerobic capacity, and glucose tolerance. The main finding was that, compared to a control group, many improvements occurred in muscle aerobic capacity, glucose tolerance, strength, power, and muscle quality (i.e., protein involved in cell signaling and muscle fiber composition). An increase was, for example, seen for: static, eccentric,...
Access restricted. Please log in or start a trial to view this content.
Disclosures
The authors declare that they have no competing financial interests.
Acknowledgements
The authors are grateful to Andrée Nienkerk, Dennis Peyron, and Sebastian Skjöld for supervising the training sessions and several tests; to the subjects participating; to Tim Crosfield for language revision; and to the economic support from The Swedish School of Sport and Health Sciences.
Access restricted. Please log in or start a trial to view this content.
Materials
| Name | Company | Catalog Number | Comments |
|---|---|---|---|
| Western blot | |||
| Pierce 660 nm Protein Assay Kit | Thermo Scientific, Rockford, IL, USA | 22662 | |
| SuperSignal West Femto Maximum Sensitivity Substrate | Thermo Scientific | 34096 | |
| Halt Protease Inhibitor Cocktail (100x) | Thermo Scientific | 78429 | |
| Restore PLUS Western Blot Stripping Buffer | Thermo Scientific | 46430 | |
| Pierce Reversible Protein Stain Kit for PVDF Membranes | Thermo Scientific | 24585 | |
| 10 st - 4–20% Criterion TGX Gel, 18 well, 30 µL | Bio-Rad Laboratories, Richmond, CA, USA | 567-1094 | |
| Immun-Blot PVDF Membrane | Bio-Rad | 162-0177 | |
| Precision Plus Protein Dual Color Standards | Bio-Rad | 161-0374 | |
| 2x Laemmli Sample Buffer | Bio-Rad | 161-0737 | |
| 10x Tris/Glycine | Bio-Rad | 161-0771 | |
| 2-Mercaptoethanol | Bio-Rad | 161-0710 | |
| Tween 20 | Bio-Rad | P1379-250ML | |
| Band analysis with Quantity One version 4.6.3.software | Bio-Rad | ||
| 1% phosphatase inhibitor coctail | Sigma-Aldrich, Saint Louis, Missouri, USA | ||
| Antibodies | |||
| mTOR (1:1,000) | Cell Signaling, Danvers, Massachusetts, USA | 2983 | |
| Akt (1:1,000) | Cell Signaling, Danvers | 9272 | |
| Secondary anti-rabbit and anti-mouse HRP-linked (1:10,000) | Cell Signaling, Danvers | ||
| Citrate synthase (CS) (1:1,000) | Gene tex, San Antonio, California, USA | ||
| OXPHOS (1:1,000) | Abcam, Cambridge, UK | ||
| Equipment - Analysis of muscle samples | |||
| Bullet Blender 1.5 for homogenizing | Next Advance, New York, USA | ||
| Plate reader | Tecan infinite F200 pro, Männedorf, Switzerland | ||
| Histochemistry | |||
| Mayer hematoxylin | HistoLab, Västra Frölunda, Sweden | 1820 | |
| Oil Red o | Sigma-Aldrich, Saint Louis, Missouri, USA | 00625-25y | |
| NaCl | Sigma-Aldrich | 793566-2.5 kg | |
| Cobalt Chloride | Sigma-Aldrich | 60818-50G | |
| Amylase | Sigma-Aldrich | A6255-25MG | |
| ATP | Sigma-Aldrich | A2383-5G | |
| Glycine | VWR-chemicals / VWR-international, Spånga, Sweden | 101196X | |
| Calcium Chloride | VWR-chemicals / VWR-international | 22328.262 | |
| Iso-pentane | VWR-chemicals / VWR-international | 24872.298 | |
| Etanol 96% | VWR-chemicals / VWR-international | 20905.296 | |
| NaOH | MERCK, Stockholm, Sweden | 1.06498.1000 | |
| Na acetate | MERCK | 1.06268.1000 | |
| KCl | MERCK | 1.04936.1000 | |
| Ammonium Sulphide | MERCK | U1507042828 | |
| Acetic acid 100% | MERCK | 1.00063.2511 | |
| Schiffs´ Reagent | MERCK | 1.09033.0500 | |
| Periodic acid | MERCK | 1.00524.0025 | |
| Chloroform | MERCK | 1.02445.1000 | |
| pH-meter LANGE | HACH LANGE GMBH, Dusseldorf, Germany | ||
| Light microscope | Olympus BH-2, Olympus, Tokyo, Japan | ||
| Cryostat Leica CM1950 | Leica Microsystems, Wetzlar, Germany | ||
| Leica software Leica Qwin V3 | Leica Microsystems | ||
| Gel Doc 2000 - Bio-Rad, camera setup | Bio-Rad Laboratories AB, Solna, Sweden | ||
| Software program Quantift One - 4.6 (version 4.6.3; Bio Rad) | Bio-Rad Laboratories AB, Solna, Sweden | ||
| Oral glucos tolerance test, OGTT | |||
| Glukos APL 75 g | APL, Stockholm, Sweden | 323,188 | |
| Automated analyser Biosen 5140 | EKF Diagnostics, Barleben, Germany | ||
| Insulin and C-peptide in plasma kit ELISA | Mercodia AB, Uppsala Sweden | 10-1132-01, 10-1134-01 | |
| Plate reader | Tecan infinite F200 pro, Männedorf, Switzerland | ||
| Further equipment | |||
| Measures of fat-free mass | FFM-Tanita T5896, Tanita, Tokyo, Japan | ||
| Strength training equipment for all training exercises | Cybex International Inc., Medway, Massachusetts, USA | ||
| Cycle ergometer | Monark Ergometer 893E, Monark Exercises, Varberg, Sweden | ||
| Heart rate monitor RS800, Polar | Polar Electro OY, Kampele, Finland | ||
| Oxycin-Pro - automatic ergo-spirometric device | Erich Jaeger GmbH, Hoechberg, Germany | ||
| Isokinetic dynamometer, Isomed 2000, knee muscle strength | D&R Ferstl GmbH, Henau, Germany | ||
| CED 1401 data acquisition system and Signal software | Cambridge Electronic Design, Cambridge, UK | ||
| Software for muscle strength analysis, Spike 2, version 7 | Signal Hound, LA Center, WA, USA | ||
| Statistica software for statistical analyses | Statistica, Stat soft. inc, Tulsa, Oklahoma, USA | ||
| Muscle biopsy equipment | |||
| Weil Blakesley conchotome | Wisex, Mölndal, Sweden | ||
| Local anesthesia | Carbocain, 20 mL, 20 mg/mL; Astra Zeneca, Södertälje, Sweden | 169,367 | |
| Surgical Blade | Feather Safety Razor CO, LTD, Osaka, Japan | 11048030 |
References
- Carrick-Ranson, G., et al. The effect of age-related differences in body size and composition on cardiovascular determinants of VO2max. J. Gerontol. A Biol. Sci. Med. Sci. 68 (5), 608-616 (2013).
- Peterson, C. M., Johannsen, D. L., Ravussin, E. Skeletal muscle mitochondria and aging: a review. J. Aging. 2012, 194821(2012).
- Russell, A. P., Foletta, V. C., Snow, R. J., Wadley, G. D. Skeletal muscle mitochondria: a major player in exercise, health and disease. Biochim. Biophys. Acta. 1840 (4), 1276-1284 (2014).
- Conley, K. E., Jubrias, S. A., Esselman, P. C. Oxidative capacity and ageing in human muscle. J. Physiol. 526 (Pt 1), 203-210 (2000).
- Holloszy, J. O. Adaptation of skeletal muscle to endurance exercise. Med. Sci. Sports. 7 (3), 155-164 (1975).
- Menshikova, E. V., Ritov, V. B., Fairfull, L., Ferrell, R. E., Kelley, D. E., Goodpaster, B. H. Effects of exercise on mitochondrial content and function in aging human skeletal muscle. J. Gerontol. A Biol. Sci. Med. Sci. 61 (6), 534-540 (2006).
- Balakrishnan, V. S., et al. Resistance training increases muscle mitochondrial biogenesis in patients with chronic kidney disease. Clin. J. Am. Soc. Nephrol. 5 (6), 996-1002 (2010).
- Ferrara, C. M., Goldberg, A. P., Ortmeyer, H. K., Ryan, A. S. Effects of aerobic and resistive exercise training on glucose disposal and skeletal muscle metabolism in older men. J. Gerontol. A Biol. Sci. Med. Sci. 61 (5), 480-487 (2006).
- Frontera, W. R., Meredith, C. N., O'Reilly, K. P., Evans, W. J. Strength training and determinants of VO2max in older men. J. Appl. Physiol. (1985). 68 (1), 329-333 (1990).
- Toth, M. J., Miller, M. S., Ward, K. A., Ades, P. A. Skeletal muscle mitochondrial density, gene expression, and enzyme activities in human heart failure: minimal effects of the disease and resistance training. J. Appl. Physiol. (1985). 112 (11), 1864-1874 (2012).
- Zachwieja, J. J., Toffolo, G., Cobelli, C., Bier, D. M., Yarasheski, K. E. Resistance exercise and growth hormone administration in older men: effects on insulin sensitivity and secretion during a stable-label intravenous glucose tolerance test. Metabolism. 45 (2), 254-260 (1996).
- Davidson, L. E., et al. Effects of exercise modality on insulin resistance and functional limitation in older adults: a randomized controlled trial. Arch. Intern. Med. 169 (2), 122-131 (2009).
- DeFronzo, R. A., Tobin, J. D., Andres, R. Glucose clamp technique: a method for quantifying insulin secretion and resistance. Am. J. Physiol. 237 (3), E214-E223 (1979).
- Åstrand, P. O., Ryhming, I. A nomogram for calculation of aerobic capacity (physical fitness) from pulse rate during sub-maximal work. J. Appl. Physiol. 7 (2), 218-221 (1954).
- Björkman, F., Ekblom-Bak, E., Ekblom, Ö, Ekblom, B. Validity of the revised Ekblom Bak cycle ergometer test in adults. Eur. J. Appl. Physiol. 116 (9), 1627-1638 (2016).
- Seger, J. H., Westing, S. H., Hanson, M., Karlson, E., Ekblom, B. A new dynamometer measuring eccentric and eccentric muscle strength in accelerated, decelerated and isokinetic movements: validity and reproducibility. Eur. J. Appl. Physiol. 57 (5), 526-530 (1988).
- Westing, S. H., Seger, J. Y., Karlson, E., Ekblom, B. Eccentric and concentric torque-velocity characteristics of the quadriceps femoris in man. Eur. J. Appl. Physiol. 58 (1-2), 100-104 (1988).
- Aagaard, P., Simonsen, E. B., Andersen, J. L., Magnusson, P., Dyhre-Poulsen, P. Increased rate of force development and neural drive of human skeletal muscle following resistance training. J. Appl. Physiol. 93 (4), 1318-1326 (2002).
- Andersen, L. L., Aagaard, P. Influence of maximal muscle strength and intrinsic muscle contractile properties on contractile rate of force development. Eur. J. Appl. Physiol. 96 (1), 46-52 (2006).
- Henriksson, K. G. "Semi-open" muscle biopsy technique. A simple outpatient procedure. Acta Neurol. Scand. 59 (6), 317-323 (1979).
- Matsuda, M., DeFronzo, R. A. Insulin sensitivity indices obtained from oral glucose tolerance testing: comparison with the euglycemic insulin clamp. Diabetes Care. 22 (9), 1462-1470 (1999).
- American Diabetes, Association. Diagnosis and classification of diabetes mellitus. Diabetes Care. 28, Suppl 1. S37-S42 (2005).
- Moberg, M., Apró, W., Ekblom, B., van Hall, G., Holmberg, H. C., Blomstrand, E. Activation of mTORC1 by leucine is potentiated by branched-chain amino acids and even more so by essential amino acids following resistance exercise. Am. J. Physiol. Cell Physiol. 310 (11), C874-C884 (2016).
- Antharavally, B. S., Carter, B., Bell, P. A., Krishna Mallia,, A, A high-affinity reversible protein stain for Western blots. Anal. Biochem. 329 (2), 276-280 (2004).
- Brooke, M. H., Kaiser KK, Muscle fiber types: how many and what kind? Arch. Neurol. 23 (4), 369-379 (1970).
- Brooke, M. H., Kaiser, K. K. Three "myosin adenosine triphosphatase" systems: the nature of their pH lability and sulfhydryl dependence. J. Histochem. Cytochem. 18 (9), 670-672 (1970).
- Andersen, P. Capillary density in skeletal muscle of man. Acta Physiol. Scand. 95 (2), 203-205 (1975).
- Frank, P., Andersson, E., Pontén, M., Ekblom, B., Ekblom, M., Sahlin, K. Strength training improves muscle aerobic capacity and glucose tolerance in elderly. Scand. J. Med. Sci. Sports. 26 (7), 764-773 (2016).
- Blomstrand, E., Celsing, F., Fridén, J., Ekblom, B. How to calculate human muscle fibre areas in biopsy samples--methodological considerations. Acta Physiol. Scand. 122 (4), 545-551 (1984).
- Cuthbertson, D., et al. Anabolic signaling deficits underlie amino acid resistance of wasting, aging muscle. FASEB J. 19 (3), 422-424 (2005).
- Vincent, K. R., Braith, R. W., Feldman, R. A., Kallas, H. E., Lowenthal, D. T. Improved cardiorespiratory endurance following 6 months of resistance exercise in elderly men and women. Arch. Intern. Med. 162 (6), 673-678 (2002).
- Cadore, E. L., et al. Effects of strength, endurance, and concurrent training on aerobic power and dynamic neuromuscular economy in elderly men. J. Strength Cond. Res. 25 (3), 758-766 (2011).
- Jubrias, S. A., Esselman, P. C., Price, L. B., Cress, M. E., Conley, K. E. Large energetic adaptations of elderly muscle to resistance and endurance training. J. Appl. Physiol. (1985). 90 (5), 1663-1670 (1985).
- Benton, C. R., Wright, D. C., Bonen, A. PGC-1alpha-mediated regulation of gene expression and metabolism: implications for nutrition and exercise prescriptions. Appl. Physiol. Nutr. Metab. 33 (5), 843-862 (2008).
Access restricted. Please log in or start a trial to view this content.
Reprints and Permissions
Request permission to reuse the text or figures of this JoVE article
Request Permission