This report describes a method to induce chronic experimental autoimmune dry eye in Lewis rats through immunization with an emulsion of rat lacrimal gland extract, ovalbumin, and complete Freund's adjuvant, followed by the injection of lacrimal gland extract and ovalbumin into the forniceal subconjunctiva and lacrimal glands six weeks later.
Method Article
A Chronic Autoimmune Dry Eye Rat Model with Increase in Effector Memory T Cells in Eyeball Tissue
In This Article
Summary
Abstract
Dry eye disease is a very common condition that causes morbidity and healthcare burden and decreases the quality of life. There is a need for a suitable dry eye animal model to test novel therapeutics to treat autoimmune dry eye conditions. This protocol describes a chronic autoimmune dry eye rat model. Lewis rats were immunized with an emulsion containing lacrimal gland extract, ovalbumin, and complete Freund's adjuvant. A second immunization with the same antigens in incomplete Freund's adjuvant was administered two weeks later. These immunizations were administered subcutaneously at the base of the tail. To boost the immune response at the ocular surface and lacrimal glands, lacrimal gland extract and ovalbumin were injected into the forniceal subconjunctiva and lacrimal glands 6 weeks after the first immunization. The rats developed dry eye features, including reduced tear production, decreased tear stability, and increased corneal damage. Immune profiling by flow cytometry showed a preponderance of CD3+ effector memory T cells in the eyeball.
Introduction
Dry eye disease (DED) is a multifactorial disease of the tears and the ocular surface that results in symptoms of discomfort, visual disturbance, and tear film instability, which can lead to damage to the ocular surface. It is accompanied by increased osmolarity of the tear film and by inflammation of the ocular surface1. Symptoms associated with DED are burning, stinging, grittiness, foreign body sensation, tearing, ocular fatigue, and dryness2,3. The two main causes of DED are reduced tear production by the tear secretion gland and the excessive evaporation of the tear film4. In patients with autoimmune diseases, such as Sjogren syndrome, systemic lupus erythematosus, and rheumatoid arthritis immune damage to the meibomian glands reduces the expression of lipids essential for tear stability. Also, immune damage to the ocular surface decreases the production of mucins important for surface wettability. Together, these processes cumulatively cause chronic dry eye5,6,7.
Tear replacement and anti-inflammatory therapy are the mainstays of therapy. However, current anti-inflammatory therapies for DED (i.e., corticosteroids and cyclosporine) are broadly immunosuppressive, leading to serious adverse effects8,9,10. There is need for a suitable animal model to test novel immunomodulatory agents to treat autoimmune dry eye.
Mice with specific genetic defects11,12,13, mice lacking specific genes14,15, and transgenic mice overexpressing immunoregulatory genes have been used as models of autoimmune dry eye16,17. Antigen-induced autoimmune animal models have also been reported in mice18, rabbits19, and rats20,21. Here, we describe an antigen-induced model of chronic autoimmune dry eye. This model is a modification of two earlier models; one used lacrimal gland extracts, and the second used an autoantigen (i.e., klk1b22) from the lacrimal glands20,21.
The disease was induced by the subcutaneous immunization of 6 to 8 week-old female Lewis rats with ovalbumin, complete Freund's adjuvant, and an emulsion containing lacrimal gland extracts from Sprague-Dawley rats (Figure 1). A second immunization with the same antigen in incomplete Freund's adjuvant was administered two weeks later. To recruit antigen-specific immune cells to the lacrimal gland and ocular surface, mixture of lacrimal gland extract and ovalbumin (1 mg/mL) was injected into the forniceal subconjunctiva and lacrimal glands at the 6th-7th week (Figure 1). More than 85% of the rats developed characteristic features of dry eye 70 days after the first immunization. These features include reduced tear production (Figure 2), increased corneal fluorescein staining (Figure 3), and decreased tear stability (Figure 4). Immune profiling of the T cells in the eyeballs of normal rats by flow cytometry reveals a preponderance of CD3+ effector memory T cells (Figures 5 and 6). Rats with autoimmune DED show an increase in CD3+ effector memory T cells and a corresponding decreases in naïve and central memory T cells (Figure 6).
Protocol
Animals were handled according to institutional guidelines and the ARVO Statement for the Use of Animals in Ophthalmic and Vision Research. The study protocol was approved by the Institutional Animal Care and Use Committee of SingHealth.
1. Preparation of Lacrimal Gland Extract
NOTE: Rats were anesthetized with the intraperitoneal injection of ketamine (75 mg/kg) and xylazine (10 mg/kg). Proper anesthetization was confirmed by toe pinching and tail pinching. Ophthalmic gel was applied to the rat eyes to prevent dryness after each procedure. The anesthetized rats were placed under far infrared lights to keep the animals warm until they fully recovered. During the procedures and recovery time, animals were closely monitored by researchers. All the materials and surgery tools were sterile before use. At the end of the experiment, rats were euthanized by the intraperitoneal injection of pentobarbital (80 mg/kg). Complete euthanasia was verified by lack of cardiac pulse and no blink reflex by touching the eyeball. Rats were housed in standard conditions: room temperature, 21-23 °C; relative humidity, 30-70%; light-dark cycle, alternating 12 h (7 AM to 7 PM).
- Place the euthanized female Sprague-Dawley rats (age range from 8 weeks to 16 weeks) flat, with one ear against the table and the other facing up. Make a 10-mm incision superior-inferiorly under the exposed ear with a pair of spring scissors. Remove the lacrimal gland by dissecting it from the surrounding connective tissue and from the drainage duct.
- Store the glands at -80 °C until required. Thaw the glands on ice. Mince as finely as possible on ice with scissors. Add 150 µL of PBS with 1x protease inhibitor per lacrimal gland.
- Sonicate the samples on ice for 5 min at 20 kHz with the sonicator set at 10 s on, 10 s off at 30% amplitude. Centrifuge the sonicated samples for 20 min at 13,000 x g and 4 °C.
- Pipette the supernatant and transfer it to a new tube. Aliquot the supernatant to 1.5 mL tubes and store them at -80 °C. Measure the protein concentration with a bicinchoninic acid assay22, as per the manufacturer's instructions.
2. Preparation of Emulsion and Pertussis Toxin
- Emulsion
- Add 40 mg of heat-killed Mycobacterium tuberculosis H37Ra into 10 mL of complete Freund's adjuvant containing 1 mg/mL Mycobacterium tuberculosis H37Ra and mix well.
NOTE: The final complete Freund's adjuvant contains 5 mg/mL Mycobacterium tuberculosis H37Ra. - Weigh the ovalbumin, dissolve it in PBS, and prepare an antigen mixture containing 2 mg/mL ovalbumin and 10 mg/mL lacrimal gland extract. Aiming for an injection volume of 200 µL for each animal, prepare a master mixture based on the animal numbers.
- Transfer incomplete Freund's adjuvant or complete Freund's adjuvant to a 50 mL tube, ensuring that the volume of adjuvant to the antigen mixture is in a 1:1 ratio. Add the antigen mixture drop-by-drop to the adjuvant while vortexing with the highest speed that does not result in spillage. Continue vortexing for 5 min after all the antigen has been added.
- Transfer the emulsion to a 5 mL syringe and link it with another 5-mL syringe through a syringe connector. Push the emulsion from one syringe to the other to mix it.
NOTE: The emulsion is ready if a single droplet remains as a sphere when placed in water. Only freshly prepared emulsion or emulsion stored overnight at 4 °C should be used.
- Add 40 mg of heat-killed Mycobacterium tuberculosis H37Ra into 10 mL of complete Freund's adjuvant containing 1 mg/mL Mycobacterium tuberculosis H37Ra and mix well.
- Pertussis toxin
- Reconstitute 50 µg of pertussis toxin in 500 µL of water to make a final concentration of 100 ng/µL. Votex the container for 30 s to make sure the toxin dissolves completely.
NOTE: Do not sterilize by filtration, as this will result in a loss of material. Do not freeze. This solution remains active for at least 6 months at 4 °C. - Dilute 100 ng/µL of pertussis toxin to 3 ng/µL using PBS. Transfer 100 µL of the diluted pertussis toxin to a 1 mL Luer-lock injection syringe with a 27 G needle.
- Reconstitute 50 µg of pertussis toxin in 500 µL of water to make a final concentration of 100 ng/µL. Votex the container for 30 s to make sure the toxin dissolves completely.
3. Immunization of the Lewis Rats
- On day 0, mix the emulsion a few times. Distribute 200 µL of the emulsion, which contains 1 mg of lacrimal gland extract and 200 µg of ovalbumin in complete Freund's adjuvant, into 1-mL Luer-lock syringes with 27G needles. Inject the emulsion subcutaneously at the base of the rat tails without anesthesia.
NOTE: The tail does not need to be pre-warmed before the injection. Each rat is immunized with 1 mg of lacrimal gland extract and 200 µg of ovalbumin in complete Freund's adjuvant with 500 µg of Mycobacterium tuberculosis H37Ra. - On day 14, inject 200 µL of the emulsion, which contains 1 mg of lacrimal gland extract and 200 µg of ovalbumin in incomplete Freund's adjuvant, in the same manner as on day 0. Inject 300 ng of pertussis toxin in 100 µL of PBS intraperitoneally per rat on the same day.
4. Injection of the Antigen Mixture into the Forniceal Subconjunctiva and Lacrimal Gland to Recruit Antigen-specific Immune Cells and Cause Local Inflammation
- Calculate the amount of ovalbumin and lacrimal gland extract based on the number of rats in the experiment. Weigh the required amount of ovalbumin and combine it with the defrosted lacrimal gland extract prepared in step 1, making antigen solution containing 1 mg/mL ovalbumin and 1 mg/mL lacrimal gland extract.
- Anesthetize the rats with ketamine (75 mg/kg) and xylazine (10 mg/kg) by intraperitoneal injection. Pinch the toes of rats to ensure that proper anesthesia has been achieved (i.e., no responsive movement is observed after the pinch). Inject 5 µL of antigen into the forniceal subconjunctiva of the eye. Inject 20 µL of antigen into the lacrimal gland.
5. Assessment of Dry Eye Features
NOTE: For steps 5.1-5.3, the anesthetized rats should be held gently by a gloved hand in an upright position on a flat surface to avoid movement.
- Measure the tear volume with phenol red thread.
- Use one pair of forceps to hold the thread and another to pull the lower eyelid of rat. Place the thread at the proximal corner of the lower fornix for 1 min and then remove the thread.
NOTE: Tears make the wetted part of the thread red in color. - Take an image of the length of the wetted part of the thread next to a ruler with millimeter markings. Measure the wetted length to the tenth of a millimeter using an image software (e.g., ImageJ).
- Use one pair of forceps to hold the thread and another to pull the lower eyelid of rat. Place the thread at the proximal corner of the lower fornix for 1 min and then remove the thread.
- Measure cornea/tear smoothness.
- Place the rat under a stereomicroscope equipped with a ring illuminator and a camera. Apply 5 µL of saline to the rat cornea. Passively blink by moving the upper and lower eyelids with gloved fingers ~5 times to spread the saline.
- Focus the ring illuminator on the middle of the cornea surface under 1.6x magnification. Acquire photographic images after 10 s.
NOTE: The ring illuminator projects two circular rows of dot images on the corneas of the animal. Regular spacing of the undistorted dots suggests a smooth cornea/tear layer.
- Measure corneal damage with fluorescein staining.
- Add 2 µL of 0.2% fluorescein to the rat cornea. Passively open and close the rat eyelids 3 times with a gloved finger to spread the fluorescein dye on the surface of the eye.
- After 1 min, draw 1 mL of saline with a 3 mL syringe (without any needle attachment), position the syringe about 2-3 mm anterior to the cornea, and gently propel saline onto the eye.
- Acquire images under the cobalt blue filter (i.e., ~400 nm) of an ocular-imaging microscope with the background lights switched off.
NOTE: Images were subsequently analyzed by a grading system modified from previous publications23. Images were then analyzed by subjectively grading the number, area, and intensity of the green spots from 0 to 2, where 0 indicates their absent, 1 indicates punctate staining of less than 50 spots, and 2 indicates punctate staining of more than 50 spots.
- Euthanize the rats through the intraperitoneal injection of pentobarbital (80 mg/kg). Remove the upper and lower eyelids using scissors. Fix and prolapse the eyeballs by pushing down on the periocular tissues with forceps. Free the globe by severing the extraocular muscles, the optic nerve, and the forniceal conjunctiva.
- Fix the position of the rat eyeball with forceps and open it with a circumferential incision along the equator. Remove the lens and vitreous. Put the dissected eyeballs into 1.5 mL tubes on ice.
- Collect the lacrimal glands, as described in step 1.1. Immediately transfer the dissected eyeball tissues and lacrimal glands to the laboratory to prepare for flow cytometry analysis.
- Isolated the immune cells with collagenase and dispase II digestion methods24,25. Proceed to use flow cytometry to profile the T-cell subpopulation in the eyeball tissues26.
NOTE: The panel of antibodies are: anti-CD45APC-Cyanine7 (OX-1), anti-CD3 BV421 (1F4), anti-CD4 PE-Cyanine7 (OX-35), anti-CD45RC Alexa647 (OX-22), anti-CD62 PE (HRL1), anti-CD44 FITC (OX-50), and viability cell dye 7-AAD. Among the CD45+CD3+7AAD- population, naïve (CD3+CD45RC+), effector memory (TEM, CD3+CD45RC-CD44+CD62L-), and central memory (TCM, CD3+CD45RC-CD44+CD62L+) T cells were gated.
Results
Figure 1 illustrates the experiment design. On both day 48 and day 70, dry eye clinical features are assessed in the immunized rats. The tear volume is represented by the length of the wet part of the phenol red thread. Figure 2 shows representative images of phenol red threads from control and DED rats. The length of the phenol red threads in the DED group is shorter than the control group, indicating less tear volume.
Fluorescein binds to damaged corneal epithelium. Thus, corneal damage is measured by corneal fluorescein staining. Fluorescein spots on the corneal surface of DED rats were graded from 0 to 2 and compared to control rats. Rats with DED have more fluorescein staining than control rats (Figure 3), suggesting corneal damage.
The corneal smoothness in DED and control rats was assessed by the ring illuminator. If the corneal surface is smooth, with high tear stability, the image of the illuminator ring on the ocular surface is round and perfect. Distortion of the image indicates reduced corneal smoothness and an unstable tear film. The distortion degree of the ring was graded from 0 to 2. A higher ring distortion level was noted in the DED group (Figure 4), indicating less tear stability.
Rats are defined as having dry eye when at least two clinical features of dry eye are abnormal. Among the 24 immunized rats, 21 rats developed DED on day 48. The results were consistent when evaluated on day 70.
The flow cytometry analysis shows that the predominant T-cell subset in normal rat eyeball tissues are effector memory T cells (Figure 5). In the eyeballs of DED rats, ~70% of the CD3+ T cells are effector memory T cells, while in control rats, this number is ~50%. Eyeballs of DED rats have significantly higher effector memory T cells than those of control rats (Figure 6).
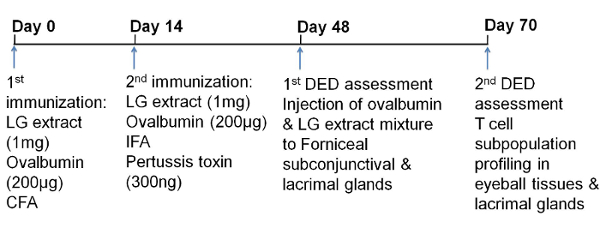
Figure 1: Schematic of the Experimental Design. LG: lacrimal gland; DED: dry eye disease; CFA: complete Freund's adjuvant; IFA: incomplete Freund's adjuvant. Please click here to view a larger version of this figure.
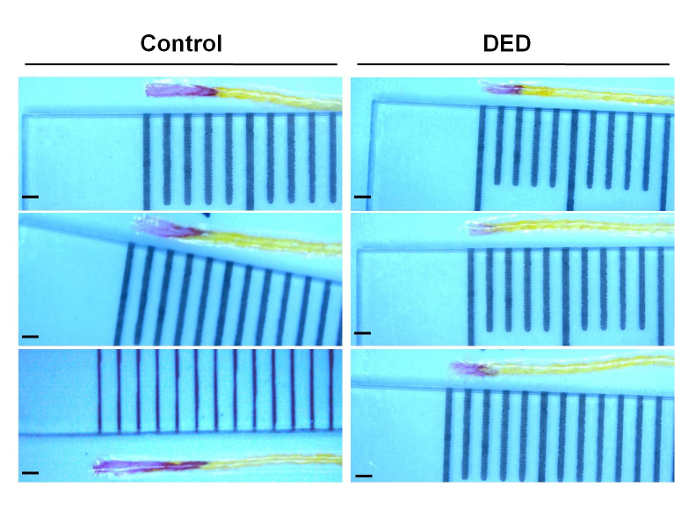
Figure 2: Phenol Red Thread Measures the Tear Volume. Phenol red thread is placed at the proximal corner of both rat eyes for 1 min and is then removed. Representative images of the phenol red thread, together with a ruler, from both control and DED groups are shown. ImageJ was used to measure the length of the wet part of the phenol red threads. Scale bar = 1 mm. Please click here to view a larger version of this figure.
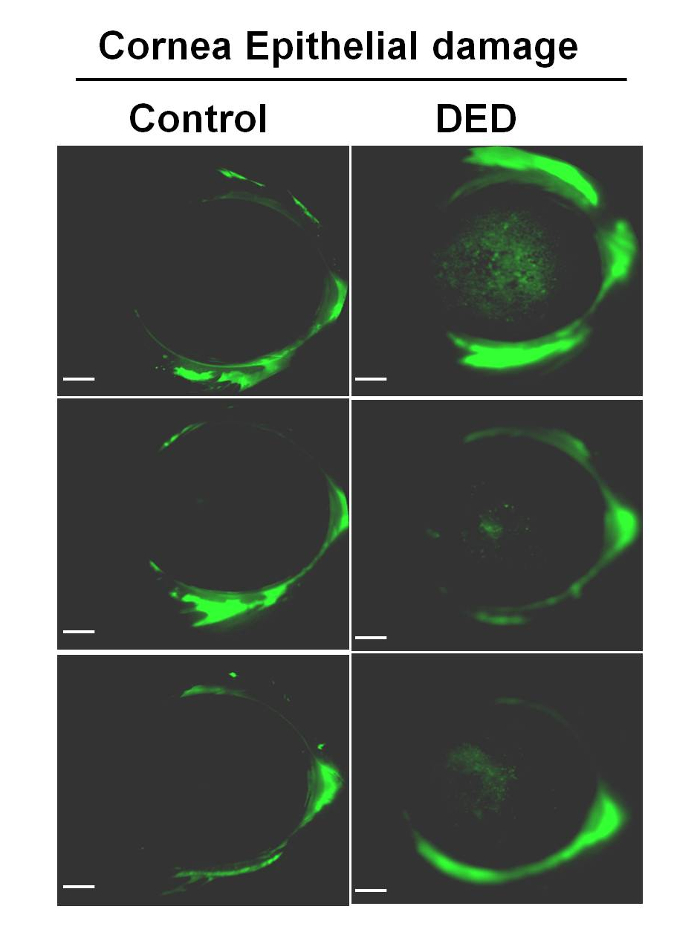
Figure 3: Representative Images of the Corneal Epithelial Damage Measured by Fluorescein Staining. Each rat cornea was stained with 0.2% fluorescein for 1 min and flushed with at least 1 mL of saline. Images were taken under an eye imaging microscope with cobalt blue light. The first column shows representative images of control corneas. The second column contains representative images of corneal staining from rats with DED features. The green fluorescent spots indicate corneal epithelial damage. All images were produced on the same color scale. The quantification of fluorescein staining was performed according to the area and density of the green spots. Scale bar = 1 mm. Please click here to view a larger version of this figure.
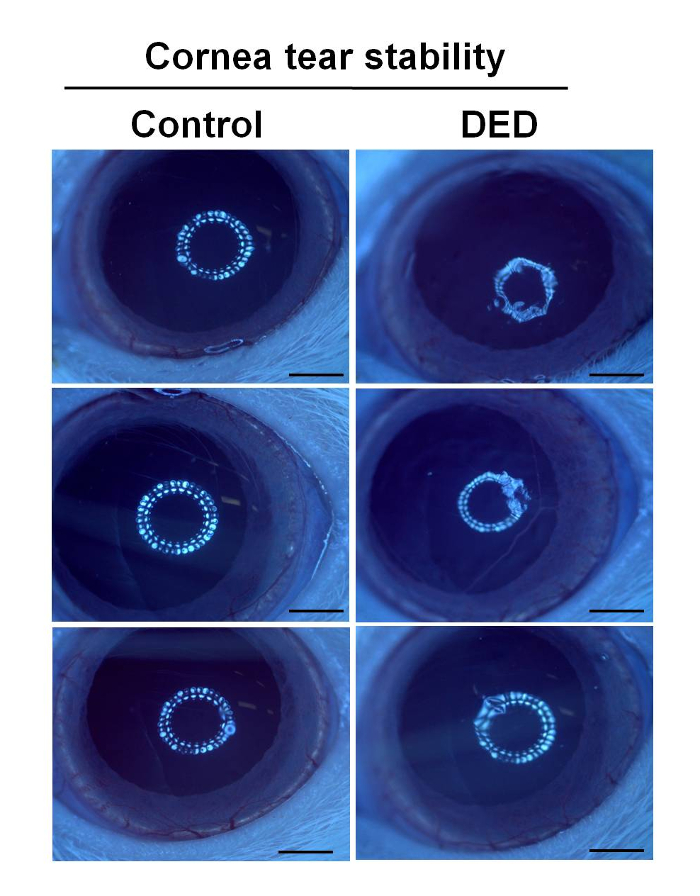
Figure 4: Representative Cornea Images Showing the Reflection of the Ring Illuminator. Rat corneal/tear smoothness was measured by a ring illuminator. The distortion degree of the ring in the captured images is a measure of relative tear stability. The left column shows the representative images in control animals, and the right column shows representative images after the induction of dry eye. Scale bar = 1 mm. Please click here to view a larger version of this figure.
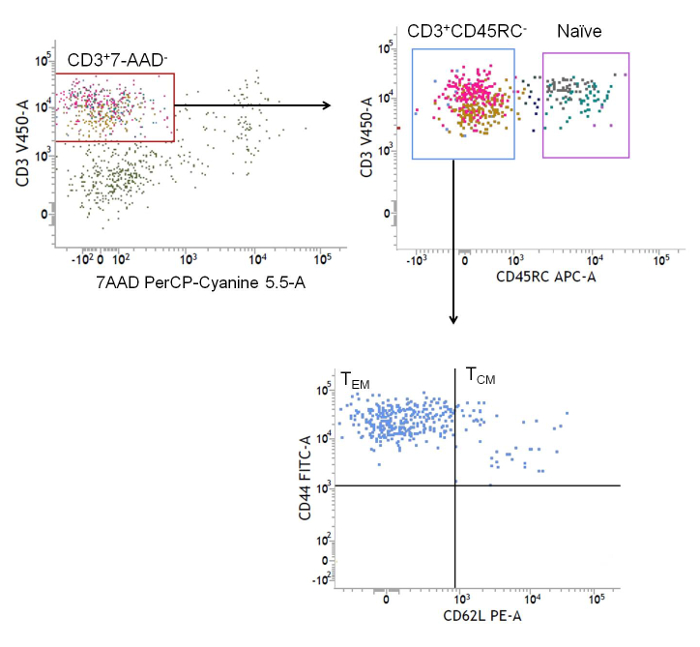
Figure 5: Dot Plots Derived from Flow Cytometry Analysis. T cells isolated from eyeball tissues were stained with a panel of antibodies. In the CD45+CD3+7AAD- population, CD3+7-AAD- T cells were gated. Among the CD3+7-AAD- T cells, the naïve, central memory, and effector memory T cell populations were determined. Please click here to view a larger version of this figure.
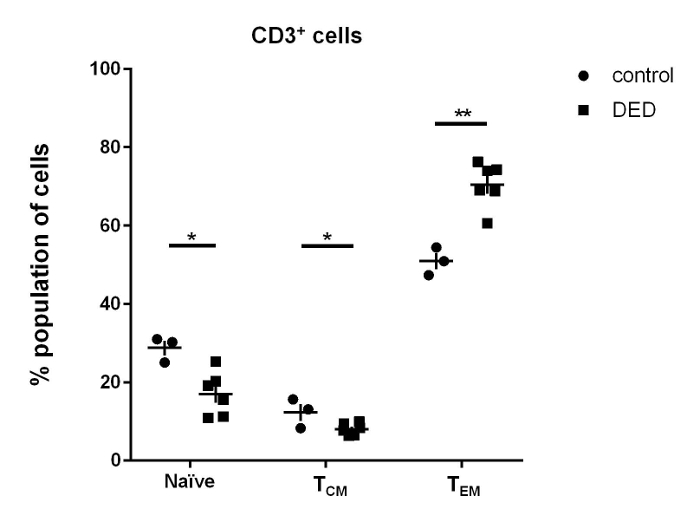
Figure 6: T-cell Subpopulation Profile in the Eyeballs. CD3+CD45RC+ naïve T cells, CD3+CD45RC-CD44+CD62L- effector memory T (TEM) cells, and CD3+CD45RC-CD44+CD62L+ central memory T (TCM) cells are presented as the percentage of CD3+ T cells. Results are from 3 control rats and 6 DED rats. Similar results were obtained from the analysis of T cells from isolated lacrimal glands (data not shown). The unpaired Student's t-test was used for statistical comparison. The error bars represent the SD. * p <0.05, ** p <0.01. Please click here to view a larger version of this figure.
Discussion
A critical step of this protocol is ensuring the homogeneity of the emulsion. In well-prepared emulsions, the antigens are completely coated with oil, ensuring the slow release of the injected antigen and continuous immune stimulation. Another critical feature of this protocol is the use of Lewis rats. Lewis rats are more sensitive to the development of autoimmune disease than other strains27.
This protocol has been modified from two previously published protocols, which either used lacrimal gland extract only or recombinant Klk1b2220,21. In the current protocol, ovalbumin plus lacrimal gland extract are used as the antigen, and antigen-specific immune cells are attracted to the ocular surface and the lacrimal gland, inducing local tissue damage. Dry eye develops slowly, reaching ~85% by day 48 after the initial immunization. Antigenic challenge to the eye and lacrimal gland on day 48 exacerbates dry eye and ensures its chronicity up to day 70.
Compared to the recombinant Klk1b22 in the Klk-induced DED model, the lacrimal gland extract and ovalbumin used in the current model are cheaper and easier to obtain. The lacrimal gland extract also contains other proteins, apart from Klk, that may induce autoimmunity, so this extract is theoretically more potent than the Klk method at inducing DED. We have also tried immunizing rats with lacrimal gland extract only; although these immunized rats developed DED, there was no significant increase of effector memory T cells in eyeball tissues compared to controls.
The limitation of this technique is that it takes 70 days to achieve the model. Effector memory T cells are the main T-cell subsets in the normal rat eye. In this model, autoimmune DED results in an increase in CD3+ effector memory T cells in the eyeball. Drugs that preferentially suppress effector memory T cells, such as selective inhibitors of the Kv1.3 potassium channel, may therefore have a therapeutic benefit on autoimmune DED28.
Disclosures
The authors have no conflicts of interest. L.T. received prior funding and/or gifts from Alcon, Allergan, Santen, Bausch and Lomb, Eyelens, and Eyedetec.
Acknowledgements
The authors would like to thank Ms. Tin Min Qi and Dr. Veluchamy Amutha Barathi and her team for their help with handling the animals. This work was supported by NHIC-I2D-1409007, SingHealth Foundation SHF/FG586P/2014, and NMRC/CSA/045/2012.
Materials
| Name | Company | Catalog Number | Comments |
|---|---|---|---|
| Reagents | |||
| Protease inhibitor cocktail | Sigma-Aldrich | P2714-1BTL | |
| Pierce BCA Protein Assay Kit | Thermal Scientific | 23227 | |
| Mycobacterium tuberculosis H37Ra | Becton, Dickinson and company | 231141 | |
| complete Freund's adjuvant | Becton, Dickinson and company | 231131 | |
| ovalbumin | Sigma-Aldrich | A5503-10G | |
| incomplete Freund's adjuvant | Sigma-Aldrich | F5506-6X10ML | |
| pertussis toxin | Sigma-Aldrich | P7208-50UG | |
| fluorescein sodium solution | Bausch & Lomb U.K Limited | NA | |
| Name | Company | Catalog Number | Comments |
| Equipment | |||
| Sonicator | Sonics | Vibra-Cell | |
| phenol red thread | Tianjin Jingming New Technological development Co. LTD. | NA | |
| Stereo microscope with ring light illuminator and camera | Carl Zeiss | NA | |
| Micro IV microscope | Phoenix Research Labs | NA |
References
- The definition and classification of dry eye disease: report of the Definition and Classification Subcommittee of the International Dry Eye WorkShop (2007). Ocul Surf. 5 (2), 75-92 (2007).
- Gayton, J. L. Etiology, prevalence, and treatment of dry eye disease. Clin Ophthalmol. 3, 405-412 (2009).
- Tong, L., Tan, J., Thumboo, J., Seow, G. The dry eye. Praxis (Bern 1994). 102 (13), 803-805 (2013).
- Messmer, E. M. The pathophysiology, diagnosis, and treatment of dry eye disease. Dtsch Arztebl Int. 112 (5), 71-81 (2015).
- Liu, K. C., Huynh, K., Grubbs, J., Davis, R. M. Autoimmunity in the pathogenesis and treatment of keratoconjunctivitis sicca. Curr Allergy Asthma Rep. 14 (1), 403(2014).
- Stevenson, W., Chauhan, S. K., Dana, R. Dry eye disease: an immune-mediated ocular surface disorder. Arch Ophthalmol. 130 (1), 90-100 (2012).
- Tong, L., Thumboo, J., Tan, Y. K., Wong, T. Y., Albani, S. The eye: a window of opportunity in rheumatoid arthritis. Nat Rev Rheumatol. 10 (9), 552-560 (2014).
- Carnahan, M. C., Goldstein, D. A. Ocular complications of topical, peri-ocular, and systemic corticosteroids. Curr Opin Ophthalmol. 11 (6), 478-483 (2000).
- Johannsdottir, S., Jansook, P., Stefansson, E., Loftsson, T. Development of a cyclodextrin-based aqueous cyclosporin A eye drop formulations. Int J Pharm. 493 (1-2), 86-95 (2015).
- Prabhasawat, P., Tesavibul, N., Karnchanachetanee, C., Kasemson, S. Efficacy of cyclosporine 0.05% eye drops in Stevens Johnson syndrome with chronic dry eye. J Ocul Pharmacol Ther. 29 (3), 372-377 (2013).
- Ishimaru, N., et al. Severe destructive autoimmune lesions with aging in murine Sjogren's syndrome through Fas-mediated apoptosis. Am J Pathol. 156 (5), 1557-1564 (2000).
- Jonsson, R., Tarkowski, A., Backman, K., Holmdahl, R., Klareskog, L. Sialadenitis in the MRL-l mouse: morphological and immunohistochemical characterization of resident and infiltrating cells. Immunology. 60 (4), 611-616 (1987).
- Jonsson, R., Tarkowski, A., Backman, K., Klareskog, L. Immunohistochemical characterization of sialadenitis in NZB X NZW F1 mice. Clin Immunol Immunopathol. 42 (1), 93-101 (1987).
- Li, H., Dai, M., Zhuang, Y. A T cell intrinsic role of Id3 in a mouse model for primary Sjogren's syndrome. Immunity. 21 (4), 551-560 (2004).
- Shull, M. M., et al. Targeted disruption of the mouse transforming growth factor-beta 1 gene results in multifocal inflammatory disease. Nature. 359 (6397), 693-699 (1992).
- Green, J. E., Hinrichs, S. H., Vogel, J., Jay, G. Exocrinopathy resembling Sjogren's syndrome in HTLV-1 tax transgenic mice. Nature. 341 (6237), 72-74 (1989).
- Shen, L., et al. Development of autoimmunity in IL-14alpha-transgenic mice. J Immunol. 177 (8), 5676-5686 (2006).
- Hayashi, Y., Hirokawa, K. Immunopathology of experimental autoallergic sialadenitis in C3H/He mice. Clin Exp Immunol. 75 (3), 471-476 (1989).
- Liu, S. H., Zhou, D. H. Experimental autoimmune dacryoadenitis: purification and characterization of a lacrimal gland antigen. Invest Ophthalmol Vis Sci. 33 (6), 2029-2036 (1992).
- Liu, S. H., Prendergast, R. A., Silverstein, A. M. Experimental autoimmune dacryoadenitis. I. Lacrimal gland disease in the rat. Invest Ophthalmol Vis Sci. 28 (2), 270-275 (1987).
- Jiang, G., et al. A new model of experimental autoimmune keratoconjunctivitis sicca (KCS) induced in Lewis rat by the autoantigen Klk1b22. Invest Ophthalmol Vis Sci. 50 (5), 2245-2254 (2009).
- Walker, J. M. The bicinchoninic acid (BCA) assay for protein quantitation. Methods Mol Biol. 32, 5-8 (1994).
- Lin, Z., et al. A mouse dry eye model induced by topical administration of benzalkonium chloride. Mol Vis. 17, 257-264 (2011).
- Cousins, S. W., Streilein, J. W. Flow cytometric detection of lymphocyte proliferation in eyes with immunogenic inflammation. Invest Ophthalmol Vis Sci. 31 (10), 2111-2122 (1990).
- Yawata, N., et al. Dynamic change in natural killer cell type in the human ocular mucosa in situ as means of immune evasion by adenovirus infection. Mucosal Immunol. 9 (1), 159-170 (2016).
- Chen, Y., Chauhan, S. K., Lee, H. S., Saban, D. R., Dana, R. Chronic dry eye disease is principally mediated by effector memory Th17 cells. Mucosal Immunol. 7 (1), 38-45 (2014).
- Goldmuntz, E. A., et al. The origin of the autoimmune disease-resistant LER rat: an outcross between the buffalo and autoimmune disease-prone Lewis inbred rat strains. J Neuroimmunol. 44 (2), 215-219 (1993).
- Cahalan, M. D., Chandy, K. G. The functional network of ion channels in T lymphocytes. Immunol Rev. 231 (1), 59-87 (2009).
Reprints and Permissions
