

Summary
This work describes a nanoimprinting lithography method to fabricate high-quality sensing arrays that work on the principle of extraordinary optical transmission. The biosensor is low-cost, robust, easy to use, and can detect cardiac troponin I in serum at clinically relevant concentrations (99th percentile cutoff ∼10-400 pg/mL, depending on the assay).
Abstract
For a biosensing platform to have clinical relevance in point-of-care (POC) settings, assay sensitivity, reproducibility, and ability to reliably monitor analytes against the background of human serum are crucial.
Nanoimprinting lithography (NIL) was used to fabricate, at a low cost, sensing areas as large as 1.5 mm x 1.5 mm. The sensing surface was made of high-fidelity arrays of nanoholes, each with an area of about 140 nm2. The great reproducibility of NIL made it possible to employ a one-chip, one-measurement strategy on 12 individually manufactured surfaces, with minimal chip-to-chip variation. These nanoimprinted localized surface plasmon resonance (LSPR) chips were extensively tested on their ability to reliably measure a bioanalyte at concentrations varying from 2.5 to 75 ng/mL amidst the background of a complex biofluid-in this case, human serum. The high fidelity of NIL enables the generation of large sensing areas, which in turn eliminates the need for a microscope, as this biosensor can be easily interfaced with a commonly available laboratory light source. These biosensors can detect cardiac troponin in serum with a high sensitivity, at a limit of detection (LOD) of 0.55 ng/mL, which is clinically relevant. They also show low chip-to-chip variance (due to the high quality of the fabrication process). The results are commensurable with widely used enzyme-linked immunosorbent assay (ELISA)-based assays, but the technique retains the advantages of an LSPR-based sensing platform (i.e., amenability to miniaturization and multiplexing, making it more feasible for POC applications).
Introduction
Chemical sensors based on nanohole arrays have been a subject of numerous investigations since the first report on extraordinary optical transmission (EOT) was published by Ebbesen et al. in 19981. When light impinges on periodic arrays of nanohole structures of sub-wavelength dimensions, enhanced transmission occurs at specific wavelengths. This occurs when the incident light couples with Bloch-wave surface polariton (BW-SPP) and/or localized surface plasmons (LSP)2.
The underlying physical principle exploited when biosensing with such periodic arrays is simple. Adsorption of molecules onto or near the interface of metal changes the dielectric constant of the medium in contact with the metal, in turn shifting the location of the transmission bands in the spectrum. The spectrum itself can be adjusted by nano-engineering the shape, size, and separation distance3,4,5. By design, sensors based on EOT have characteristic bands in their spectra that facilitate specific assignments6,7,8 during the investigation of molecular binding events. This is a crucial advantage over commercially available surface plasmon resonance (SPR) platforms.
Sensors using EOT typically involve a light source optically aligned such that a collimated beam is incident on the sensing surface. Techniques to generate large nanohole surfaces, such as co-polymer templates and interference and nanosphere lithography, have poor reproducibility9. Due to these limitations in accurately fabricating large surfaces that show the EOT phenomenon, an optical microscope was required to correctly position the light source and detector. To simplify the technique, high-quality nanoimprinting lithography (NIL)10 was employed. This enabled the production of large sensor surface areas11 (mm-scale), removing the need for a microscope to look for the sensing surface on a chip. Instead, this sensor could be easily interfaced with a standard fiber optic cable.
Since the transmission peaks for this nanohole array are contained in the visible to near-infrared region (NIR), it is perfectly suited to sensing binding events for biomolecules in an aqueous environment. The expected optical behavior of the nanohole array was simulated. The result was then verified through studies with liquids of standard refractive indexes (RI). This array was then used to measure the concentration of cardiac troponin I (cTnI) in the complex background of human serum. cTnI is the clinical gold standard for the diagnosis of acute myocardial infarction.
Using this sensor, it is possible to detect and quantify cTnI in human serum at a limit of detection (LOD) of 0.55 ng/mL, which is clinically relevant. The detection is much quicker than the most commonly used technology in this domain, enzyme-linked immunosorbent assay (ELISA). Furthermore, the sensing surface can easily be regenerated and therefore reused. Hence, this work demonstrates the promise of nanohole arrays as a viable point-of-care (POC) technology for biosensing within complex biofluids.
Subscription Required. Please recommend JoVE to your librarian.
Protocol
1. Fabrication of the Sensor and Acquisition of the Data
- Preparation of the nickel mold
- Coat a 220 nm-thick layer of negative electron beam resist onto a 600 µm-thick 4-in silicon wafer. Write the designed nanohole array on this wafer using an electron beam lithography system.
- To accelerate the e-beam writing, write the patterns with a low dotmap (N) of 20k for each 300 µm field size (A) (i.e., there are 0.4 billion dots mapped on each 300 µm2 area, and each dot will either be exposed by the e-beam or not, depending on the pattern design). Set the e-beam resist exposure dose for the resist to 110 µC cm−2 and write at a current (I) of 800 pA.
NOTE: In e-beam writing, the exposure dose (D) is controlled by the exposure time for each dot (Tdot), calculated by . For the exposure dose at 110 µC cm−2, the e-beam dwelling time on each exposed dot is 0.5 µs12. Since the array captures an area of 1.8 mm2, there are a total of 36 patches of 300-µm2 field areas stitched together to form one large, gold nanohole array.
- To accelerate the e-beam writing, write the patterns with a low dotmap (N) of 20k for each 300 µm field size (A) (i.e., there are 0.4 billion dots mapped on each 300 µm2 area, and each dot will either be exposed by the e-beam or not, depending on the pattern design). Set the e-beam resist exposure dose for the resist to 110 µC cm−2 and write at a current (I) of 800 pA.
- Develop the resist by immersing the 4 inch silicon wafer in the developer solution for 10 s and letting the wafer dry in air.
- Deposit a seed layer of a metal, such as nickel, copper, or aluminum, on the silicon wafer.
- Electroplate the wafer in a plating system in a nickel sulfamate bath. Carry out the electroplating in two steps. In the first step, lasting 95 min, use a current density of 0.7 A dm−2; this completely fills the nanopatterns with nickel. In the second step, lasting 125 min, use 12 A dm−2 to reach 300 µm as the final nickel mold thickness (20 nm). Ensure that the pH value is at 3.5 - 3.8 and that the temperature is at 52 - 54 °C.
- Separate the nickel mold from the silicon substrate by applying gentle mechanical force. Soak the nickel mold in about 100 mL of positive photoresist removal reagent overnight to wash away the residue from the e-beam resist.
- Feed the nickel mold into an oven and dry it at 100 °C for 3 h. Clean it in a plasma etching system with O2 gas at 10 sccm and 100 W for 3 min.
- Coat a 220 nm-thick layer of negative electron beam resist onto a 600 µm-thick 4-in silicon wafer. Write the designed nanohole array on this wafer using an electron beam lithography system.
- Fabrication of the gold nanostructure
- Coat 150 µL of heptadecafluoro-1,1,2,2-tetrahydrodecyl trichlorosilane (FDTS) on the nickel mold in a self-assembly monolayer (SAM) coating machine at 80 °C.
NOTE: This will form an anti-adhesive layer, which will enable the separation of the mold from the photoresist ("demolding") after the completion of the nanoimprinting step. The vaporizing time should be 180 s, and the reaction time should be 900 s. - Imprint the nanopatterns on a 4-in glass wafer that has been coated with a 300 nm-thick layer of photo-curable NIL resist using a nano-imprinter at a pressure of 10 bar and a temperature of 40 °C for 10 min.
- Transfer the mold, the photoresist, and the glass wafer to a UV light curing system and photocure with 75 mW cm-2 of UV exposure for 30 s.
NOTE: If all steps have been followed correctly, the nickel mold should easily be demolded from the photoresist. - In a reactive ion etching (RIE) system, perform a blank etch of the photoresist on the glass substrate, with an O2 gas flow of 10 sccm, at 50 W for 2 s to expose the glass on the indented areas.
- Deposit a 5 nm-thick layer of chromium (Cr) for metal adhesion and a 100-nm layer of gold (Au) for the plasmonic sensor on the glass wafer in an electron-beam deposition machine. Use a deposition rate of 1 Å s−1 for Cr and 2 Å s−1 for Au.
- Perform lift-off of the photoresist by O2 plasma etching for 3 min followed by a 15-s sonification step in acetone.
- Dice the sample into 5 mm × 5 mm chips. The nanohole array will occupy the central 2 mm × 2 mm of the chip.
- Coat 150 µL of heptadecafluoro-1,1,2,2-tetrahydrodecyl trichlorosilane (FDTS) on the nickel mold in a self-assembly monolayer (SAM) coating machine at 80 °C.
- Acquisition of the data
- Set up the apparatus to make the optical measurements such that a beam of white light exiting through the end of the transmitter optical fiber is collimated and is incident on the sensor surface (nanohole array) at 90°.
NOTE: Light is transmitted through the whole nanohole array. - Collect the transmitted signal with the receiver optical fiber and record it with a UV-visible spectrometer operating within the range of 300 to 1,000 nm.
- Set the acquisition time for each frame to 20 ms. Average 100 frames to obtain the final spectrum to lower the noise in the measurements.
- Use plotting software to analyze the data based on the previously identified transmission peaks (using a Lorentz-based method).
- Set up the apparatus to make the optical measurements such that a beam of white light exiting through the end of the transmitter optical fiber is collimated and is incident on the sensor surface (nanohole array) at 90°.
 . For the exposure dose at 110 µC cm−2, the e-beam dwelling time on each exposed dot is 0.5 µs12. Since the array captures an area of 1.8 mm2, there are a total of 36 patches of 300-µm2 field areas stitched together to form one large, gold nanohole array.
2. Sensor Bulk Sensitivity Test
- Deposit the standard RI liquid into the liquid cell, with the RI varying from 1.31 to 1.39.
- Immerse the sensor chip in the standard RI liquid and align it with the beam of white light. Obtain the transmission spectrum.
- Clean the sensor chip after each measurement with a surface-active cleaning reagent and dry it with nitrogen gas.
3. Sensor Surface Modification
- Prior to any chemical modifications, clean the sensor chips by sequential immersion in isopropanol, acetone, and deionized water. Dry at room temperature in a stream of dry nitrogen gas.
- Incubate the sensor chips in an ethanolic solution of 0.4 mM 10-carboxy-1-decanethiol and 1.6 mM 1-octanethiol for 12 h at room temperature.
NOTE: This will form an amine-reactive self-assembly monolayer (SAM). - Use ethanol to rinse thoroughly and dry at room temperature.
- Make a mixture of 75 mM sulfo-N-hydroxysuccinimide (sulfo-NHS) and 15 mM 1-ethyl-3-(3-dimethylaminopropyl) carbodiimide (EDC). Immerse the chips in this mixture for 15 min.
NOTE: This will activate the carboxylic group of the SAM. - Spot 50 µL of 200 µg/mL anti-troponin antibody solution made in a pH 4.5 acetate buffer on the sensor surface and incubate for 30 min.
- Deactivate the unreacted esters by immersing the sensor chip in 1 M ethanolamine-HCl solution for 15 min.
- Rinse the chip with deionized water and dry it in a stream of dry nitrogen gas at room temperature.
4. cTnI Assay
- Block any non-specific binding by spotting 100 µL of 1% bovine serum albumin (BSA) solution onto the surface. Incubate for 15 min.
- Rinse the sensor chips three times in phosphate-buffered saline (PBS) solution. Insert the chip into the measurement cell to record the transmission spectrum.
NOTE: This is the reference spectrum. - Spot 50 µL of cTnI standard onto the chip surface and incubate in a moist environment for 30 min.
- Rinse the sensor chips three times in PBS solution and insert it into the measurement cell to record the transmission spectrum.
NOTE: This is the after-binding spectrum. - Submerge the chips in 50 mM glycine-HCl (pH 2) for 1 min and then rinse in PBS solution three times to regenerate the chip surface. Measure the transmission spectrum in PBS to verify the success of the regeneration step.
5. Surface Plasmon Resonance (SPR) Measurement
- Run the multiplexed SPR sensor chip on the SPR system with PBS-T buffer.
NOTE: The composition of PBS-T buffer is 20 mM Na-phosphate, 150 mM NaCl, and 0.05% Tween 20. The pH is 7.4. - Use cTnI standard and the antibody, as described in step 4.
- Activate 3 out of the 6 available channels with a mixture of EDC (0.2 M) and sulfo-NHS (0.05 M) for 5 min. Perform a 5 min injection of 50 µg/mL antibody 560 and a 5-min injection of 1 M ethanolamine-HCl solution.
- Rotate the sensor chip by 90° and inject the cTnI standards at different concentrations (75, 30, 7.5, and 2.5 ng/mL).
- Observe the conjugation to the antibody at spots of interaction on the chip in real time through the SPR readout.
- Regenerate the chip by injecting 50 mM glycine-HCl (pH 2) for 1 min.
Subscription Required. Please recommend JoVE to your librarian.
Representative Results
The optical setup for taking measurements is shown in Figure 1A. An image of the actual nanohole array is given in Figure 1B. To understand the physics driving the sensing process, the COMSOL simulation software was used to simulate the distribution of the plasmonic field in an aqueous environment. The results from the simulation were then related to the actual measurement. A previously published study contains details of the assumptions made and the parameters used in the simulation11,13. The physical dimensions used for simulating the plasmonic field for the nanohole array was as follows: p = 400 nm, D = 150 nm, and T = 100 nm. Absorption and scattering effects are also taken into account14 when calculating the transmission spectrum. The simulated spectrum is compared to the experimentally measured spectrum in Figure 1C. Both the simulated and the measured spectra convey the existence of four bands from 450 to 850 nm. The band at 495 nm corresponds to the interband transition of gold. The three subsequent bands, henceforth called bands I-III in increasing order of wavelength, are located at 560 nm, 645 nm, and 712 nm, respectively. Bands I-III were observed to have acceptable alignment to the experimentally measured bands, located at 558 nm, 638 nm, and 724 nm. As the fabricated nanoholes are nearly circular in shape, these bands should not be sensitive to polarization of incident light. Additionally, the COMSOL simulation enables the direct visualization of the near-field distribution of these bands as they would occur in a unit cell of the periodic structure (Figure 1D). The unit on the color bar is the optical field distribution (V/m) expressed in a log scale. The highest intensity observed was around 4.7 (50,119 V/m). Compared to the intensity of the incidence used in the simulation (4,340 V/m), this magnitude represents a 11.5-fold field enhancement. The electromagnetic fields for bands I and III were localized on the surface of the glass substrate. In contrast, band II was predominantly localized at the top rim of the nanohole and was chosen for the detection of the bioanalyte. Figure 1E illustrates the transmission spectra of the nanohole array in liquids of known refractive indexes, which varied from 1.31 to 1.39. Three transmission bands, corresponding to bands I, II, and III, were observed in the spectrum range of 400 - 900 nm. A red shift was observed with a change in RI. The magnitude of the shift followed the sequence band II > band I > band III. Figure 1F is a consolidation of the observed red shifts of bands I, II, and III. The bulk sensitivity calculated for band I was 322 nm/RIU, for band II was 345 nm/RIU, and for band II was 202 nm/RIU.
Figure 2A contains the schematic of the sensing phenomenon in action. Figure 2B shows the change in the transmission spectra after the cardiac troponin molecules bind to the functionalized chip surface. At low concentrations, there is a linear shift in the band with the troponin level. The shift in the band position can be fitted well to a binding isotherm with an R2 value of 0.995. Upon closer observation, 30 ng/mL seems to be the concentration at which the isotherm indicates the onset of saturation (Figure 2C).
Figure 3A shows the sensorgram from the interaction of serum with the chip surface of a modified GLC chip in an XPR36 setup. The capture of cTnI is shown by the rise in the signal. Thereafter, the dissociation of cTnI in a PBST medium (1x PBS, 0.05% tween 20) can be observed as the signal decreases from 120 - 660 s. Injecting glycine (the regeneration solution) for 1 min reduced the signal to 0, indicating the regeneration of the sensing surface through the complete disengagement of cTnI. The sensorgram for the subsequent association of cTnI to the regenerated chip surface is shown in the inset of Figure 3A. The same protocol (i.e., immersing in glycine solution for 1 min) was used to regenerate the nanohole array surface. Figure 3B shows that the position of band 2 shifts back to its original position, thereby confirming the success of the regeneration step.

Figure 1: Characterization of the nanohole array. (A) Simplified schematic of the experimental setup. (B) Scanning electron microscope image of the nanohole array. (C) Comparison between the simulated spectrum and the experimentally measured transmission spectrum in an aqueous environment. (D) The near field distribution as simulated in COMSOL for bands I and III, seen in a cross-sectional view. Red represents stronger near-field distribution. The unit shown in the color bar is |E|, the distribution of the optical field, taken in log scale. (E) Experimentally measured transmission spectra of the nanohole array in environments with standard refractive index liquids (1.31 to 1.39). (F) Bulk sensitivities of the three transmission bands (I-III) to changes in RI measured in the visible to NIR range. Black square: band I, red circle: band II, blue triangle: band III. The figure has been modified from Ding et al.14 under a CC BY license. Please click here to view a larger version of this figure.
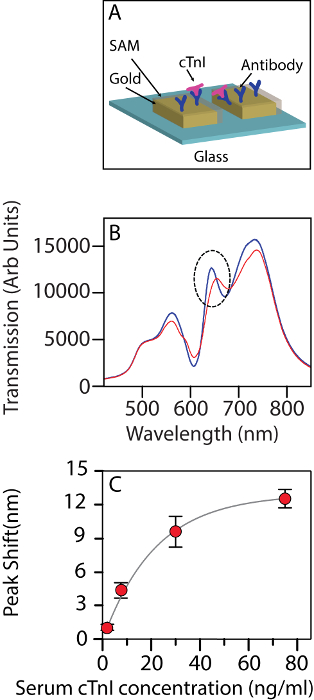
Figure 2: The nanohole array used as a biosensor. (A) Schematic of the nanohole array being used as a biosensor for detecting cTnI. (B) The change in the transmission spectrum of the biosensor upon interacting with human cTnI at a 30 ng/mL concentration in a background of serum. Blue: before interaction, red: after interaction. The dotted circle indicates the band being tracked. (C) The shift in wavelength for band II at different concentrations of troponin (2.5 ng/mL, 7.5 ng/mL, 30 ng/mL, and 75 ng/mL). The error bars show the standard deviation amongst the n = 3 chips used for each measurement. The figure has been modified from Ding et al.14 under a CC BY license. Please click here to view a larger version of this figure.

Figure 3: Regeneration of the sensor surface. (A) An SPR sensorgram from XPR36 showing the injection of analyte (cTnI) followed by the injection of glycine to regenerate the sensor surface. Subsequent detection measurements of different concentrations of cTnI against the serum background are shown in the inset. The red bar represents the initial value, while the black bar shows the measurement after the regeneration of the surface with the protocol described in the text. (B) The shift in the band wavelengths observed after regeneration of a nanohole biosensor chip. σ: standard deviation of shifts in the wavelength of the band position. The figure has been modified from Ding et al.14 under a CC BY license. Please click here to view a larger version of this figure.
Subscription Required. Please recommend JoVE to your librarian.
Discussion
Simulating the interaction between incident light and the nanostructures makes it possible to identify the appropriate peak (in the transmission spectrum), whose shift can be recorded as a function of the concentration of the analyte. It is important to note that the localization of the bands with respect to the structure of the sensor is crucial to the choice of the right band, whose shift can be tracked to sense the analyte. The visualization can be achieved through simulations. This is also critical to the design of an optimum structure that enables the biosensing of analytes. As seen here, bands I and III are localized on the glass-gold interface and hence are not useful for biosensing. A prominent LSPR component can be observed in band II. It shows a short decay length and is localized on the rim of the nanoholes. As such, this lends itself well to being used for sensing analyte concentrations. The quality of the fabricated nanostructures over the whole array is also essential to the quality of spectra collected. Non-uniform structures will introduce artefacts.
Scattering and unavoidable absorption create artefacts in an aqueous measurement. The overall signal-to-noise ratio is also disturbed by the presence of the aqueous medium. In case there are multiple suitable bands whose shifts can be monitored for biosensing, the following points must be considered. At sub 600 nm wavelengths, the observed transmission spectrum is markedly affected by protein absorption and particle scattering. On the other hand, using wavelengths larger than 900 nm could create confusion by concealing the important underlying signals emanating from the binding events, as in this region, the absorption by water increases with wavelength. For sensing analytes in an aqueous environment, therefore, band II is optimally located in terms of wavelength. A small deviation in the measurement of band position could be observed. This is caused by the large sensor size. While the large sensor eventually translates into shorter acquisition times because each of the detection pixels now see a larger-than-usual flux of photons, it also negatively impacts noise. In fact, if the signal collection is not performed properly and the data conditioning not optimally designed, a lot of noise can be observed. By averaging the collected signal over 100 frames15, the noise level can be lowered. While there are other ways to produce LSPR signals, particularly from gold nanoparticles16, the nanohole array is much more feasible to implement in a portable format with microfluidics. The whole device can be used for POC applications because of the ease of automation of the whole process and possibility of regenerating the sensing surface.
This experimental protocol has been designed to minimize experimental error by using transmission mode instead of reflectance. This cuts possible artefacts from angle-of-incidence changes. It is also important to point out the critical nature of step 3.4, when the antibody is crosslinked to the sensor surface. It is essential to preserve the reactivity of both sulfo-NHS and EDC. It was also found that switching from NHS to sulfo-NHS was critical for improved stability. If the samples are to be reused, storage under liquid nitrogen is recommended. The platform technology that is shown here can be used to monitor other clinical biomarkers, with appropriate surface modification.
Thus far, the penetration of LSPR sensors has been restricted by the limitations on the ability to create responsive surfaces over large areas with a reproducibility similar to that of the semiconductor industry. Large sensing surfaces can be easily interfaced with standard and cost-effective optics. Precision in the fabrication process would also lessen the chip-to-chip variance, a critical bottleneck in enhancing the reliability of measurements, which is critical in a clinical setting. In the context of a medical device, where serial measurements are required, the reproducibility of surface regeneration is also crucial. It has also been demonstrated that the optimal protocol for regenerating the sensing surface can be established in a commercially available SPR platform and then successfully translated to the nanohole array. The efficiency of regeneration can be easily calculated for the nanohole array, and the suitability of the regenerated surface for repeat measurements can be assessed. Upon establishing robust surface chemistry modification and regeneration protocols, LSPR sensors can be a sensitive yet simple platform for real-time bioanalyte detection. It is easy to foresee its significant impact on patient care. It is to be noted that the absolute sensitivity of the sensor cannot match the most advanced ELISA-based tests. Some amplification strategies need to be designed to increase sensitivity. Even in its current form, this technology represents a significant improvement relative to established nanoimprinted LSPR protocols, as it defines a new lower limit for the label-free detection of a cardiovascular biomarker using a transmission-based optical setup. Technology is evolving towards the implementation of real-time monitoring of multiple clinically important biomarkers. Further improvements in data acquisition (e.g., detectors with better resolution) and subsequent signal processing could help LSPR-based sensors achieve this.
Subscription Required. Please recommend JoVE to your librarian.
Disclosures
The authors have no competing financial interests.
Acknowledgments
AP acknowledges the support of Prof T Venkatesan, Director, NUS Nanoscience and Nanotechnology Initiative and Office of the Deputy President (National University of Singapore) (R-398-000-084-646). CLD acknowledges the support of the Singapore Ministry of Health National Medical Research Council under its clinician scientist funding scheme, NMRC/CSA/035/2012, and the National University of Singapore. The funders had no role in study design, data collection and analysis, decision to publish, or preparation of the manuscript.
Materials
| Name | Company | Catalog Number | Comments |
| Electron Beam Lithography setup | Elionix ELS 700 | ||
| o-Xylene | Sigma Aldrich | 95662 | |
| EB resist | Sumitomo | NEB-22A2 | |
| Developer reagent | Shipley Company | Microposit MF 321 | |
| Electroplating machine | Technotrans AG RD 50 | ||
| Photoresist stripper | Rohm and Haas Electronic Materials LLC | Microposit Remover 1165 | |
| Etching System | Trion Phantom | ||
| Heptadecafluoro-1,1,2,2-tetrahydrodecyl)trichlorosilane | Gelest (PA, USA) | 78560-44-8 | |
| SAM coater | Sorona Inc. | AVC 150M | |
| Photo-curable NIL resist | micro resist technology GmbH | mr-UVCur21-300nm | |
| Light Curing System | Dymax | Model 2000 Flood | |
| E-beam deposition machine | Denton Explorer | ||
| UV-visible spectrometer | Ocean optic HR2000+ (Dunedin, FL, USA) | ||
| Standard refractive index liquids | Cargill Inc (Cedar Grove, USA) | 18032 | |
| Plotting software | Origin | Origin Pro 9 | |
| 10-carboxy-1-decanethiol | Dojindo Laboratories (Japan) | C385-10 | |
| 1-octanethiol | Sigma-Aldrich, MO, USA | 471386 | |
| Sulfo-N-hydroxysuccinimide and 1-ethyl-3-(3-dimethylaminopropyl) carbodiimide | BioRad (CA, USA) | 1762410 | |
| Anti-troponin antibody 560 | Hytest (Finland) | 4T21 | |
| Ethanolamine-HCl solution | BioRad (CA, USA) | 1762450 | |
| Surface Plasmon Resonance setup | BioRad XPR36 (Haifa, Israel) | ||
| Multiplexed SPR chip | BioRad | GLC | |
| Human cTnI standard | Phoenix Pharmaceuticals | EK -311-05 | |
| Glycine-HCl | BioRad (CA, USA) | 1762221 |
References
- Ebbesen, T. W., Lezec, H. J., Ghaemi, H., Thio, T., Wolff, P. Extraordinary optical transmission through sub-wavelength hole arrays. Nature. 391 (6668), 667-669 (1998).
- Krishnan, A., et al. Evanescently coupled resonance in surface plasmon enhanced transmission. Optics Comm. 200 (1), 1-7 (2001).
- Yang, J. -C., et al. Enhanced optical transmission mediated by localized plasmons in anisotropic, three-dimensional nanohole arrays. Nano letters. 10 (8), 3173-3178 (2010).
- Kim, J. H., Moyer, P. J. Transmission characteristics of metallic equilateral triangular nanohole arrays. Appl Phys Lett. 89 (12), 121106 (2006).
- Liu, H., Lalanne, P. Microscopic theory of the extraordinary optical transmission. Nature. 452 (7188), 728-731 (2008).
- Shon, Y. -S., Choi, H. Y., Guerrero, M. S., Kwon, C. Preparation of nanostructured film arrays for transmission localized surface plasmon sensing. Plasmonics. 4 (2), 95-105 (2009).
- Xiang, G., Zhang, N., Zhou, X. Localized surface plasmon resonance biosensing with large area of gold nanoholes fabricated by nanosphere lithography. Nanoscale Res Lett. 5 (5), 818 (2010).
- Valsecchi, C., Brolo, A. G. Periodic metallic nanostructures as plasmonic chemical sensors. Langmuir. 29 (19), 5638-5649 (2013).
- Gates, B. D., et al. New approaches to nanofabrication: molding, printing, and other techniques. Chem Rev. 105 (4), 1171-1196 (2005).
- Guo, L. J. Nanoimprint lithography: methods and material requirements. Adv Mater. 19 (4), 495-513 (2007).
- Wong, T. I., et al. High throughput and high yield nanofabrication of precisely designed gold nanohole arrays for fluorescence enhanced detection of biomarkers. Lab on a Chip. 13 (12), 2405-2413 (2013).
- Deng, J., Wong, T. I., Sun, L. L., Quan, C., Zhou, X. Acceleration of e-beam lithography by minimized resist exposure for large scale nanofabrication. Microelect Eng. 166, 31-38 (2016).
- Wu, L., Bai, P., Li, E. P. Designing surface plasmon resonance of subwavelength hole arrays by studying absorption. JOSA B. 29 (4), 521-528 (2012).
- Ding, T., et al. Quantification of a cardiac biomarker in human serum using extraordinary optical transmission (EOT). PloS one. 10 (3), 0120974 (2015).
- Im, H., Sutherland, J. N., Maynard, J. A., Oh, S. -H. Nanohole-based surface plasmon resonance instruments with improved spectral resolution quantify a broad range of antibody-ligand binding kinetics. Anal Chem. 84 (4), 1941-1947 (2012).
- Bhagawati, M., You, C., Piehler, J. Quantitative real-time imaging of protein-protein interactions by LSPR detection with micropatterned gold nanoparticles. Anal Chem. 85 (20), 9564-9571 (2013).
