Several protocols have been developed and described for the isolation of different cardiac cell types from a rat heart. Here, an optimized protocol is described that allows the isolation of high-quality major cardiac cell types (cardiomyocytes, endothelial cells, and fibroblasts) from a single preparation, reducing the experimental costs.
Method Article
Simultaneous Isolation of High Quality Cardiomyocytes, Endothelial Cells, and Fibroblasts from an Adult Rat Heart
Opens in a new tab
In This Article
Summary
Loading...
$$\rightleftharpoonup{xx}$$
$$\longleftharp{xx}$$,
$$\longrightharp{xx}$$,
Abstract
Loading...
$$\rightleftharpoonup{xx}$$
$$\longleftharp{xx}$$,
$$\longrightharp{xx}$$,
The rat is an important animal model used in cardiovascular research, and rat cardiac cells are used routinely for in vitro analysis of the molecular mechanisms of cardiovascular disease progression such as cardiac hypertrophy, fibrosis, and atherosclerosis. Although several attempts with variable success have been made to develop immortalized cell lines from the cardiovascular system to understand these cellular mechanisms, primary cells offer a more natural and close to in vivo environment for such studies. Therefore, different laboratories working on a particular cell type have developed protocols to isolate individual types of rat cardiac cells of interest. A protocol that allows the isolation of more than one cell type, however, is missing. Here an optimized protocol is described that allows the isolation of high-quality major cardiac cell types (cardiomyocytes, endothelial cells, and fibroblasts) from a single preparation and enables their use for cellular analyses. This permits the most efficient use of available resources, which may save time and reduce research costs.
Introduction
Loading...
$$\rightleftharpoonup{xx}$$
$$\longleftharp{xx}$$,
$$\longrightharp{xx}$$,
Rodent models have long been used as tools to broaden our understanding of cardiovascular physiology in health and disease.1 Although these animal models allow us to understand the pathophysiology of a disease at the organ level and to analyze the pharmacokinetics and pharmacodynamics of various pharmacological agents used to treat cardiovascular diseases, understanding of the molecular mechanisms of cardiovascular disease development and the contribution of a particular cell type requires the use of in vitro cell culture models. For this purpose different immortalized cell lines from the cardiovascular system have been developed;2,3 however, freshly isolated primary cells are physiologically and functionally more relevant to living tissues and organisms.
The heart is a versatile organ containing all major types of cells of the cardiovascular system, and the rat heart is still a commonly used model for the understanding of cardiovascular physiology. During the last few decades, different methods for the isolation of individual cell types from cardiac tissue have been described;4,5,6,7 however, these methods focus only on the isolation of one specific cell type resulting in the loss of other types of cells that can no longer be used for cellular analysis. Here, an optimized protocol is described that enables the simultaneous and high quality isolation of the major cell types of cardiac tissue, i.e. cardiomyocytes, endothelial cells, and fibroblasts. All of these cell types can be used in different experimental setups8,9,10 and for the analysis of cell-cell interactions from the same animal.
Protocol
Loading...
$$\rightleftharpoonup{xx}$$
$$\longleftharp{xx}$$,
$$\longrightharp{xx}$$,
The investigation conforms to the Guide for the Care and Use of Laboratory Animals published by the US National Institutes of Health (NIH Publication No. 85-23 1985) and was approved by the local ethics committee of the University of Giessen. Adult male Wistar rats weighing 200 - 250 g were used in this study.
1. Autoclaving
- At least one day before the procedure is to be carried out, autoclave all surgical instruments, pipette tips, and Pasteur pipettes to be used in the isolation procedure at 121 °C for 30 min.
2. Preparation of Media and Solutions
NOTE: Solutions from steps 2.1-2.4 can be prepared up to a week before the isolation and stored at 4 °C, but prepare the solutions in steps 2.5-2.8 on the day of isolation. The complete recipes of the buffers and media are given in Table 1. Warm all the media and solutions to 37 °C in a water bath before starting the preparation.
- Prepare Powell medium by dissolving the chemicals listed in Table 1 in 4.5 L of H2O at room temperature (RT). Adjust the pH to 7.4 with 2.0 N NaOH, and bring the volume to 5.0 L. Sterile filter the solution, and store it at 4 °C.
- Prepare creatine, L-carnitine, and taurine (CCT) medium by dissolving M199 powder medium in 4.5 L of H2O. Add HEPES powder according to Table to the medium and mix for 15 min. Add creatine, carnitine, taurine, and Ara-C according to Table 1. Mix well, adjust the pH with pH meter to 7.4 with 2.0 N NaOH, and bring the volume to 5.0 L. Sterile filter and store at 4 °C.
- Prepare cell culture medium for fibroblasts by adding 10% fetal calf serum (FCS) and 2% penicillin/streptomycin (Pen/Strep) to medium M199. DMEM is equally suitable as M199 and can also be used for fibroblast cell culture.
- Prepare MV2 cell culture medium for endothelial cells by adding all the contents of the supplement mix to the basal MV2 medium according to manufacturer's instructions. Take a 5 mL aliquot and warm it to 37 °C in a water bath.
- Prepare endothelial cell isolation buffer by dissolving 0.05 g of bovine serum albumin (BSA) in 50 mL of Hanks balanced salt solution (HBSS) and adding 0.5 mL of 200 mM ethylenediaminetetraacetic acid (EDTA) solution to it. Sterile filter this and store it at 4 °C.
- Prepare endothelial cell wash buffer by adding 0.1 mL of 200 mM to 9.9 mL of PBS and store it at 4 °C.
- Prepare collagenase solution by dissolving 27 mg of collagenase in 5 mL of Powell medium and adding 12.5 µL of 100 mM CaCl2 solution to it. Warm it to 37 °C in a water bath.
- Prepare incremental Ca2+ restoration solutions 1, 2, and 3 for cardiomyocytes by adding 12.5 µL, 25 µL, and 120 µL of 100 mM CaCl2 solution to 6 mL, 6 mL, and 12 mL of Powell medium, respectively.
- Pre-coat the cell culture dishes for cardiomyocytes one day before the isolation by adding 1 mL of pre-coating medium containing laminin to each 35-mm cell culture dish. Incubate them in the cell culture incubator at 37 °C overnight.
3. Preparation of Magnetic Beads
- Place 0.5 mL of the endothelial cell isolation buffer in a 1.5 mL sample tube on ice.
- Add 5 µL (2 x 10⁶) of pan mouse IgG magnetic beads and mix well.
- Place the tube in the magnetic rack for 1 min. The beads will adhere to the wall of the tube towards the magnet. Carefully remove the supernatant with a 1 mL pipette.
- Repeat the washing twice more and finally re-suspend the beads in 50 µL endothelial cell isolation buffer and store at 4 °C until use.
4. Preparation of Langendorff Perfusion System
- Clean the Langendorff system by perfusion with 2 L of distilled water.
- Circulate 50 mL of Powell medium through the system for 5 min and discard the medium.
- Add 80 mL fresh Powell medium. Continuously perfuse it with "carbogen" by bubbling with a glass Pasteur pipette from the gas cylinder. Let medium recirculate through the system. The system is now ready to perfuse the heart (Figure 1A).
5. Dissection of the Rat
- Place the rat in a 5 L desiccator under a fume hood and add 1.5 mL of 4-5% isoflurane through the air vent, and close the lid.
NOTE: Place the animal on elevated perforated plate inside the desiccator to avoid direct contact of the animal with the liquid isoflurane. - Wait until the rat loses its lid reflex (usually ~5 min), and then take the rat out of the desiccator. Euthanize the rat by cervical dislocation.
- Cut the abdominal skin and the underlying muscle horizontally in the middle using a pair of sharp scissors. Thereafter, cut the muscle vertically to the sternum of the rat and open the thorax. Remove the heart along with the lungs and immediately place the organs in ice-cold 0.9% NaCl solution.
- Remove the lungs with the help of a pair of scissors and discard them. Clean the heart of any connective tissue, and cut the aorta caudally at the branch of the brachiocephalic trunk.
6. Perfusion of the Heart and Digestion with Collagenase
- Mount the heart via the aorta in the Langendorff perfusion system (Section 4) using two pairs of thin, curved forceps. In order to ensure that the myocardium is perfused in a retrograde manner, place the end of the cannula of the perfusion system between the first aortic branch and the aortic valve. Fix the aorta using a crocodile clamp.
- Fix the heart with a surgical suture, and remove the crocodile clamp (Figure 1B).
- Open the valve of the cannula to allow the perfusion medium (35 mL) to pass through the heart drop-wise (60 drops/min; 5 mL/min) to wash out any residual blood. Discard any flow-through at this stage.
NOTE: Avoid the formation of air bubbles at any stage of the perfusion as this will result in incomplete digestion and failure of the cell isolation procedure. - Place the hanging heart in the collecting funnel (heart chamber; Figure 1B) and start the peristaltic pump, which will recirculate the perfusion medium from the collecting funnel to the reservoir (Figure 1A).
- Add the collagenase solution (from step 2.8) to the perfusion medium. Perfuse the heart with recirculating collagenase solution for 30 min.
NOTE: This step is very critical for optimizing cell yield. The perfusion time depends on the activity of collagenase, which may vary depending upon the batch. Test 3-4 batches of collagenase to find the one with optimal activity; then large amounts of the best-suited batch can be purchased that are sufficient for at least one year for reproducible results. - At the end of the digestion time, stop the perfusion, remove the heart from the Langendorff system using a pair of scissors, and place it in a glass Petri dish.
- Cut off and discard both atria, and remove any leftover fatty tissues. Carefully peel off the pericardium with the help of two pairs of forceps to avoid contamination of the epithelial cells.
NOTE: The pericardium can be further digested with collagenase to obtain pure cardiac epithelial cells if required. A detailed protocol is not given in the present study as this is beyond the scope of the present protocol. - Cut the heart down the middle with a pair of scissors and put it into the tissue chopper. Mince the heart 2-3 times and re-suspend the minced tissue in 12 mL of the digestion buffer from the Langendorff perfusion.
NOTE: Do not chop the heart excessively, as this will result in a higher proportion of dead cardiomyocytes. - Transfer the minced tissue into 15 mL of collagenase-containing dissociation medium and let it digest in a water bath for a 5-10 min with occasional mixing by re-suspension using a 5 mL disposable plastic pipette.
- At the end of the digestion period, filter the cell suspension through a 100 µm sieve. Discard the tissue debris and undigested material.
- At the end of the Langendorff perfusion, flush the perfusion system immediately with a minimum of 1 L of distilled water. Perfuse the system by recirculating 100 mL of 0.1 N NaOH for 30 min, and finally flush the system with 2-3 L of distilled water. Dry the system by flushing air and cover the opening with para-film.
7. Rat Cardiac Cell Isolation
- Isolation and culture of cardiomyocytes
- Centrifuge the cell suspension at 25 x g for 1 min (without brakes) to pellet the cardiomyocytes. Cardiomyocytes may also be allowed to settle for 10 min at RT without centrifugation.
- Carefully remove the supernatant containing endothelial cells and fibroblasts with the help of a disposable plastic pipette in a new 50 mL tube.
- Resuspend the cardiomyocyte pellet in Ca2+ 6 mL solution 1 (Step 2.9). Allow 1 min for the cells to adjust to the low Ca2+ concentration environment, and centrifuge the cell suspension again at 25 x g for 1 min (without brakes).
- Discard the supernatant and resuspend the cell pellet in 6 mL Ca2+ solution 2 (Step 2.9). Allow the cells 1 min to adjust to the intermediate concentration of Ca2+, and finally add 12 mL of Ca2+ solution 3 (Step 2.9) to the cells. Mix with the help of a disposable plastic pipette.
- Centrifuge the cell suspension at 25 x g for 1 min.
- Discard the supernatant and resuspend the cells in 20 mL pre-warmed CCT medium. Add 1 mL of the cell suspension to each of 20 sterile 35 mm cell culture dish pre-coated with laminin (Step 2.9) and allow the cells to attach for 2 h in a CO2-free cell culture incubator.
NOTE: The cardiomyocytes can also be cultured under CO2 environment; however, in this case media with bicarbonate buffer system should be used. - After 2 h, replace the medium with new 2 mL of CCT medium to remove any dead cells.
NOTE: The cells are ready for any planned experiments and can be cultured for up to 3 days in a typical cell culture incubator (CO2 free) without significant loss of living cells. Typical healthy rod-shaped cardiomyocytes are shown in Figure 2A.
- Isolation of endothelial cells and fibroblasts
- Centrifuge the supernatant containing endothelial cells and fibroblasts (from step 7.1.2) at 250 x g for 10 min.
- Discard the supernatant and resuspend the cell pellet in 1.5 mL of endothelial cell isolation buffer in a 2 mL sample tube.
- Add 3 µg (1:500) of mouse anti-rat CD31 antibody to the cell suspension and incubate it at 4 °C for 30 min with end-to-end rotation.
NOTE: A titration of the antibody for optimal dilution is advised. This step should be performed at 4 °C as at RT a rapid internalization of antibody by endothelial cells will result in low yield. - Add the previously prepared (Section 3) pan anti-mouse IgG beads to the cell suspension and incubate for 20 min at 4 °C with end-to-end rotation.
NOTE: Alternatively, mouse anti-rat CD31 antibody can be pre-attached to the magnetic beads and then added to the cell suspension. However, this will increase the time of incubation of the beads with the cell suspension and may result in increased non-specific binding of non-endothelial cells and hence higher contamination of other cell types. - At the end of the antibody incubation time, place the tube containing the cell suspension in a magnetic rack and allow 2 min to settle the magnetic beads attached to endothelial cells to the side of the tube.
- Carefully remove the rest of the cell suspension (containing mainly the fibroblasts) using a 1 mL pipette and add it to a 10 cm cell culture dish containing 10 mL of fibroblast cell culture medium (Step 2.3). Place it in a typical cell culture incubator containing 5% CO2. The procedure continues in Step 7.3.
- Add 1 mL of wash buffer to the tube with magnetic beads containing the endothelial cells.
- Cap the tube, remove it from the magnetic rack, and carefully resuspend the beads by shaking gently up and down 4 - 5 times. Place the tube again in the magnetic rack, allow the beads to settle on the wall of the tube for 1 min, and carefully remove the wash buffer.
- Repeat the washing steps 5 - 7 times to get rid of any contaminating non-endothelial cells.
- Resuspend the endothelial cells attached to the beads in 1 mL of MV2 endothelial cell culture medium, add to a single well of a 12-well plate, and incubate in a CO2 cell culture incubator.
- Allow the cells to attach overnight and change the medium the next day and then every 2-3 days until the cells become semi-confluent (usually 5 - 7 days).
NOTE: Typical non-confluent endothelial cells after 3 - 4 days and confluent endothelial cells after 7-10 days of isolation are shown in Figures 3A and 3B, respectively. The cells can then be trypsinized (section 7.4) and seeded into a T25 cell culture flask.
- Washing and culture of fibroblasts (continue from step 7.2.6)
- After 1 h of incubation, aspirate the medium and wash the fibroblasts attached to cell culture dish by adding an appropriate volume of pre-warmed PBS. Aspirate the PBS and repeat the step 2-3 times and finally add pre-warmed fresh fibroblast cell culture medium.
- Wash the attached cells again the next day with pre-warmed PBS (as in the previous step) and add pre-warmed fresh medium. Change the medium after every 2-3 days. A typical phenotype of fibroblasts on day 2 of isolation is shown in Figure 4A.
NOTE: The fibroblasts become semi-confluent usually within 5-7 days and are then ready to be trypsinized (section 7.4) and used for planned experiments. With this procedure, we usually obtain 95-99% pure fibroblasts. A typical phenotype of fibroblasts on day 7 of isolation is shown in Figure 4B.
- Trypsinization of endothelial cells and fibroblasts
- Aspirate the medium from the cell culture dish and add enough pre-warmed PBS to cover the cells.
- Aspirate PBS and add enough trypsin-EDTA solution (0.05% and 0.02%, respectively) to cover the cells and place in the 37 °C incubator for 5 min.
- Resuspend the cells by pipetting the cells up and down with the help of a 1 mL pipette and stop trypsin action by adding 10% FCS.
- Pellet the cell suspension by centrifugation at 250 x g for 10 min at RT.
- Resuspend the cells in an appropriate volume of pre-warmed cell culture medium.
8. Endothelial Cell Characterization
NOTE: The purity of endothelial cells is determined by Dil-Ac-LDL uptake and immunostaining of von Willebrand factor (vWF). Cells are visualized by fluorescence or confocal microscopy (Figures 3C-3E).
- Dil-Ac-LDL uptake by endothelial cells
- Trypsinize the endothelial cells (step 7.4) and culture them overnight on glass coverslips in a 12-well plate (approximately 10 x 104 cells/cm2).
- Aspirate the medium and rinse the cells with 1 mL of pre-warmed HBSS.
- Aspirate the HBSS and add 1 mL endothelial cell culture medium containing 10 µg/mL Dil-Ac-LDL and leave the cells in the 37 °C incubator for 4 h.
- Aspirate the medium and rinse the cells with pre-warmed PBS three times and fix them with 1 mL of 4% paraformaldehyde (PFA; dissolved in PBS). Incubate them with PFA at 37 °C for 20 min.
NOTE: PFA is corrosive; always use acid-resistant gloves while handling PFA solution. - Aspirate the PFA, rinse the cells on coverslip in 12-well plate with 1 mL PBS thrice and incubate them with nuclear staining solution TO-PRO (10 µM) for 1 h at RT.
NOTE: If the appropriate filter is available for the microscope, 4',6-diamidino-2-phenylindole (DAPI; 1 µg/mL) may also be used. In this case incubation time should be reduced to 10 min. - Rinse cells on coverslip in 12-well plate with 1 mL PBS, aspirate the PBS, and repeat the step three times.
- Take the coverslip out of 12-well plate and mount it on a glass slide with a drop of mounting medium. The cells are ready to be visualized under a fluorescent/confocal microscope. Use an excitation filter of 530-560 nm for Dil-Ac-LDL, 640 nm for TO-PRO, and 340-380 nm for DAPI.
- Von Willebrand (vWF) staining
- Culture the endothelial cells as described in step 8.1.1.
- Aspirate the medium and rinse the cells with 1 mL of pre-warmed HBSS; thereafter, fix with 4% PFA as describe in step 8.1.4.
- Aspirate the PFA, rinse the cells on coverslip in 12-well plate with 1 mL of PBS twice, and permeabilize the cells with 1 mL of 0.1% Triton X-100 (in PBS) for 20 min at RT.
- Aspirate the permeabilizing solution and incubate the cells with blocking solution (5% BSA/5% FCS in PBS) for 1 h.
- Incubate the cells with rabbit anti-vWF antibody (1:100) at 4 °C overnight in a humidified chamber. Add one coverslip without the primary antibody as a negative control.
- Rinse the cells on the coverslip in 12-well plate with 1 mL PBS three times and incubate the cells with donkey anti-rabbit Alexa Fluor-488 antibody (1:500) and nuclear staining solution TO-PRO (10 µM) for 1 h at RT.
- Rinse the cells on the coverslip in 12-well plate with 1 mL PBS, aspirate the PBS, and repeat the step three times.
- Take the coverslip out of the 12-well plate and mount it on a glass slide with a drop of mounting medium. The cells are ready to be visualized under a fluorescent/confocal microscope. Use an excitation filter of 490 nm for vWF and 640 nm for nuclear staining.
Results
Loading...
$$\rightleftharpoonup{xx}$$
$$\longleftharp{xx}$$,
$$\longrightharp{xx}$$,
The isolation procedure results in a yield of 70 - 80% viable, rod-shaped, striated cardiomyocytes (Figures 2A and 2C) that can be used for planned experiments. In our laboratory cardiomyocytes are routinely used for analysis of Ca2+ signaling. Figure 5A shows intracellular calcium [Ca2+]i oscillations in response to ischemia/reperfusion in cardiomyocytes loaded with Fura-AM (5 µM). Figure 5B shows changes in [Ca2+]i in endothelial cells and fibroblasts after addition of ATP (100 µM). The changes in [Ca2+]i in different cardiac cell types were analyzed as described previously. 6,11,12
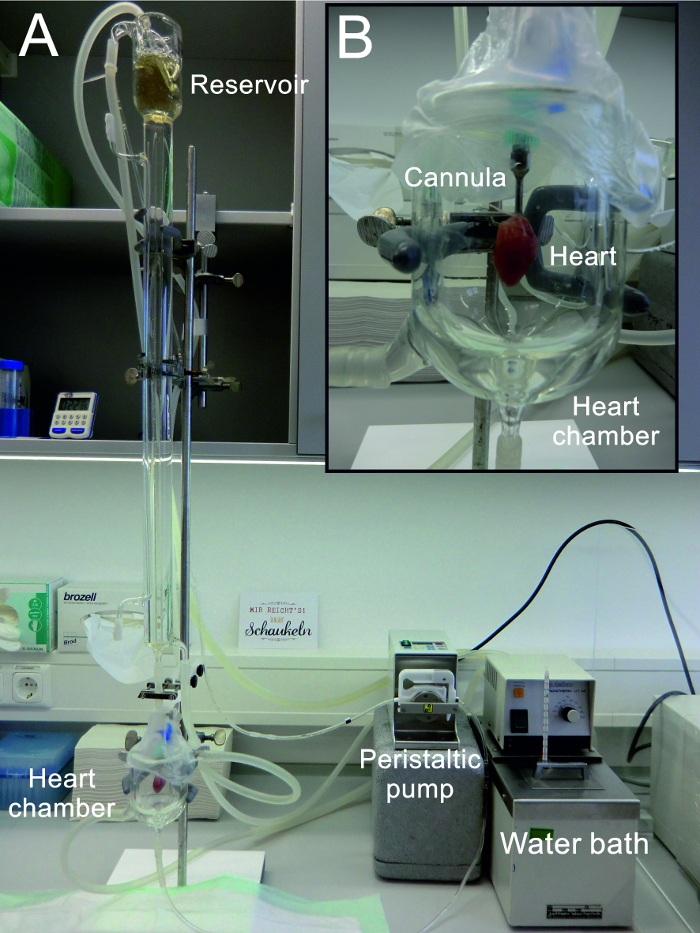
Figure 1: Modified Langendorff Perfusion System. (A) The entire Langendorff perfusion system used for the isolation of cardiac cells (B) Enlarged view of the hanging heart in the "heart chamber" also used for the collection of perfusion buffer for recirculation. Please click here to view a larger version of this figure.

Figure 2: Adult Rat Cardiomyocytes. (A) Typical rod-shaped, healthy cardiomyocytes 2 h after plating in laminin-coated cell culture dishes (B) A typical example of a poor preparation due to incomplete tissue digestion. 2 h after plating in laminin-coated cell culture dishes, most of the cells are hypercontracted and look rounded, and there are few rod-shaped cardiomyocytes. Scale bar = 10 µm (C) Confocal micrograph of single cardiomyocyte stained for actin visualization as described previously.13 Scale bar = 50 µm. Please click here to view a larger version of this figure.

Figure 3: Rat Cardiac Endothelial Cells. (A) Phase-contrast micrograph of non-confluent endothelial cell monolayer 3 days after isolation. Dark spots are the magnetic beads that are still attached to the parent endothelial cells. Scale bar = 10 µm (B) Phase-contrast micrograph of confluent endothelial cell monolayer 7 days after isolation (C) Immunostaining of endothelial cells showing Dil-Ac-LDL uptake (Red) and nuclear staining (Blue) (D) Immunostaining of endothelial cells showing staining of vWF (Red) and nuclear staining (Blue) (E) Cells incubated only with secondary antibody and nuclear stain (Blue) (Scale bar = 50 µm) Please click here to view a larger version of this figure.

Figure 4: Rat Cardiac Fibroblasts. (A) Typical spindle-shaped cardiac fibroblasts on the second day of isolation. (B) Confluent, pure fibroblasts after 7 days of culture. (C) A typical example of a poor preparation contaminated with epithelial cells. Cells indicated by arrowheads are the cardiac epithelial cells. Scale bar = 10 µm. Please click here to view a larger version of this figure.

Figure 5: Changes in [Ca2+]i in Cardiac Cells. (A) Representative tracings of changes in intracellular calcium [Ca2+]i measured by Fura-2 ratio in rat cardiomyocytes exposed to chemical ischemia (Na-cyanate; 2 mM) followed by reperfusion (B) Representative tracings of changes in intracellular calcium [Ca2+]i measured by Fura-2 ratio in rat cardiac endothelial cells and fibroblasts, treated with ATP (100 µM) as indicated. Please click here to view a larger version of this figure.
| Powell Medium (5 L); pH 7.4 | ||||
| Material | Conc (mM) | Mol Wt | Amount (g) | Remarks |
| NaCl | 110 | 58.44 | 32.14 | |
| KCl | 2.5 | 74.56 | 0.97 | |
| KH2PO4 | 1.2 | 136.09 | 0.82 | |
| MgSO4·7H2O | 1.2 | 246.48 | 1.48 | |
| HEPES | 25 | 238.3 | 29.79 | |
| Glucose (mono hydrate) | 10 | 198.17 | 9.91 | |
| CCT Medium (5 L); pH 7.4 | ||||
| Material | Conc (mM) | Mol Wt | Amount (g) | Remarks |
| M199 Medium (powder) | 1 bottle | |||
| HEPES | 15 | 238.3 | 18 | |
| Creatin | 5 | 113.12 | 3.28 | |
| Carnitin | 2 | 161.02 | 1.98 | |
| Taurine | 5 | 125.14 | 3.13 | |
| Cytosine-Arabinofuranosid (Ara C) | 0.01 | 242.22 | 12.16 | |
| Coating medium (for cardiomyocytes) | ||||
| Material | Stock | End Conc | Volume (mL) | Remarks |
| CCT-Medium | 49 | |||
| Laminin | 0.5 µg/µL | 0.5 µg/µL | 0.5 µL | |
| Pen/Strep | 100% | 2% | 1 | |
| Plating/Wash medium (for cardiomyocytes) | ||||
| Material | Stock | End Conc | Volume (mL) | Remarks |
| CCT-Medium | 49 | |||
| Pen/Strep | 100% | 2% | 1 | |
| Culture medium (for fibroblasts) | ||||
| Material | Stock | End Conc | Volume (mL) | Remarks |
| CCT-Medium | 88 | |||
| Pen/Strep | 100% | 2% | 2 | |
| FCS | 10% | 10 | ||
| Medium for fibroblast and endothelial cell isolation | ||||
| Material | Stock | End Conc | Volume (mL) | Remarks |
| CCT-Medium | 9.8 | |||
| Pen/Strep | 100% | 2% | 0.2 | |
| Endothelial cell wash buffer | ||||
| Material | Stock | End Conc | Volume (mL) | Remarks |
| Sterile PBS (1x) | 9.9 | |||
| EDTA (pH 8.0) | 200 mM | 2 mM | 0.1 | |
| Calcium chloride (100 mM) stock solution | ||||
| Material | Conc (mM) | Mol Wt | Amount (g) | Remarks |
| CaCl2·2H2O | 100 | 147.01 | 1.47 | |
| H2O (to 100 mL) | ||||
| Collagenase stock solution (1500 IU/mL) | ||||
| Material | Conc (mM) | Mol Wt | Amount | Remarks |
| Collagenase type II | 265 IU/mg | 147.01 | 28 mg | End conc of 150 IU/mL |
| Powell medium | 5 mL | |||
| Calcium chloride | 100 mM | 12.5 µL | End conc of 25 µM | |
Table 1.
Discussion
Loading...
$$\rightleftharpoonup{xx}$$
$$\longleftharp{xx}$$,
$$\longrightharp{xx}$$,
In this article, a reproducible protocol for the isolation and culture of cardiac myocytes, endothelial cells, and fibroblasts is described. This protocol describes the simultaneous and high quality isolation of the major cell types of cardiac tissue, i.e. cardiomyocytes, endothelial cells, and fibroblasts as opposed to just one cell type. A critical step in the isolation procedure is the proper digestion of the cardiac tissue. If the digestion is incomplete, a large number of myocytes may still be obtained but their quality is very poor and they are mostly hypercontracted and round (Figure 2B) and of no value in experiments. Moreover, the yield of endothelial cells and fibroblast will also be reduced. This problem can be resolved by controlling the digestion time. Before removing the heart from the perfusion system, the softness of the heart can be checked with the help of forceps and fingertips. If the tissue is still not noticeably soft, the heart may be perfused for an additional 5-10 min. A second critical step in healthy cardiomyocyte isolation is the incremental restoration of Ca2+ in the isolation buffers. A rapid restoration of high concentrations of Ca2+ in the media will result in rounded cardiomyocytes. The quality of water used for preparation of buffers is another important factor affecting the quality of cardiomyocytes. Therefore, usage of good quality water is recommended.
The purity of endothelial cells is highly dependent on the washing steps. EDTA must be present in the washing buffer to prevent of non-specific binding of non-endothelial cells to the magnetic beads. The presence of blood cells in the cell suspension will greatly reduce the yield of endothelial cells; therefore, proper washing of the heart is very critical after mounting the heart in the perfusion system and before addition of collagenase. Residual blood components will also reduce the activity of collagenase and hence hinder digestion of the heart.
The most common contamination in the fibroblast cell culture is the appearance of satellite colonies of epithelial cells (Figure 4C). This contamination may be avoided by two-step culturing of fibroblasts. In the first step, the concentration of FCS in the fibroblast cell culture medium is reduced to 5% and the cell suspension is allowed to adhere to the cell culture dish for 30 min in the incubator. Epithelial cells adhere rapidly but fibroblast cell adhesion time is increased in the presence of a low concentration of serum. After 30 min of incubation, the cell suspension containing non-adherent fibroblasts is carefully removed to a new cell culture dish. In this way the yield of fibroblasts may be reduced but their purity is greatly enhanced.
Disclosures
Loading...
$$\rightleftharpoonup{xx}$$
$$\longleftharp{xx}$$,
$$\longrightharp{xx}$$,
Authors have nothing to declare.
Acknowledgements
Loading...
$$\rightleftharpoonup{xx}$$
$$\longleftharp{xx}$$,
$$\longrightharp{xx}$$,
The technical support of L. Rinaldi, S. Schäffer, D. Reitz, H. Thomas and A. Weber is gratefully acknowledged. The authors also wish to thank Dr. E. Martinson for extensive proof reading and language editing of the manuscript. The study was supported by University of Giessen Anschubsfinanzierung grant to M. Aslam and D. Gündüz.
Materials
| Name | Company | Catalog Number | Comments |
|---|---|---|---|
| anti-vWF | Santa Cruz Biotech. | SC-14014 | |
| Calcium chloride | Merck | 102378 | |
| Carnitin | Sigma-Aldrich | C0283 | |
| Collagenase type II | Worthington | LS004176 | |
| Creatin | Sigma-Aldrich | C0780 | |
| D-Glucose | Merck | 108342 | |
| Dil-Ac-LDL | Thermo Scientific | L3484 | |
| EDTA Solution (0.2 M) | Biochrome AG | L2113 | |
| Embeding solution | Citiflour | AF1-25 | |
| Endothelial cell medium MV2 | PromoCell | C-22022 | |
| Foetal calf serum (FCS) | Biochrome AG | S0615 | |
| Gentamicin | Serva Chemicals | 47991 | |
| HEPES | Sigma-Aldrich | H0887 | |
| Isoflurane | Abbott | TU 061219 | |
| Laminin | Roche/Sigma | 11243217001 | |
| M199 medium | Thermo Scientific | 11150059 | |
| M199 medium (Powder) | Biochrome AG | T061 | |
| Magnesium sulphate | Sigma-Aldrich | 63138 | |
| Mouse anti-rat CD31 antibody (TLD-3A12) | Thermo Scientific | MA1-81051 | |
| NaCl solution (0.9%), Sterile | B. Braun | 30820080 | |
| Pan mouse IgG beads (Dynabeads) | Thermo Scientific | 11041 | |
| Paraformaldehyde (PFA) 4% Solution | Santa Cruz Biotech. | sc-281692 | |
| Penicillin-Streptomycin | Thermo Scientific | 15070-063 | |
| Phosphate buffer saline (PBS) 1x | PAN-Biotech | P04-36500 | |
| Plastic consumables | Greiner Bio-One | ||
| Potassium Chloride | Merck | 4933 | |
| Potassium dihydrogen phosphate | Merck | 7873 | |
| Sodium Chloride | Merck | 6404 | |
| Sodium Hydroxide Solution (2 N) | Merck | 109136 | |
| Sterile filtration system | Thermo Scientific | 5660020 | |
| Taurine | Sigma-Aldrich | T8691 | |
| TO-PRO | Thermo Scientific | T3605 | |
| Trypsin-EDTA Solution (10x) | Sigma-Aldrich | T4174 | |
| Water, Sterile | B. Braun |
References
Loading...
$$\rightleftharpoonup{xx}$$
$$\longleftharp{xx}$$,
$$\longrightharp{xx}$$,
- Animal models of cardiovascular diseases. J Biomed Biotechnol. 2011, 497841(2011).">Zaragoza, C., et al. Animal models of cardiovascular diseases. J Biomed Biotechnol. 2011, 497841(2011).
- HL-1 cells: a cardiac muscle cell line that contracts and retains phenotypic characteristics of the adult cardiomyocyte. Proc Natl Acad Sci U S A. 95 (6), 2979-2984 (1998).">Claycomb, W. C., et al. HL-1 cells: a cardiac muscle cell line that contracts and retains phenotypic characteristics of the adult cardiomyocyte. Proc Natl Acad Sci U S A. 95 (6), 2979-2984 (1998).
- Tobacco smoke cooperates with interleukin-1beta to alter beta-catenin trafficking in vascular endothelium resulting in increased permeability and induction of cyclooxygenase-2 expression in vitro and in vivo. FASEB J. 21 (8), 1831-1843 (2007).">Barbieri, S. S., Weksler, B. B. Tobacco smoke cooperates with interleukin-1beta to alter beta-catenin trafficking in vascular endothelium resulting in increased permeability and induction of cyclooxygenase-2 expression in vitro and in vivo. FASEB J. 21 (8), 1831-1843 (2007).
- Culturing of calcium stable adult cardiac myocytes. J Mol Cell Cardiol. 14 (7), 397-412 (1982).">Piper, H. M., Probst, I., Schwartz, P., Hutter, F. J., Spieckermann, P. G. Culturing of calcium stable adult cardiac myocytes. J Mol Cell Cardiol. 14 (7), 397-412 (1982).
- Primary culture of adult rat heart myocytes. J Vis Exp. (28), (2009).">Xu, X., Colecraft, H. M. Primary culture of adult rat heart myocytes. J Vis Exp. (28), (2009).
- Accumulation of extracellular ATP protects against acute reperfusion injury in rat heart endothelial cells. Cardiovasc.Res. 71 (4), 764-773 (2006).">Gündüz, D., et al. Accumulation of extracellular ATP protects against acute reperfusion injury in rat heart endothelial cells. Cardiovasc.Res. 71 (4), 764-773 (2006).
- Collagen metabolism in cultured adult rat cardiac fibroblasts: response to angiotensin II and aldosterone. J Mol Cell Cardiol. 26 (7), 809-820 (1994).">Brilla, C. G., Zhou, G., Matsubara, L., Weber, K. T. Collagen metabolism in cultured adult rat cardiac fibroblasts: response to angiotensin II and aldosterone. J Mol Cell Cardiol. 26 (7), 809-820 (1994).
- Mechanisms involved in postconditioning protection of cardiomyocytes against acute reperfusion injury. J Mol Cell Cardiol. 58, 209-216 (2013).">Shahzad, T., et al. Mechanisms involved in postconditioning protection of cardiomyocytes against acute reperfusion injury. J Mol Cell Cardiol. 58, 209-216 (2013).
- Insulin Stabilizes Microvascular Endothelial Barrier Function via Phosphatidylinositol 3-Kinase/Akt-Mediated Rac1 Activation. Arterioscler.Thromb.Vasc.Biol. 30, 1237-1245 (2010).">Gündüz, D., et al. Insulin Stabilizes Microvascular Endothelial Barrier Function via Phosphatidylinositol 3-Kinase/Akt-Mediated Rac1 Activation. Arterioscler.Thromb.Vasc.Biol. 30, 1237-1245 (2010).
- N-terminal fragment of cardiac myosin binding protein-C triggers pro-inflammatory responses in vitro. J Mol Cell Cardiol. 99, 47-56 (2016).">Lipps, C., et al. N-terminal fragment of cardiac myosin binding protein-C triggers pro-inflammatory responses in vitro. J Mol Cell Cardiol. 99, 47-56 (2016).
- Interplay between Ca2+ cycling and mitochondrial permeability transition pores promotes reperfusion-induced injury of cardiac myocytes. J Cell Mol Med. 15 (11), 2478-2485 (2011).">Abdallah, Y., et al. Interplay between Ca2+ cycling and mitochondrial permeability transition pores promotes reperfusion-induced injury of cardiac myocytes. J Cell Mol Med. 15 (11), 2478-2485 (2011).
- Effect of ticagrelor on endothelial calcium signalling and barrier function. Thromb Haemost. , (2016).">Gündüz, D., et al. Effect of ticagrelor on endothelial calcium signalling and barrier function. Thromb Haemost. , (2016).
- Opposing effects of ATP and adenosine on barrier function of rat coronary microvasculature. J Mol.Cell Cardiol. , (2012).">Gündüz, D., et al. Opposing effects of ATP and adenosine on barrier function of rat coronary microvasculature. J Mol.Cell Cardiol. , (2012).
Reprints and Permissions
Request permission to reuse the text or figures of this JoVE article
Request Permission