The loss of honey bee colonies presents a challenge to crop pollination services. Current pollinator protection practices warrant an alternative approach to minimize the contact of honey bees to harmful pesticides using repellent chemistries. Here, we provide detailed methods for a visual tracking protocol to screen deterrents for bees.
A subscription to JoVE is required to view this content. Sign in or start your free trial.
Method Article
Video Tracking Protocol to Screen Deterrent Chemistries for Honey Bees
In This Article
Summary
Abstract
The European honey bee, Apis mellifera L., is an economically and agriculturally important pollinator that generates billions of dollars annually. Honey bee colony numbers have been declining in the United States and many European countries since 1947. A number of factors play a role in this decline, including the unintentional exposure of honey bees to pesticides. The development of new methods and regulations are warranted to reduce pesticide exposures to these pollinators. One approach is the use of repellent chemistries that deter honey bees from a recently pesticide-treated crop. Here, we describe a protocol to discern the deterrence of honey bees exposed to select repellent chemistries. Honey bee foragers are collected and starved overnight in an incubator 15 h prior to testing. Individual honey bees are placed into Petri dishes that have either a sugar-agarose cube (control treatment) or sugar-agarose-compound cube (repellent treatment) placed into the middle of the dish. The Petri dish serves as the arena that is placed under a camera in a light box to record the honey bee locomotor activities using video tracking software. A total of 8 control and 8 repellent treatments were analyzed for a 10 min period with each treatment was duplicated with new honey bees. Here, we demonstrate that honey bees are deterred from the sugar-agarose cubes with a compound treatment whereas honey bees are attracted to the sugar-agarose cubes without an added compound.
Introduction
The European honey bee, Apis melliferaL., is an economic and agriculturally important insect that provides pollination services that are valued at more than $200 billion globally1. In the United States and Europe, honey bee colony numbers have been declining. The United States has lost ca. 60% of managed honey bee colonies from 1947-2008 whereas Europe has lost ca. 27% from 1961-20072,3. There are a number of factors that might be responsible for the increased number of colony losses, including but not limited to, parasite infestations, pathogen infections, beekeeping practices, and pesticide use2-4.
Honey bees may be exposed to pesticides via two main pathways. Pesticide exposure outside of the hive can occur when foraging individuals come into contact with crops that have been sprayed with chemicals for protection from pests. Pesticide exposure within the hive can occur when beekeepers utilize chemicals to control in-hive pests and pathogens, such as mites, bacteria, and microsporidia4. Pesticide residues have been identified within wax, pollen, and honey bee samples from 24 apiaries in the United States and Canada5,6. Effects of pesticide contact to honey bees include acute toxicity as well as sub-lethal effects such as paralysis, disorientation, and behavioral and health changes1,7. As modern agriculture requires the use of pesticides to maintain high crop yields, these chemicals will continue to be relied upon in the future2. In order to better protect honey bees from pesticide exposures, there is a need for the development of new protocols and regulations5. One possible approach for protection is the use of repellents to reduce the exposure of honey bees to pesticides while foraging for food.
Insect repellents (IRs) have typically been used as personal bite protection measures against arthropod disease vectors8. The most widely used and successful IR, developed more than 60 years ago, is DEET8,9. It is considered to be the gold standard for insect repellent testing and is used by the World Health Organization and Environmental Protection Agency as a positive control for novel repellent screening10. Additionally, DEET has been found to disperse honey bees from a threat to their colony11. Current attributes associated with personal IRs include: (1) lasting effect against a broad number of arthropods; (2) non-irritating to the user when applied to the skin or clothing; (3) odorless or pleasant odor; (4) no effect on clothing; (5) no oily appearance when applied to skin and to withstand sweating, washing, and wiping by the user; (6) no effect on commonly used plastics; and (7) chemically stable and affordable for widespread use12. A repellent used for honey bees would only need a few of these attributes such as lasting effects, non-irritating to applicators, odorless or pleasant odor, chemically stable and affordable for widespread use, and non-toxic to honey bees. However, before exploring these attributes in depth, a method for screening compounds for repellency/deterrence in a high-throughput manner is needed. Here, we describe a protocol for a laboratory assay to screen compounds for the deterrence of honey bees, an important step in determining repellency. The following protocol is modified from a previous study describing a visual tracking method to assess the sublethal effects of pesticides on honey bees13. However, this protocol differs in that it is designed to measure the effects of candidate repellents that might deter honey bees from pesticide-treated crops. There are no recommended protocols for the laboratory testing of chemical deterrents for honey bees and, thus, this protocol provides a simple approach to screen such compounds.
Access restricted. Please log in or start a trial to view this content.
Protocol
1. Prepare Sugar-agarose Cubes
- Weigh out 8 g of sugar and place into a 50 mL Erlenmeyer flask.
- Fill the Erlenmeyer flask with 20 mL of de-ionized water. Dissolve the sugar by swirling the flask.
- Weigh 170 mg of agarose and add it to the sugar solution.
- Heat the sugar-agarose solution in a microwave on high for 25 s. Dissolve the agarose into the sugar solution.
- Allow the flask and sugar-agarose solution to cool.
NOTE: The flask should be cool to the touch, but do not allow the solution to solidify.- To prepare a sugar-agarose cube for the control treatment, pour the semi-cooled sugar-agarose solution into a weigh boat mold.
NOTE: The weigh boat mold has the dimensions 1.5 x 1.5 x 0.3 cm3. - To prepare a sugar-agarose-compound cube for the repellent treatment, add the desired amount of compound to the semi-cooled solution (e.g., 1% DEET in sugar-agarose solution (v/v)). Swirl the flask to mix in the compound and then pour the solution into a weigh boat mold.
NOTE: Eight control molds and eight test molds will be prepared at this point. Control molds do not contain repellent.
- To prepare a sugar-agarose cube for the control treatment, pour the semi-cooled sugar-agarose solution into a weigh boat mold.
- Cool the sugar-agarose cubes in the molds in a refrigerator for 5-10 min. Remove the solidified sugar-agarose cubes from the weigh boat molds and place them into a plastic container with a moistened paper towel.
- Place the containers into a refrigerator for storage. The sugar-agarose cubes should be used within 7 days of preparation.
2. Programming the Video Tracking Software and Experimental Setup
- Under Experiment Settings in the Experiment Explorer bar (in the tracking software, see Materials Table), located on the left of the screen, make sure that the correct camera is selected and that the video recording is centered on the petri dish arenas.
- If the video recording needs to be centered, go into the settings of the camera and under the AOI controls and select the center X and center Y options.
- Under Experiment Settings, change the number of arenas to 16. Under Tracked Features select Center-point detection.
- Select Arena Settings to setup the arena desired for the assay.
- Place the 16 Petri dishes in a 4 x 4 pattern on top of a light box, positioned under the camera (Figure 1).
NOTE: These dishes are used to create the recording arena and are empty.
- Place the 16 Petri dishes in a 4 x 4 pattern on top of a light box, positioned under the camera (Figure 1).
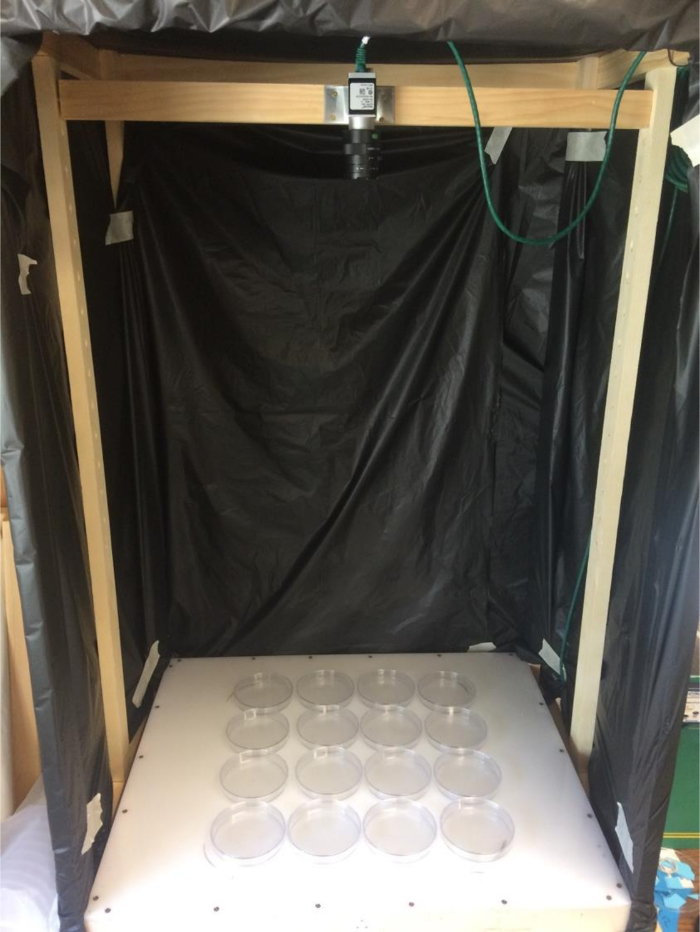
Figure 1: Petri dish arrangement on the light box. Petri dishes are arranged in a 4 x 4 block on top of the light box. This arrangement provides easy identification of the control and repellent treatments for the visual tracking protocol. Please click here to view a larger version of this figure.
- In the Arena Settings, use the grab background button, located on the right side tool panel, to take a picture of the 16 Petri dishes. This will be used as the template to setup the arena.
- Select "Create ellipse" from the tool bar at the top of the Arena Settings screen and create a circle that matches the diameter of one of the petri dishes in the image grabbed. Place the Arena 1 marker into the circle (Figure 2).
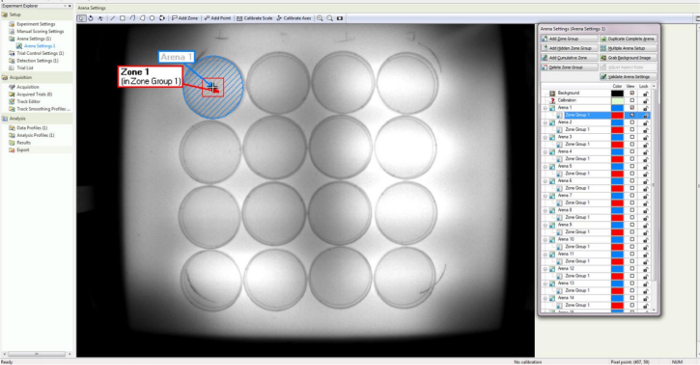
Figure 2: Screenshot of the Visual Tracking Software Arena Settings. The observation of diagonal stripes within the circle provides confirmation of the detection area in the circle. A Zone 1 marker is provided for each square and defines the target zone for each Petri dish. Please click here to view a larger version of this figure.
- Select "Zone Group 1" located under Arena 1 in the right side tool panel. Select "Create Rectangle" from the tool bar at the top of the screen. Create a 30 x 30 pixel square using this and then position it at the center of the circle that was created in the previous step. Select "Add Zone" from the top tool bar and then click in the middle of the square. Move the Zone 1 marker so that it is in the square.
NOTE: The square created is the feeding zone and it is not a requirement that the feeding zone be exactly the same size as listed as long as it is slightly larger than the sugar-agarose cube.
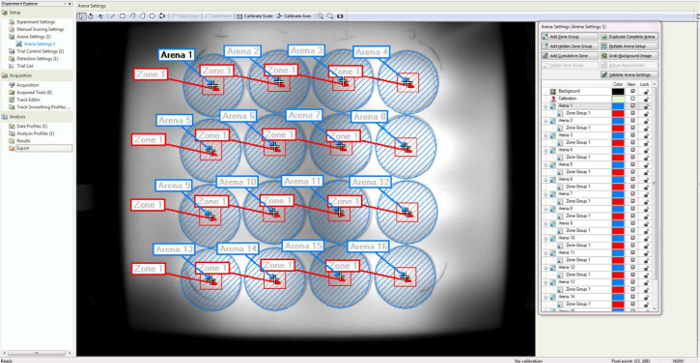
Figure 3: Screenshot of Completed Arena Settings. The completed arena settings should look like this example. Please click here to view a larger version of this figure.
- Select "Arena 1" in the right side tool panel and then click duplicate complete arena. From the drop down menu select "All Other Arenas" and then click ok. Move the duplicated arena setups to the remaining petri dishes in the grabbed image (Figure 3).
- Select "Arena 1" and then select "Calibrate Scale" on the top tool bar. Draw the calibration line across the diameter of the Arena 1 Petri dish. Change the diameter measurement to 9 cm (diameter of the Petri dishes being used). Select "Validate Arena Settings" on the right side tool panel.
- Select "Detection Settings" on the control bar on the left.
- Select "Detection Settings 1" and then select "Grey Scaling" in the drop down menu located on the right side tool box. Under detection, set the range so that it is 0 to 83 (Figure 4A).
- Right click "Detection Settings" and make a new setting named "Detection Settings 2". Make sure "Grey Scaling" is still selected, but do not change the other parameters.
NOTE: There will be large yellow circles in the video window over the arenas. This will aid in arranging the Petri dishes into the correct positions before recording (Figure 4B).
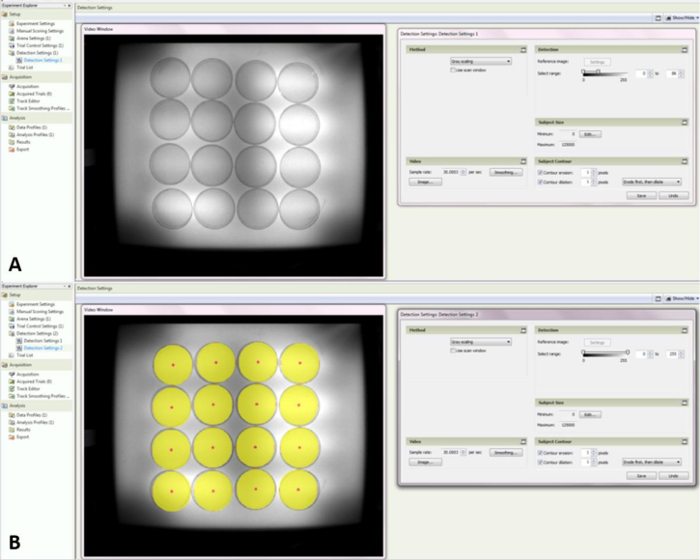
Figure 4: Screenshot of the Detection Settings 1 and 2. (A) Shows what the arena will look like with the grey scaling corrected for a honey bee subject in a petri dish. (B) Shows the arena detection area so that positioning of the petri dishes can be done between trials. Please click here to view a larger version of this figure.
- Select "Trial List" in the Experimental Explorer and click "Add Variable" in the top tool bar. Name the user defined variable as "Treatment". Select the "Predefined Values" drop down bar in the user-defined Treatment column and add C (control) and T (treatment) as Predefined Values. Select the "Add Trials" button located on the top tool bar. Add two trials, then for each arena select whether it is a control arena (C) or treatment arena (T) (Figure 5).
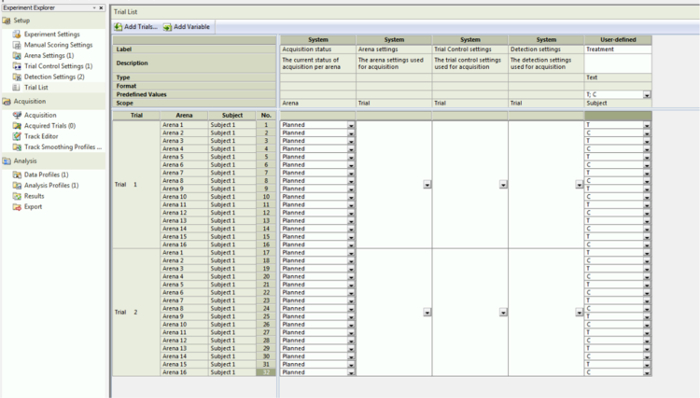
Figure 5: Screenshot of the Trial List. Labeling the arenas correctly is important here as the program uses the information here to separate the data to statistically analyze it. Please click here to view a larger version of this figure.
- Select "Data Profile" under the Experiment Explorer panel. On the left hand column select "Treatment" located under the "User-defined Independent Variables" heading. This will add a "Filter" box into the area with the flow chart. Select "C" in the pop up box and then place the newly created filter in between the "Start" box and "Result 1" box. The flowchart arrows should adjust so that they point from the start box to the filter and finally to the result 1.
- Repeat step 2.12, however this time select "T" for the filter and then select "Result" under the "Common Elements" section. Move the newly created boxes into the flowchart area and connect the boxes with arrows (Figure 6).
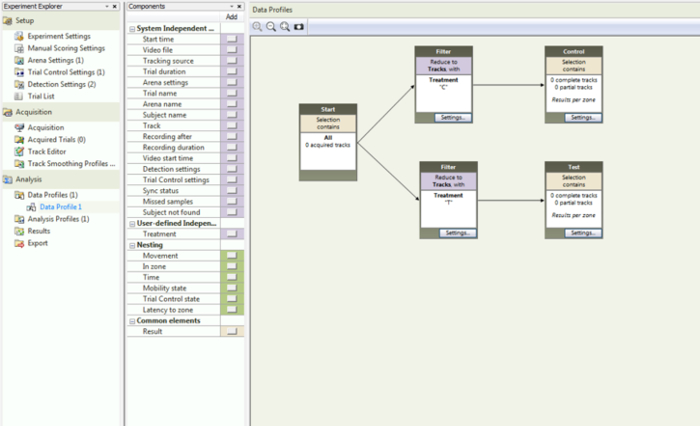
Figure 6: Screenshot of Data Profile. This shows how the flowchart should be set up to get the appropriate separation in the statistical analysis. Please click here to view a larger version of this figure.
- Save the file.
3. Collect Honey Bee Individuals
- Put on protective clothing and select a hive to collect honey bees (mostly foragers).
- Remove the outer and inner cover of the hive. Use a hive tool to select a frame from the top hive body that does not contain brood. Gently lift the frame out of the hive box.
- Inspect the frame for the honey bee queen. If she is not there, sweep the honey bee workers from the frame into a container for transport. Collect enough individuals to be able to run two complete trials for each compound to be tested (16 individuals are utilized per trial with controls).
NOTE: The collected individuals should primarily be foragers; however, there may be other aged individuals such as nurse bees included in the collection. - Make a note of the time when the honey bees were removed. Transfer them into a 9 cm x 7 cm x 9 cm plastic box containing air holes and place them into an incubator at 32 °C and 70% relative humidity.
- Starve the honey bees for 15 h.
NOTE: This usually works best if the honey bees are collected the evening prior to being tested.
4. Conduct Visual Tracking Assay
- Start up the visual tracking program and open the saved experimental file that was created for this assay.
- Select "Detection Settings 2".
- Place control sugar-agarose cubes into the centers of 8 of the 16 Petri dishes. Repeat this process with the sugar-agarose-compound (deterrent) cubes in the remaining 8 dishes.
- Use forceps to remove a single honey bee from the plastic box and place it into one of the control petri dishes.
- Repeat step 4.4 for the remaining 15 Petri dishes.
- Place all of the dishes on to the light box and position them so that the arena detection areas (shown on the computer screen when detection setting 2 is selected) fit into each of the petri dish arenas. Illuminate the light box from below by an array of LED lights set to the red spectrum. Surrounded the entire box and camera with a black plastic sheet to eliminate external light and reduce shadows within the arenas.
- After the petri dishes have been set, make sure "Detection Settings 1" is the selected setting.
NOTE: At this point the visual tracking software should be picking up only the honey bees within the petri dish arenas. - Select "Acquisition" from the Experiment Explorer. Press the green "Start Trial" button located in the Acquisition Control pop up box on the right to begin recording.
- Run the assay for 10 min and then click the red "Stop Trial" button on the Acquisition Control pop up box to stop recording.
- Remove the individuals from the petri dishes and place them into a separate container so that they are not tested twice.
- Repeat steps 4.4-4.10 for the second trial on the same compound.
NOTE: This method can be modified to increase the number of honey bees per treatment as needed by the user. - Select Statistics in the Experiment Explorer and then click calculate.
- Export the data to a data manager software and then analyze the data for significance using a using a one-way analysis of variance with a Tukey's post-test, and an unpaired t-test using preferred statistical software program.
Access restricted. Please log in or start a trial to view this content.
Results
A visual tracking protocol was developed to record the amount of time the honey bees spent in a target zone with either sugar-agarose (control treatment) or sugar-agarose-compound cube (deterrent treatment). The recorded time was analyzed using a statistical software program and the mean time spent ± standard error in the target zone is reported as a bar graph. DEET, the gold standard for insect repellent/deterrent testing, was used in this protocol as a positive control. The honey bees p...
Access restricted. Please log in or start a trial to view this content.
Discussion
This visual tracking protocol provides a simple approach to screen chemical deterrents for honey bees in a relatively quick and easy manner. There are no recommended protocols for the laboratory testing of chemical deterrents for honey bees. Previous semi- and full-field studies have examined honey bee repellents14,15; however the described protocols are time consuming, labor intensive, and require additional facility resources outside of a general laboratory. Th...
Access restricted. Please log in or start a trial to view this content.
Disclosures
The authors have nothing to disclose.
Acknowledgements
We would like to thank Dr. Thomas Kuhar for the use of the visual tracking software and equipment. We thank James Wilson and Scott O'Neal for their technical assistance.
Access restricted. Please log in or start a trial to view this content.
Materials
| Name | Company | Catalog Number | Comments |
|---|---|---|---|
| 50 mL Erlenmeyer flask | Kimax | 26500-50 | used for making the sugar/agarose cubes |
| Sugar | Kroger | any similar product will sufffice | |
| Deionized water | acquired in house | ||
| Agarose | Apex | 20-102 | used for making the sugar/agarose cubes |
| Mold for agarose cubes (Weigh Boat) | any mold that will provide the researcher with a 1.5 cm x 1.5 cm x 0.3 cm sugar/agarose cube will suffice | ||
| EthoVision XT | Noldus | visual tracking software | |
| 633 nm LEDs | Cyron | HTP904E | These lights were placed into a constructed light box to illuminate the arenas from below. The box was a simple wooden structure with a frosted plastic/plexi glass cover that allowed the light to disperse upwards without any glare. |
| Laptop or PC | Dell | Inspiron One 2305 | necessary for video tracking software. Any pc device capable of runnin tbe visual tracking software will suffice |
| Bee Keeping protective clothing | Dadant & Sons Inc | V0126 | any protective hood and jacket will suffice |
| Hive tool | Dadant & Sons Inc | M00757 | used to open honey bee hive |
| Container for honey bees | any container suitable for housing and storing honey bees will suffice | ||
| Featherweight forceps narrow tip | Bioquip | 4748 | used to select individual honey bees |
| 9 cm (diameter) Petri dish | Fisher Scientific | S01778 | arena used to contain individual honey bees during video tracking |
| Recording Device (Camera) | Basler | acA-1300-60gm | any device that can record the subject clearly and transfer the file to a computer will suffice |
| GraphPad Prism | Graphpad | any statistical software package will suffice |
References
- Gallai, N., Salles, J. M., Settele, J., Vaissière, B. E. Economic valuation of the vulnerability of world agriculture confronted with pollinator decline. Ecol Econ. 68 (3), 810-821 (2009).
- van Engelsdorp, D., Meixner, M. D. A historical review of managed honey bee populations in Europe and the United States and the factors that may affect them. J Invertebr Pathol. 103, Suppl 1. S80-S95 (2010).
- Aizen, M. A., Harder, L. D. The Global Stock of Domesticated Honey Bees Is Growing Slower Than Agricultural Demand for Pollination. Current Biol. 19 (11), 915-918 (2009).
- Smith, K. M., Loh, E. H., Rostal, M. K., Zambrana-torrelio, C. M., Mendiola, L., Daszak, P. Pathogens, Pests, and Economics Drivers of Honey Bee Colony Declines and Losses. Ecohealth. 10, 434-445 (2014).
- Mullin, C. A., Frazier, M., et al. High Levels of Miticides and Agrochemicals in North American Apiaries: Implications for Honey Bee Health. PLoS ONE. 5 (3), (2010).
- Li, Y., Kelley, R. A., Anderson, T. D., Lydy, M. J. Development and comparison of two multi-residue methods for the analysis of select pesticides in honey bees, pollen, and wax by gas chromatography - quadrupole mass spectrometry. Talanta. 140, 81-87 (2015).
- Kakumanu, M. L., Reeves, A. M., Anderson, T. D., Rodrigues, R. R., Williams, M. A., Williams, M. A. Honey Bee Gut Microbiome Is Altered by In-Hive Pesticide Exposures. Front Microbiol. 7, 1-11 (2016).
- Katz, T. M., Miller, J. H., Hebert, A. A. Insect repellents: Historical perspectives and new developments. J Am Acad Dermatol. 58 (5), 865-871 (2008).
- Dickens, J. C., Bohbot, J. D. Mini review: Mode of action of mosquito repellents. Pestic Biochem Phys. 106 (3), 149-155 (2013).
- Lawrence, K. L., Achee, N. L., Bernier, U. R., Mundal, K. D., Benante, J. P. Field Evaluations of Topical Arthropod Repellents in North, Central, and South America. J Med Entomol. 51 (5), 980-988 (2014).
- Collins, A. M., Rubink, W. L., Cuadriello Aguilar,, I, J., Hellmich Ii,, L, R. Use of insect repellents for dispersing defending honey bees (Hymenoptera Apidae). J Econ Entomol. 89 (3), 608-613 (1996).
- Brown, M., Hebert, A. A. Insect repellents: An overview. J Am Acad Dermatol. 36 (2), 243-249 (1997).
- Teeters, B. S., Johnson, R. M., Ellis, M. D., Siegfried, B. D. Using video-tracking to assess sublethal effects of pesticides on honey bees (Apis mellifera L.). Environ Toxicol Chem. 31 (6), 1349-1354 (2012).
- Vallet, A., Cassier, P., Lensky, Y. Ontogeny of the fine structure of the honeybee (Apis mellifera L.) workers and the pheromonal activity of 2-heptanone. J Insect Physiol. 37 (11), 789-804 (1991).
- Free, J. B., Ja Pickett,, Ferguson, aW., Simpkins, J. R., Smith, M. C. Repelling foraging honeybees with alarm pheromones. J Agr Sci. 105 (2), 255(1985).
Access restricted. Please log in or start a trial to view this content.
Reprints and Permissions
