A highly promising technique to generate tissue constructs without using matrix is to culture cells in a simulated microgravity condition. Using a rotary culture system, we examined ovarian follicle growth and oocyte maturation in terms of follicle survival, morphology, growth, and oocyte function under the simulated microgravity condition.
Method Article
In Vitro Growth of Mouse Preantral Follicles Under Simulated Microgravity
Shen Zhang1 , Yonggen Wu1 , Yimin Weng2 , Zhihui Xu1 , Wenmin Chen3 , Dahan Zheng4 , Wei Lin5 , Jun Liu6 , Ying Zhou1,7
1Reproductive Medicine Center, The First Affiliated Hospital of Wenzhou Medical University, 2Department of Orthopaedics, The Second Affiliated Hospital of Wenzhou Medical University, 3Department of Obstetrics, The First Affiliated Hospital of Wenzhou Medical University, 4School of Laboratory Medicine and Life Science, Wenzhou Medical University, 5School of Pharmaceutical Science, Wenzhou Medical University, 6Stem Cells and Genetic Engineering Group, AgriBioscience Research Centre, Department of Economic Development, Jobs, Transport and Resources, 7Department of Histology and Embryology, Wenzhou Medical University
Opens in a new tab
In This Article
Summary
Loading...
$$\rightleftharpoonup{xx}$$
$$\longleftharp{xx}$$,
$$\longrightharp{xx}$$,
Abstract
Loading...
$$\rightleftharpoonup{xx}$$
$$\longleftharp{xx}$$,
$$\longrightharp{xx}$$,
14 day-old mouse ovarian tissue and preantral follicles isolated from same-aged mice were incubated in a simulated microgravity culture system. We quantitatively assessed follicle survival, measured follicle and oocyte diameters, and examined ultrastructure of the oocytes produced from the system. We observed decreased follicle survival, downregulation of expressions of proliferating cell nuclear antigen and growth differentiation factor 9, as indicators for the development of granulosa cells and oocytes, respectively, and oocyte ultrastructural abnormalities under the simulated microgravity condition. The simulated microgravity experimental setup needs to be optimized to provide a model for investigation of the mechanisms involved in the oocyte/follicle in vitro development.
Introduction
Loading...
$$\rightleftharpoonup{xx}$$
$$\longleftharp{xx}$$,
$$\longrightharp{xx}$$,
In vitro ovarian follicle development and oocyte maturation have been achieved using traditional methods for 2-dimensional culture, such as on the surface of petri dishes, and three dimensional (3D) matrix, such as alginate and hydrogel1,2,3. A 3D culture system effectively maintained follicles in a tissue-like structure and kept the similar gene expression profiles as in vivo4 follicles, and produced meiotically competent oocytes5,6. 3D culture systems can also be established in a matrix-free condition, for example, hanging drop suspension and rolling vessels. The rotating wall vessel (RWV) developed by the National Aeronautics and Space Administration (NASA) generates a simulated microgravity (s-µg) for the cells cultured inside the vessel7. This simulated microgravity condition provides a unique culture system for cell proliferation and differentiation because of the lack of sedimentation for convection. It has been shown that simulated microgravity promoted endothelial vessel formation from endothelial cells8,9, thyroid tissue assembling from thyroid cells10, and chondrogenesis from adipose-derived mesenchymal stem cells in RWV devices11. However, other studies have shown that simulated microgravity induced apoptosis in gastric cells and B lymphoblasts12,13,14, suggesting the effects of simulated microgravity on cellular injury may be cell type-dependent. Simulated microgravity could also cause changes at the ultrastructural level, as reported in the disturbed spindle organization and induced cytoplasmic blebbing in oocytes15. The optimized simulated microgravity conditions and mechanisms that induce tissue engineering or cellular injuries under the system require further investigation. In vitro experiments of growing ovarian follicles/oocytes using RWV devices can provide valuable information on oocyte gene expressions and ultrastructures of oocyte organelles. In this study, ovarian tissue containing preantral follicles and isolated preantral follicles was used to investigate the effects of simulated microgravityon follicle development and oocyte maturation.
In this study, ovarian tissue containing preantral follicles and isolated preantral follicles were used to investigate the effects of simulated microgravity on follicle development and oocyte maturation. In our study, the RWV, a simulated microgravity device, spins around a horizontal axis inside a 5% CO2 incubator, providing a simulated microgravity condition with efficient oxygenation and very low shear stress. We analyzed the gene expressions of proliferating cell nuclear antigen (PCNA) and growth differentiation factor 9 (GDF-9) as indicators for the development of granulosa cells and oocytes, respectively. We demonstrated that PCNA and GDF-9 expressions were suppressed in the granulosa cells and oocytes, respectively, when cultured in the RWV device, and we showed the withdrawal of oocyte microvilli from the zona pellucida in the follicles cultured under the s-µg condition, which was similar to that in GDF-9-deficient mouse follicles16.
Protocol
Loading...
$$\rightleftharpoonup{xx}$$
$$\longleftharp{xx}$$,
$$\longrightharp{xx}$$,
Ethical approval for this study was obtained from the Animal Research Ethics Committee of Wen Zhou Medical College.
1. Preparation of Culture Media and Alginate Hydrogel
- Prepare ovarian tissue and follicle handling medium using L-15 medium with 10% fetal bovine serum, 100 IU/mL penicillin, and 100 µg/mL streptomycin. Store at 4 °C for two weeks.
- Prepare ovarian tissue and follicle culture medium consisting of alpha-minimal essential medium [α-MEM] supplemented with 5% fetal bovine serum [FBS], 1% insulin-selenium-transferrin, 10 mIU/ml rFSH, 100 IU/mL penicillin, and 100 µg/mL streptomycin. Store at 4 °C for two weeks.
- Prepare alginate hydrogel using 0.8% (w/v) sodium alginate solution in sterile PBS, then drop 10 µL of this solution into the encapsulation solution (140 mM NaCl /50 mM CaCl2) to create alginate beads.
NOTE: The alginate bead size was about 3 mm in diameter.
2. Mouse Follicle Isolation and Encapsulation
- Cull 14 day-old ICR female mice by cervical dislocation, remove ovaries aseptically using scissors and forceps, and put ovaries into 2 mL of handling medium.
- Cut ovaries in half using a scalpel. The half-sized ovarian tissue was about 1 mm thickness for culture in the culture medium.
- Manually isolate follicles from ovaries using 26 1/2-guage needles under a 2-4X stereomicroscope, and collect the selected follicles for culture in the culture medium.
NOTE: Follicle selection criteria: 1) follicles were round with oocytes in the middle and 2-3 layers of granulosa cells surrounding the oocytes, 2) follicles had an intact basal membrane attached with some theca cells, and 3) follicle size was 90-100 µm in diameter - Create alginate beads per step 1.3. Wash follicles with alginate solution and then pipette a single follicle into the middle of each alginate bead to make certain every bead contains a single follicle under a stereomicroscope. After rinsing in culture medium, culture the alginate beads in 150 µL of culture medium in a 35×10 mm culture dish or a RWV device.
3. Ovarian Tissue or Follicle Culture Under Simulated Microgravity
- Use a RWV device for generating simulated microgravity. Fill the vessel with light paraffin oil (~10 mL), place 150 µL of culture medium in a droplet into the oil, then transfer one piece of ovarian tissue or three alginate beads with encapsulated follicles into the medium droplet. Close the vessel port cap and fix the vessel onto the rotating base of the device.
- In control groups, place alginate beads containing follicles or ovarian tissue into 150 µL of culture medium in a droplet covered with light paraffin oil in 35×10 mm culture dishes.
- Incubate both the culture dishes and RWV device in a humidified incubator at 37 °C with 5% CO2 in air.
- To change culture medium in RWV device: pour the oil and medium from the vessel into a 150×20 mm culture dish, transfer the ovarian tissue or alginate beads to a culture dish with culture medium. Re-establish the vessel culture system per step 3.1.
4. Decapsulation and Follicle Retrieval
- After 4 days of culturing, pour the oil and medium from the vessel into a 150×20 mm culture dish. Pick up alginate beads and decapsulate follicles from the alginate beads by incubating in handling medium supplemented with 10 U/mL alginate lyase for 30 min at 37 °C.
- Collect follicles and then wash them in handling medium under a stereomicroscope.
5. Ovarian Tissue and Follicle Assessment
- Cell Viability Assay
- Wash the decapsulated follicles three times in D-PBS, and then incubate them in 150 µL of the combined Cell Viability Assay reagents (2 µM calcein AM and 4 µM EthD-1) at room temperature for 45 min.
- Transfer follicles to a clean microscope slide with 10 µL D-PBS, cover with a coverslip, and then seal with clear fingernail polish.
- Count green and red cells in the slides under a confocal fluorescence microscope (400X).
NOTE: In this viability assay, green cells are live cells, and red cells are dead cells. Follicles with less than 10% red cells (dead) are considered as survived follicles.
- Hematoxylin and Eosin (H&E) Staining of Ovarian Tissue and Follicle
- Fix fresh 14-day-old mouse ovaries and preantral follicles isolated from 14-day-old mice in Bouin's solution as Day 0 samples. Fix the cultured ovarian tissue after either 2-day or 4-day culture, and individual follicles inside the alginate beads after 4-day culture as experimental samples.
- Embed all samples in paraffin, section serially at 5 µm thickness, and then stain with H&E according to the manufacturer's instructions.
- Follicle Counting and Diameter Measurement
- In ovarian tissue sections stained with H&E, count all follicles and healthy preantral follicles within the tissue section area under a microscope (magnification 400X). Calculate follicle density by dividing the number of preantral follicles by the total number of follicles.
NOTE: the healthy preantral follicles are those with at least two layers of granulosa cells. - Measure follicle and oocyte diameter of the Day 0 follicles and Day 4 cultured follicles.
- In ovarian tissue sections stained with H&E, count all follicles and healthy preantral follicles within the tissue section area under a microscope (magnification 400X). Calculate follicle density by dividing the number of preantral follicles by the total number of follicles.
- Immunohistochemistry
- Fix ovarian tissue in 4% paraformaldehyde, embed in paraffin, section at 5-µm-thickness, and mount tissue sections on slides. Dewax the sections, rehydrate, and incubate them in citrate buffer for 15 min. Block the endogenous peroxidase in 3% hydrogen peroxide, unmask antigen in 5% goat serum, and then incubate with primary antibodies at room temperature for 3 h.
- Wash in PBS for 3 min, then incubate the slides with 1:500 diluted horseradish peroxidase (HRP)-conjugated goat anti-rabbit IgG (H+L) for 1 h at room temperature.
NOTE: The primary antibodies used in the study were rabbit anti-GDF-9 antibody (1:500 dilution) and rabbit anti-PCNA antibody (1:200 dilution).
- Wash in PBS for 3 min, then incubate the slides with 1:500 diluted horseradish peroxidase (HRP)-conjugated goat anti-rabbit IgG (H+L) for 1 h at room temperature.
- Incubate ovarian section slides with 3,3'-Diaminobenzidine [DAB] to detect the peroxidase activity and mount on glass slides with aqueous mounting medium.
- Observe ovarian section slides under a microscope at 400X magnification.
- Fix ovarian tissue in 4% paraformaldehyde, embed in paraffin, section at 5-µm-thickness, and mount tissue sections on slides. Dewax the sections, rehydrate, and incubate them in citrate buffer for 15 min. Block the endogenous peroxidase in 3% hydrogen peroxide, unmask antigen in 5% goat serum, and then incubate with primary antibodies at room temperature for 3 h.
- Transmission Electron Microscopy [TEM]
- Fix follicles in 2.5% glutaraldehyde for 3 h at room temperature, then post-fix in 1% osmium tetroxide for 1 h at 37 °C. Wash with PBS, then treat the follicles with 1% phosphotungstic acid and 1% sodium uranyl acetate for 1 h at 37 °C. Dehydrate follicles using an acetone series: 25, 50, 75, 95, and 100% (3 times), and epoxy resin-acetone mixture after the final 100% acetone step at 37 °C, and then embed in epoxy resin at 45 °C.
- Cut the embedded blocks into 1.0 µm semi-thin sections, and stain the sections with 1% methylene blue for 1-2 min to localize the follicles in the blocs. Cut the embedded blocks into 50 nm ultrathin sections and mount the sections on grids for TEM.
6. Statistical Analysis
- Present all data in mean ± SEM format. Determine the differences between groups by one-way analysis of variance (ANOVA) followed by Tukey multiple comparison test. The α threshold for test result significance was set at p < 0.05.
Results
Loading...
$$\rightleftharpoonup{xx}$$
$$\longleftharp{xx}$$,
$$\longrightharp{xx}$$,
Figure 1A shows a RWV with oil inside the vessel. A droplet of 150 µL medium containing one piece of ovarian tissue or three alginate beads with encapsulated follicles was put into the oil. The medium droplet was kept in a state of terminal velocity due to the fluid drag on the droplets within the rotating oil at rate of 25 rotations per minute, which generated a simulated microgravity (s-µg) condition. In a control experiment, ovarian tissue or capsulated follicles were cultured in a droplet of 150 µL medium covered with mineral oil in 35×10mm dishes (Figure 1B), which generated a 1-g condition.
To study the effects of simulated microgravity on preantral follicle development in vitro, we cultured the 14 day-old mouse ovarian tissue under 1-g (control experiment) or s-µg conditions. We counted the number of healthy follicles in the H&E stained sections in two conditions after 0, 2, and 4 days of culture (Figure 2). We found that the follicle survival in ovarian tissue treated in the s-µg condition was significantly lower than that under the 1-g condition at day 2 and day 4 of culturing (p <0.05, ANOVA). Moreover, we found that no PCNA positive signals were detected in the ovarian tissue under the s-µg condition (Figure 3). In the culture of isolated preantral follicles encapsulated in alginate beads, we revealed that significantly more follicles survived under 1-g condition (76.8% ± 5.3%, n = 227) than s-µg condition (54.4% ± 6.7%, n = 249) on day 4 of culturing. In addition, oocyte size had no significant increase after 4 days of culturing, though the follicle size increased significantly under both gravity conditions (Figure 4). However, follicles with less than 10% dead granulosa cells (Figure 5) were significantly lower under the 1-g condition (81.5 ± 5%, n = 10) than under s-µg condition (90 ± 8%, n = 10) (p <0.05).
To investigate the effects of simulated microgravity on oocyte functionality, we examined the expression of the oocyte-specific marker GDF-9. We demonstrated that GDF-9 expression was remarkably down-regulated in the ovarian tissue under s-µg condition (Figure 6). In addition, we demonstrated frequent ultrastructural abnormalities of oocyte organelles in the encapsulated follicles at day 4 of culture under the s-µg condition (Figure 7).
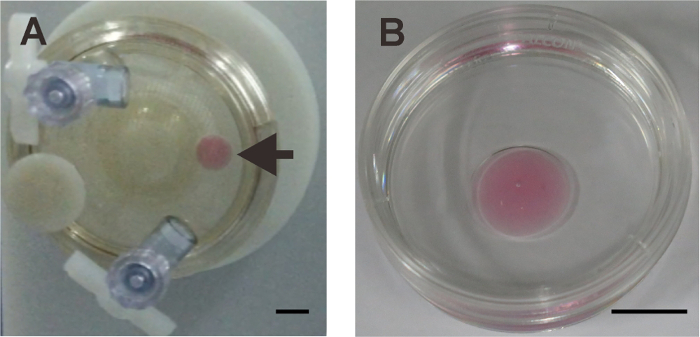
Figure 1: Setup of s-µg and 1-g culture conditions. (A) s-µg was created by the rotating wall vessel and keeping the culture subjects in a state of constant free-fall within the moving oil. (B) A 1-g condition was created by culturing ovarian tissue or follicles on the surface of a petri dish covered with mineral oil. The arrow indicates a droplet of medium. Scale bar = 1 cm. This figure has been modified from Zhang et al.17 Please click here to view a larger version of this figure.
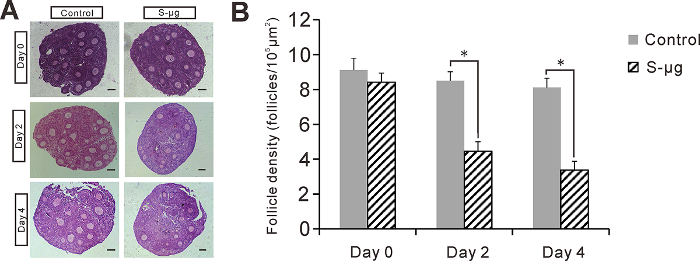
Figure 2: Effects of s-µg on the ovarian tissue culture. (A) Sections of ovarian tissue cultured under 1-g or s-µg conditions for 0, 2, and 4 days. Scale bar = 50 µm. (B) Follicle density in the ovarian tissue sections. Error bar represents 1 SEM, *: p <0.05. This figure has been modified from Zhang et al.17 Please click here to view a larger version of this figure.
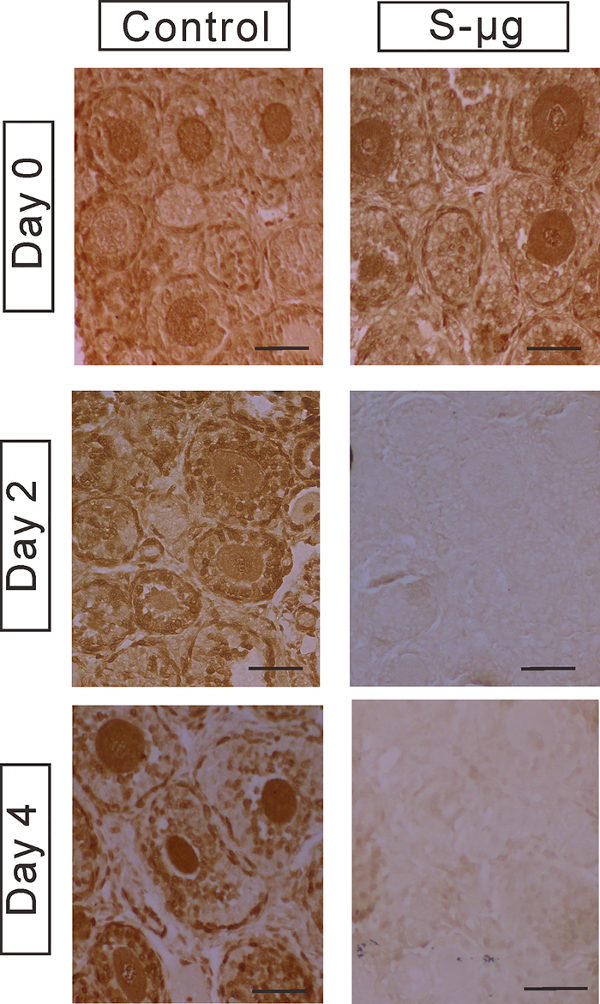
Figure 3: Immunohistochemistry of PCNA. PCNA protein expression was examined in the granulosa cells in the ovarian tissue cultured under 1-g or s-µg conditions for 0, 2, and 4 days. Scale bar = 50 µm. This figure has been modified from Zhang et al.17 Please click here to view a larger version of this figure.
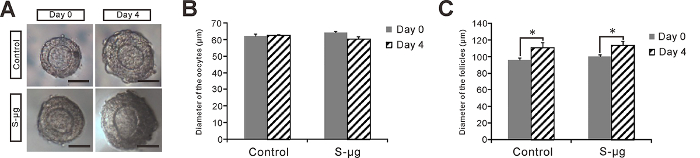
Figure 4: Effects of s-µg on the culture of encapsulated preantral follicles in alginate beads. (A) Morphology of preantral follicles cultured under 1-g or s-µg conditions for 0 days and 4 days. Scale bar = 50 µm. (B) Oocyte diameter and (C) follicle diameter were compared between 1 g and s-µg conditions. Error bar represents 1 SEM, *: p <0.05. This figure has been modified from Zhang et al.17 Please click here to view a larger version of this figure.
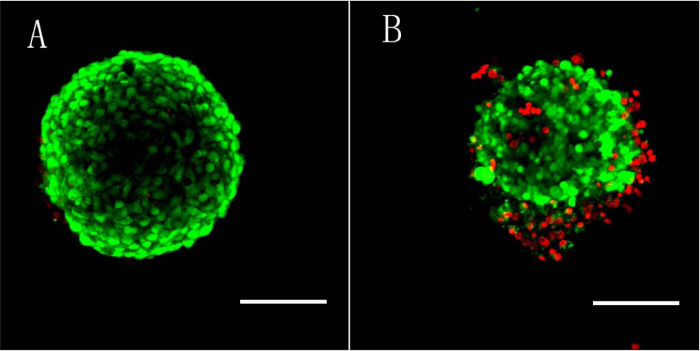
Figure 5: Cell viability assay. Representative images were taken under a microscope at 400X magnification. The assay uses Calcein AM to visualize live cells stained in green and EthD-1 to visualize the nuclei of dead cells stained in red. (A): A follicle with ~100% live granulosa cells (green). (B): A follicle with live granulosa cells (green), as well as more than 10% dead cells (red). Scale bar = 50 µm. This figure has been modified from Zhang et al.17 Please click here to view a larger version of this figure.
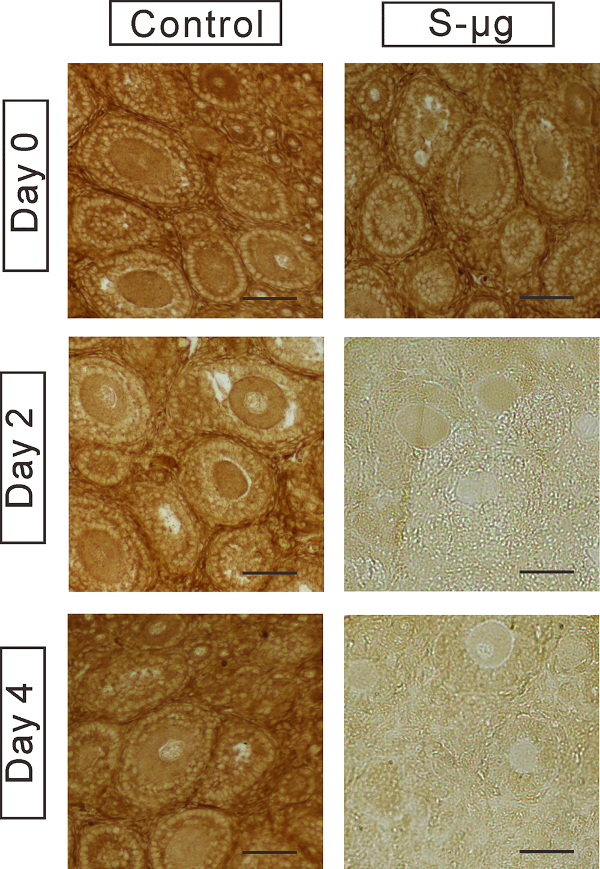
Figure 6: Immunohistochemistry of GDF-9. GDF-9 protein expression was examined in the oocytes in the ovarian tissue cultured under 1-g or s-µg conditions for 0, 2, and 4 days. Scale bar = 50 µm. This figure has been modified from Zhang et al.17 Please click here to view a larger version of this figure.
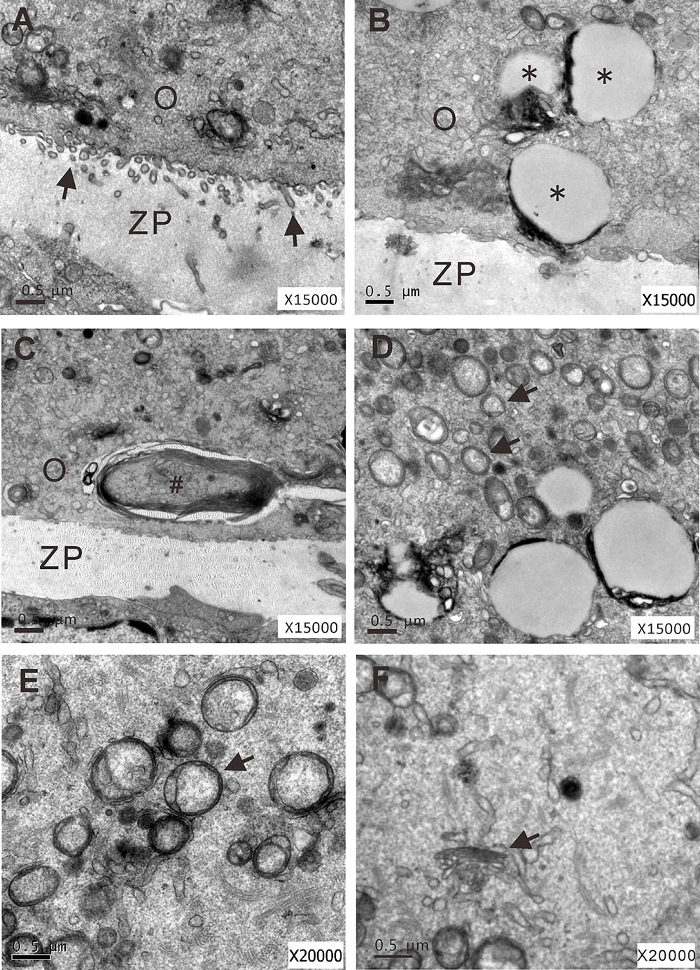
Figure 7: Ultrastructural analysis of isolated preantral follicles cultured under 1-g or s-µg conditions on day 4 of culture. (A) An oocyte with microvilli (arrows) extending into the zona pellucida (1-g condition). (B-F) Oocytes with large vacuoles (*), multilamellar bodies (#), lipid droplets (arrows), vacuolated mitochondria lacking cristae (arrow), and dispersing Golgi apparatus (arrow), respectively (s-µg condition). O: oocyte; ZP: zona pellucida. This figure has been modified from Zhang et al.17 Please click here to view a larger version of this figure.
Discussion
Loading...
$$\rightleftharpoonup{xx}$$
$$\longleftharp{xx}$$,
$$\longrightharp{xx}$$,
The critical steps for successful culturing of preantral follicles are: 1) correctly selecting the preantral follicles according to the selection criteria that were described in Protocol Text 2.1); 2) preforming all procedures in a skeptical condition and maintaining a sterile culture; and 3) correctly setting up the RWV culture system.
The safeguarding of consistency of experimental observations in the replicate experiments is to use similar or identical materials. The criteria for the selection of mouse preantral follicles revealed that the follicles had 1) healthy oocytes at the germinal vesicle breakdown (GVBD) stage surrounded by a thin zona pellucida; 2) 2-3 layers of granulosa cells enclosed by a basal membrane; and 3) some thecal cells attached to the basal membrane. Thus, the follicles selected had not only all three functional compartments of an ovarian follicle for supporting oocyte growth, but also a similar morphological identification with a diameter of 90 - 100 µm.
This is the first attempt to grow mouse preantral follicles in the manner of 3D culturing under the simulated microgravity. Several culture systems have been developed for mouse preantral follicles. Oocytes obtained from the follicle cultured on a flat surface of petri dishes, the so-called 2D culture, could be fertilized and produced live offspring. Moreover, 3D cultures, such as cultures of follicles in alginate beads, maintain a tissue structure similar to what the body produces in high percentage meiotically competent oocytes. However, the development process of ovarian follicles/oocytes in a zero-gravity field is unknown. RWV, a device which is attracting substantial attention in tissue engineering, can generate a simulated microgravity environment and provide an ideal environment for investigating the effects of simulated microgravity on the ovarian follicle/oocytes growth in vitro.
It is important to set up the RWV apparatus properly for cell culture. The air bubbles in the vessel must be removed. The method to remove air bubbles, if generated in the vessel, is as follows: Place two syringes with 0.5 mL of oil in each of the two syringe ports. Open the valves controlling the syringe ports. Maneuver air bubbles underneath the syringe port. Pull the bubbles into the syringe while injecting approximately the same volume of media through the other syringe port. After all bubbles are removed, close the valves, remove the syringes, and replace the syringe port caps. It is also critical to find out the correct rotation speed, which prevents cells from settling via a constant rotation. Optimization of the rotation speed is determined by the specific weight of the cells, the fluid density, and the viscosity.
The expression profiles of PCNA and GDF-9, which were similar to those in GDF-9-deficient mouse follicles16, revealed that simulated microgravity had detrimental effects on the development of granulosa cells and oocytes. The vessel of the RWV device spun around a horizontal axis inside a 5% CO2 incubator, allowing for permeation of oxygen and carbon dioxide across a membrane in the back, providing efficient oxygenation and very low shear stress, which was unlikely to be the cause of follicle/oocyte injury. Optimization of the experimental setup and further analyses are needed to investigate the mechanism of the detrimental effects.
Further studies are needed to investigate the developmental potential of the in vitro oocytes derived from the RWV culture system. In vitro maturation of oocytes to MII stage is presently being carried out. The final validation of this culture system will be examined by the fertilization capacity of the retrieved oocytes.
Disclosures
Loading...
$$\rightleftharpoonup{xx}$$
$$\longleftharp{xx}$$,
$$\longrightharp{xx}$$,
The authors declare that they have no competing financial interests.
Acknowledgements
Loading...
$$\rightleftharpoonup{xx}$$
$$\longleftharp{xx}$$,
$$\longrightharp{xx}$$,
The authors would like to thank Yilong Wang and Yanlin Zhao for their assistance in maintaining the animals, Chan Zhang for her assistance in preparing the histological samples, and Dr. Songtao He for critically reading this manuscript. This work was supported by the Natural Science Foundation of Zhejiang Province (grant number: LY13C120002).
Materials
| Name | Company | Catalog Number | Comments |
|---|---|---|---|
| ICR mice | SLRC Laoratory | 14-day-old female mice | |
| L-15 medium | Sigma | L1518 | With L-glutamine, liquid, sterile-filtered, suitable for cell culture |
| fetal bovine serum | Gibco | 10100147 | Origin: Australia |
| Penicillin V potassium | Sigma | 1504503 | United States Pharmacopeia (USP) Reference Standard (USP) |
| Streptomycin sesquisulfate hydrate | Sigma | 46754 | Analytical standard |
| Universal Click Pen Needles | Penfine | 12×1/2" 0.33×12 mm | |
| Alginate | Sigma | W201502 | |
| alpha-minimal essential medium | Sigma | M0894 | Alpha Modification, with L-glutamine, without ribonucleosides, deoxyribonucleosides and sodium bicarbonate, powder, suitable for cell culture |
| Insulin-selenium-transferrin | Invitrogen | 51500056 | Liquid, sterile-filtered, BioReagent, suitable for cell culture |
| GONAL-F | Merck Serono | Recombinant follitropin alfa for injection | |
| Disposable high-aspect-ratio rotating vessel | Synthecon | 10 mL | |
| Culture oil | Vitrolife | Sterile light paraffin oil | |
| Alginate Lyase | Sigma | A1603 | powder, >10,000 units/g solid |
| 26 1/2-guage needle | Becton Dickinson | ||
| 35×10mm dish | Becton Dickinson | ||
| Viability/Cytotoxicity assay Kit | Invitrogen | L3224 | |
| Bouin’s solution | Sigma | HT10132 | |
| Horseradish peroxidase (HRP)-conjugated goat anti-rabbit IgG (H+L) | Jackson Immuno-Research Laboratories | 111-035-003 | |
| 3,3N-Diaminobenzidine Tertrahydrochloride | Beyotime | P0203 | |
| Aqueous mounting medium | Dako | C0563 | |
| Rabbit anti-GDF-9 antibody | Beijing Biosynthesis Biotechnology | BS-175R | |
| Rabbit anti-PCNA antibody | Proteintech | 24036-1-AP | |
| Methylene blue | Sigma | M9140 | |
| Transmission electron microscope | Hitachi | H-7500 |
References
Loading...
$$\rightleftharpoonup{xx}$$
$$\longleftharp{xx}$$,
$$\longrightharp{xx}$$,
- Eppig, J. J., Schroeder, A. C. Capacity of mouse oocytes from preantral follicles to undergo embryogenesis and development to live young after growth, maturation, and fertilization in vitro. Biol Reprod. 41, 268-276 (1989).
- O'Brien, M. J., Pendola, J. K., Eppig, J. J. A revised protocol for in vitro development of mouse oocytes from primordial follicles dramatically improves their developmental competence. Biol Reprod. 68, 1682-1686 (2003).
- Liu, J., Van der Elst, J., Van den Broecke, R., Dhont, M. Live offspring by in vitro fertilization of oocytes from cryopreserved primordial mouse follicles after sequential in vivo transplantation and in vitro maturation. Biology of Reproduction. 64, 171-178 (2001).
- Parrish, E. M., Siletz, A., Xu, M., Woodruff, T. K., Shea, L. D. Gene expression in mouse ovarian follicle development in vivo versus an ex vivo alginate culture system. Reproduction. 142, 309-318 (2011).
- Xu, M., Kreeger, P. K., Shea, L. D., Woodruff, T. K. Tissue-engineered follicles produce live, fertile offspring. Tissue Eng. 12, 2739-2746 (2006).
- Xu, M., West, E., Shea, L. D., Woodruff, T. K. Identification of a stage-specific permissive in vitro culture environment for follicle growth and oocyte development. Biol Reprod. 75, 916-923 (2006).
- Grimm, D., et al. Growing tissues in real and simulated microgravity: new methods for tissue engineering. Tissue engineering. Part B, Reviews. 20, 555-566 (2014).
- Grimm, D., et al. Different responsiveness of endothelial cells to vascular endothelial growth factor and basic fibroblast growth factor added to culture media under gravity and simulated microgravity. Tissue engineering Part A. 16, 1559-1573 (2010).
- Grimm, D., et al. A delayed type of three-dimensional growth of human endothelial cells under simulated weightlessness. Tissue engineering. Part A. 15, 2267-2275 (2009).
- Pietsch, J., et al. Interaction of proteins identified in human thyroid cells. International journal of molecular sciences. 14, 1164-1178 (2013).
- Yu, B., et al. Simulated microgravity using a rotary cell culture system promotes chondrogenesis of human adipose-derived mesenchymal stem cells via the p38 MAPK pathway. Biochem Biophys Res Commun. 414, 412-418 (2011).
- Maier, J. A., Cialdai, F., Monici, M., Morbidelli, L. The impact of microgravity and hypergravity on endothelial cells. Biomed Res Int. 2015, 434803(2015).
- Zhu, M., Jin, X. W., Wu, B. Y., Nie, J. L., Li, Y. H. Effects of simulated weightlessness on cellular morphology and biological characteristics of cell lines SGC-7901 and HFE-145. Genet Mol Res. 13, 6060-6069 (2014).
- Dang, B., et al. Simulated microgravity increases heavy ion radiation-induced apoptosis in human B lymphoblasts. Life Sci. 97, 123-128 (2014).
- Wu, C., et al. Simulated microgravity compromises mouse oocyte maturation by disrupting meiotic spindle organization and inducing cytoplasmic blebbing. PLoS One. 6, e22214(2011).
- Dong, J., et al. Growth differentiation factor-9 is required during early ovarian folliculogenesis. Nature. 383, 531-535 (1996).
- Zhang, S., et al. Simulated Microgravity Using a Rotary Culture System Compromises the In Vitro Development of Mouse Preantral Follicles. PLoS One. 11, e0151062(2016).
Reprints and Permissions
Request permission to reuse the text or figures of this JoVE article
Request Permission