Human induced pluripotent stem cells (hiPSCs) are considered a powerful tool for drug and chemical screening and for the development of new in vitro models for toxicity testing, including neurotoxicity. Here, a detailed protocol for the differentiation of hiPSCs into neurons and glia is described.
Method Article
Protocol for the Differentiation of Human Induced Pluripotent Stem Cells into Mixed Cultures of Neurons and Glia for Neurotoxicity Testing
In This Article
Summary
Abstract
Human pluripotent stem cells can differentiate into various cell types that can be applied to human-based in vitro toxicity assays. One major advantage is that the reprogramming of somatic cells to produce human induced pluripotent stem cells (hiPSCs) avoids the ethical and legislative issues related to the use of human embryonic stem cells (hESCs). HiPSCs can be expanded and efficiently differentiated into different types of neuronal and glial cells, serving as test systems for toxicity testing and, in particular, for the assessment of different pathways involved in neurotoxicity. This work describes a protocol for the differentiation of hiPSCs into mixed cultures of neuronal and glial cells. The signaling pathways that are regulated and/or activated by neuronal differentiation are defined. This information is critical to the application of the cell model to the new toxicity testing paradigm, in which chemicals are assessed based on their ability to perturb biological pathways. As a proof of concept, rotenone, an inhibitor of mitochondrial respiratory complex I, was used to assess the activation of the Nrf2 signaling pathway, a key regulator of the antioxidant-response-element-(ARE)-driven cellular defense mechanism against oxidative stress.
Introduction
The US National Research Council report1 envisioned a new toxicity testing paradigm in which regulatory toxicity testing would be shifted from an approach relying on phenotypic changes observed in animals to an approach focusing on mechanistic in vitro assays using human cells. Pluripotent stem cell (PSC) derivatives may represent alternatives to cancer cell models, as the obtained cells may more closely resemble the physiological conditions of human tissues and provide more relevant tools to study chemical-induced adverse effects. The two major types of PSC cultures that are most promising for toxicity testing are human embryonic stem cells (hESCs) and human induced pluripotent stem cells (hiPSCs), which are currently widely used in the areas of basic research and regenerative medicine2,3. This expertise can now be harnessed for the development of a new class of toxicological in vitro tests aimed at identifying the perturbed physiological pathways involved with the development of adverse effects in vivo. However, test methods for regulatory safety assessments based on hESCs would be unlikely to be accepted by all EU Member States and by countries worldwide due to possible ethical concerns and diverse national legislative policies regulating the use of embryo-derived cells.
hiPSCs share characteristics similar to hESCs4,5 and hold great potential for in vitro methods, both for identifying therapeutic targets, as well as for safety assessments. In addition, hiPSC technology mitigates the constraints of a limited donor pool and the ethical concerns associated with embryo-derived cells. A major challenge for hiPSCs is the demonstration that these cells can reproducibly generate a significant range of toxicologically relevant cell derivatives, with characteristics and responses typical of human tissues. Predefined levels of the selected markers are generally used to characterize cell populations after the differentiation process and to provide insights into the stability of the differentiation process.
Previous works evaluated the suitability of hiPSCs to generate mixed cultures of neuronal and glial cells and to assess the effects of rotenone, an inhibitor of mitochondrial respiratory complex I, on the activation of the Nrf2 pathway, a key regulator of anti-oxidant defense mechanisms in many cell types6,7.
This work describes a protocol used for the differentiation of hiPSCs into mixed neuronal and glial cultures, providing details on the signaling pathways (gene and protein level) that are activated upon neuronal/glial differentiation. Additionally, the work shows representative results demonstrating how this hiPSC-derived neuronal and glial cell model can be used to assess Nrf2 signaling activation induced by acute (24-h) treatment with rotenone, allowing for the assessment of oxidative stress induction.
IMR90 fibroblasts were reprogrammed into hiPSCs at I-Stem (France) by the viral transduction of 2 transcription factors (Oct4 and Sox2) using pMIG vectors6. Analogous hiPSC models can also be applied. The protocols described below summarize all the stages of differentiation of hiPSCs into neural stem cells (NSCs) and further into mixed cultures of post-mitotic neurons and glial cells (steps 1 and 2, also see the EURL ECVAM DBALM website for a detailed description of the protocol)8.
An additional protocol for the isolation, expansion, cryopreservation, and further differentiation of NSCs into mixed neurons and glial cells is detailed in steps 3 and 4 (also refer to the EURL ECVAM DBALM website for a detailed description of this protocol)9. Step 5 describes the analyses that can be done to assess the phenotypic identity of the cells during the several stages of commitment and differentiation.
Protocol
1. Human Induced Pluripotent Stem Cell (hiPSC) Expansion
NOTE: hiPSCs can be cultured on a suitable protein mix substrate in the presence of mTeSR1 medium containing mTeSR1 5x supplements (prepared following the manufacturer's instructions; plate ~100 colony fragments/60-mm Petri dish). When the hiPSC colonies reach an appropriate size (see an example of a colony in Figure 2A), passage the cells as described below (once a week).
- Coat dishes with hESC-qualified basement membrane matrix (hereafter called "qualified matrix") or any other suitable protein substrate.
- Store the qualified matrix (see the Table of Materials) at -80 °C in 200-µL aliquots in cold 1.5 mL tubes and cold 5 or 10 mL pipettes.
- Prior to passaging, thaw 200 µL of qualified matrix on ice.
- Dilute 200 µL of qualified matrix in 20 mL of DMEM/F12 medium (1:100 dilution).
- Coat 60-mm Petri dishes with this solution (5 mL/dish).
- Incubate coated dishes at 37 °C for at least 1 h.
- HiPSC colony fragment cryopreservation and thawing
- After cutting the hiPSC colonies (see step 1.3 for the hiPSC colony cutting procedure), gently and slowly resuspend the hiPSC colony fragments in stem cell freezing medium, ~100 fragments/250 µL (see the Table of Materials).
- Aliquot the colony fragments in suitable vials for cryopreservation (250 µL/vial).
- Place the vials in a container filled with 2-propanol and place the container at -80 °C for a minimum of 2 h and up to 2 weeks.
- Transfer the vials into the vapor phase of a liquid nitrogen tank.
- To restart the culture, thaw 1 frozen vial in water bath at 37 °C.
- Gently collect the hiPSC colony fragments in 7 mL of pre-warmed complete hiPSC medium (see the Table of Materials) in a 15 mL tube using a 1, 2, or 5 mL pipette.
- Centrifuge the hiPSC colony fragments at 130 x g for 3 min.
- Remove the supernatant and gently resuspend the hiPSC colony fragments in 1 mL of complete hiPSC medium using a 1, 2, or 5 mL pipette.
- Further dilute the cell suspension in 3 or 4 mL of complete hiPSC medium.
- Plate the hiPSC colony fragments in a qualified matrix-coated 60-mm Petri dish (~100 fragments/dish; coat the dishes as described in step 1.1).
- Incubate the hiPSCs at 37 °C and 5% CO2.
- Perform a total medium change every day.
- Passaging of the hiPSC colonies
NOTE: Undifferentiated hiPSCs should be round in shape, with large nucleoli and without abundant cytoplasm. Undifferentiated colonies should be characterized by a flat and tightly-packed morphology. Only undifferentiated colonies (about 1 mm in diameter) should be cut for further passaging.- Cut the stem cell colonies in squares of about 200 µm x 200 µm using a 1-mL syringe with a 30G needle or any other commercially available tools (see the Table of Materials). Use a stereoscopic microscope at 4x magnification in a laminar flow cabinet at room temperature.
- Detach the colony fragments from the dish surface using a 200-µL pipette by gently pipetting the medium underneath to lift the pieces.
- Transfer the colony fragments (~100 pieces) to a qualified matrix-DMEM/F12-coated plate filled with 4 mL of complete hiPSC medium (see the Table of Materials; coat the dishes as described in step 1.1).
- Incubate the new plate(s) at 37 °C and 5% CO2.
- Perform a total medium change every day and inspect the morphology of the colonies using a phase-contrastmicroscope at 4X and 10X magnifications.
2. HiPSC Differentiation into Mixed Neurons and Glia
NOTE: The procedure takes approximately 28 days to complete, with the main steps outlined in Figure 1 (upper part).

Figure 1: Schematic Representation of the Neuronal Differentiation Protocol. (Upper part) IMR90-hiPSC colonies can be cut into fragments to form embryoid bodies (EBs). After 2 days in vitro (DIV), EBs can be plated onto laminin- or standard matrix-coated dishes and cultured in the presence of neuroepithelial induction (NRI) medium to generate neuroectodermal derivatives (rosettes, here stained for nestin (green) and β-III-tubulin (red)). Rosettes can be dissociated, collected, replated on laminin- or standard matrix-coated dishes, and further differentiated into mature neuronal (NF200, red) and glial (GFAP, green) cells in the presence of neuronal differentiation (ND) medium. (Lower part) rosette-derived NSCs (nestin, red) can be expanded in the presence of neural induction (NI) medium, cryopreserved, or further differentiated in the presence of ND medium to form mixed neuronal (NF200, green) and glial (GFAP, red) cultures. Please click here to view a larger version of this figure.
- Generation of embryoid bodies (EBs) (Days 0 → 1)
NOTE: This procedure requires good manual skills and precision. HiPSC colony fragments should be of equal size to obtain homogenous embryoid bodies (EBs) in the next steps. Morphologically differentiated colonies (with large cytoplasmic fractions and small nucleoli) should be discarded.- Refresh the hiPSC medium (3 mL/60-mm Petri dish) prior to cutting the undifferentiated hiPSC colonies (about 1 mm in diameter, see Figure 2A) under sterile conditions (as described in step 1).
- Cut the undifferentiated colonies (as shown in Figure 2A and Figure 2B) into fragments of approximately 200 µm x 200 µm using a 1-mL syringe with a 30G needle. Use a stereoscopic microscope at 4X magnification in a laminar flow cabinet at room temperature.
- Detach the colony fragments from the dish surface using a 200-µL pipette by gently pipetting medium underneath to lift the pieces.
- Transfer all detached fragments and the medium to a 15-mL tube using a 1, 2, or 5 mL pipette.
- Rinse the dish with 2 mL of complete hiPSC medium to recover all fragments.
- Centrifuge at 112 x g for 1 min.
- Aspirate the supernatant and gently resuspend the fragments in 5 mL of complete hiPSC EB medium (see the Table of Materials).
- Plate the colony fragments in a 60 mm ultra-low attachment Petri dish (5 mL/60-mm Petri dish).
- Incubate the Petri dish overnight at 37 °C and 5% CO2.
- On the next day (Day 1), collect the EBs and their medium in a 15 mL tube using a 1, 2, or 5 mL pipette.
- Centrifuge the EBs at 112 x g for 1 min.
- Carefully aspirate the supernatant and gently resuspend the EBs in 5 mL of complete hiPSC EB medium using a 1, 2, or 5 mL pipette.
- Replate the EBs onto a new 60-mm ultra-low attachment Petri dish (5 mL/60 mm Petri dish).
- Incubate the Petri dish overnight at 37 °C and 5% CO2.
- On Day 1, coat the dishes with basement membrane matrix (e.g., matrigel, referred to hereafter as "standard matrix") or any other suitable protein substrate (e.g., laminin).
- Store the standard matrix (see the Table of Materials) at -80 °C in 200-µL aliquots using cold 1.5 mL tubes and cold 5 or 10 mL pipettes.
- Thaw 200 µL of standard matrix on ice.
- Dilute 200 µL of standard matrix in 20 mL of DMEM/F12 medium (1:100 dilution).
- Coat 60-mm Petri dishes with this solution (5 mL/dish).
- Incubate the coated dishes at 37 °C overnight.
NOTE: These dishes will be used to plate the EBs (about 50 EBs/dish) and generate neuroepithelial aggregates (rosettes); see step 2.3.
- Generation of neuroepithelial aggregates (rosettes) (Days 2 → 7)
- On Day 2, remove the standard matrix coating solution from the 60-mm Petri dishes (no need to rinse the plates) and fill them with 5 mL/dish of complete neuroepithelial induction medium (NRI); see the Table of Materials.
- Transfer the floating EBs (from step 2.1.14) to coated dishes (~50 EBs/dish) using a 200 µL pipette under a stereoscopic microscope at 4x magnification and placed in a laminar flow cabinet.
NOTE: It is critical to select homogenous, medium-sized EBs (~200-300 µm in diameter). Too-small EBs may not survive well during neuroectodermal differentiation, while too-large EBs tend to undergo core necrosis. - Incubate the dishes at 37 °C and 5% CO2.
- The day after (Day 3), check the dishes under the microscope at 10x magnification to ensure that the EBs are all attached.
- Gently perform a total medium change with complete NRI medium.
- Change the NRI medium every other day up to day 7, when neuroepithelial aggregates (rosettes) should be visible.
- On Day 7, coat standard matrix (or laminin), as described in step 2.2, onto any required plate or dish format: 96-well plates (100 µL/well), 24-well plates (250 µL/well), 12-well plates (500 µL/well), MEA chips (for electrical activity, 1 mL/single-well chip), or 60 mm Petri dishes (4 mL/dish).
- Incubate the coated plates/dishes for at least 2 h at 37 °C and 5% CO2.
- Rosette dissociation and neuronal differentiation (Days 8 → 28)
NOTE: This procedure requires good manual skills and precision. To avoid collecting mesodermal and endodermal cells, only ectoderm rosette-like structures should be dissociated and collected.- On Day 8, cut the rosette-like structures into fragments under a stereoscopic microscope at 10X magnification in sterile conditions. Use a 1 mL syringe with a 30G needle. Note that the rosettes tend to easily detach from the dish when touched with the needle.
- Complete the detachment of the rosette fragments using a 200-µL pipette.
- Transfer the dish under the laminar flow hood and collect the rosette fragments and their medium into a 15 mL conical tube using a 1, 2, or 5 mL pipette. Rinse the dish with 2 mL of NRI medium to recover all fragments.
- Spin down the rosette fragments at 112 x g for 2 min.
- Aspirate the supernatant.
- Gently resuspend the pellet in 1 mL of 1x DPBS (without calcium and magnesium) and gently pipette the rosette fragments up and down using a 1,000-µL pipette to partially dissociate them.
- Add 4 mL of complete NRI medium and count the cells using trypan blue and an automated cell counter (see the Table of Materials)
NOTE: Dilute 20 µL of cell suspension in 20 µL of Trypan blue. This step may be omitted if the cells cannot be brought into a single-cell suspension. If the rosette fragments do not look completely dissociated, rosettes fragments derived from about 50 EBs/60-mm dish can be resuspended in 50 mL of complete NRI medium and plated, as indicated in Table 1. - Aspirate the standard matrix (or laminin) coating solution from the Petri dishes, plates, and/or MEA chips (from step 2.3.7). Do not let them dry.
- Plate the cells in complete NRI medium according to the study plan (about 15,000 cells/cm2; see Table 1 for plating volume indications).
- Incubate the plates overnight at 37 °C and 5% CO2.
- On Day 10, perform a total medium change using complete neuronal differentiation medium (ND); see the Table of Materials.
- Refresh the complete ND medium twice a week until Day 28.
- Characterize the neuronal/glial cell derivatives, as described in step 5 (see Table 2 for general acceptance criteria).
3. HiPSC-derived Neural Stem Cell (NSC) Expansion and Differentiation into Mixed Neurons and Glia
NOTE: NSCs derived from rosette fragments can be expanded and maintained following the procedure described below (Figure 1, lower part). This allows for incrementing the number of cells for differentiation and chemical testing.
- Coat a 60 mm Petri dish (or a T-25 flask) with 5 mL of standard matrix DMEM/F12 coating solution and incubate it for at least 2 h at 37 °C and 5% CO2 (as described in step 2.2).
- Spin down the rosette fragments derived from steps 1-2 (see step 2.4.) in a conical 15 mL tube at 112 x g for 2 min.
- Gently resuspend the pellet in 5 mL of neural induction medium (NI); see the Table of Materials.
- Transfer the cells onto a standard matrix-coated 60 mm Petri dish (or T-25 flask).
- Culture rosette-derived NSCs in the presence of NI medium, refreshing the medium every other day until the cells reach confluence.
- When confluent, passage the NSCs as described in the following steps.
NOTE: Passage the NSCs about once a week; consider using freshly coated dishes, flasks, or plates, depending on the study plan. - Remove the complete NI medium and gently rinse the NSCs with DPBS (without calcium and magnesium).
- Add 1.5 mL of 0.05% trypsin-EDTA pre-warmed to 37 °C to the 60-mm Petri dish (or T-25 flask) containing the cells and place it in the incubator for 1 min.
- Gently tap the dish (or flask) to detach the cells.
- Add 1.5 mL of trypsin inhibitor pre-warmed to 37 °C and transfer the cells to a 15-mL tube.
- Rinse the Petri dish (or T-25 flask) with an equal volume of NI medium (1.5 mL) and collect the volume in the same 15-mL tube.
- Centrifuge the cells at 130 x g for 3 min.
- Remove supernatant and gently resuspend the cells in 1 mL of complete NI medium using a 1,000-µL pipette.
- Further dilute the cell suspension in 3 or 4 mL of complete NI medium and count the cells using trypan blue and an automated cell counter.
- Plate the NSCs onto the 60-mm Petri dish (or T-25 flask) from step 3.1 at a density of about 50,000 cells/cm2.
- Perform a total medium change with complete NI medium every other day.
- Characterize the cells for the presence of neuronal/glial cell derivatives, as described in step 5.
NOTE: NSCs can be differentiated into mixed cultures of neurons and glia in complete ND medium (as described in steps 2.4.11-2.4.13), refreshing the complete ND medium twice a week for 21 days.
4. HiPSC-derived NSC Cryopreservation and Thawing
NOTE: Upon passaging, NSCs can be frozen and re-thawed following this procedure.
- Centrifuge passaged NSCs (from step 3.12) at 130 x g for 3 min.
NOTE: The cells should be counted at step 3.14. - Gently and slowly resuspend the NSCs at 3 x 10⁶/mL of freezing medium (see the Table of Materials).
- Aliquot the cells in suitable vials for cryopreservation (about 0.5 mL = 1.5 x 10⁶/vial).
- Place the vials in a container filled with 2-propanol and place the container at -80 °C for a minimum of 2 h and up to 2 weeks.
- Transfer the vials to the vapor phase of a liquid nitrogen tank.
- To restart the cell culture, thaw 1 frozen vial in a water bath at 37 °C.
- Gently collect the cells in 7 mL of pre-warmed complete NI medium in a 15-mL tube using a 1,000-µL pipette.
- Centrifuge the cells at 130 x g for 3 min.
- Remove the supernatant and gently resuspend the cells in 1 mL of complete NI medium using a 1,000-µL pipette.
- Further dilute the cell suspension in 3 or 4 mL of complete NI medium and count the cells using trypan blue and an automated cell counter (note: dilute 20 µL of cell suspension in 20 µL of trypan blue; the viability after thawing should be ≥ 80%).
- Plate the NSCs in a coated 60-mm Petri dish (or T25 flask) at a density of about 50,000 cells/cm2.
5. Characterization of hiPSC-derived Neuronal and Glial Cells
NOTE: Upon differentiation, neuronal and glial derivatives can be characterized using different techniques, such as the ones described in the following sections.
- Quantitative real-time PCR (qPCR) analyses10
- Spin down hiPSC colony fragments, EBs, and/or NSCs at 130 x g for 3 min.
- Resuspend the cell pellet in 100 µL of cold RNA lysis buffer provided in a suitable kit for RNA extraction.
- Alternatively, collect neuronal/glial derivatives directly from the plates by aspirating the medium and adding cold RNA lysis buffer to the wells to collects the cells.
- Isolate the RNA following the manufacturer's instruction.
- Reverse-transcribe 500 ng of the total RNA using a suitable kit for RNA to cDNA retrotranscription.
- Run qPCR reactions in duplicate using appropriate master mix and primer sets (see the Table of Materials).
- Record the fluorescent emission in real-time: 45 cycles with primers annealing at 60 °C.
- Normalize the relative RNA quantities to GAPDH and β-actin as reference genes and use undifferentiated hiPSCs or untreated cells for the calibrating conditions (ΔΔCt method). Alternatively, use another suitable method.
- Immunocytochemistry and high-content imaging (HCI)6,11
- Fix the hiPSC colonies, NSCs, and/or neuronal/glial derivatives with cold 4% paraformaldehyde for 15 min at room temperature.
- Gently wash the cells in 1X PBS and store the plates at 4 °C for up to 1 month.
- When ready for staining, permeabilize the cells in permeabilization buffer (1x DPBS containing 0.1% triton-X-100 and 3% BSA) for 15 min at room temperature.
- Remove the permeabilization buffer and incubate the cells in blocking buffer (3% BSA/1X DPBS) for 15 min at room temperature to prevent the nonspecific binding of antibodies.
- Remove the blocking buffer and incubate the cells overnight at 4 °C in blocking buffer containing suitable primary antibodies (see the Table of Materials).
- Wash the cells 3 times with 1x PBS.
- Incubate the cells for 45 min at room temperature in blocking buffer containing fluorochrome-conjugated secondary antibodies (see the Table of Materials), counterstaining the nuclei with DAPI dye.
- Quantify the mean fluorescence intensity and the relative percentages of cell types using a suitable high-content imaging platform, if available (see the Table of Materials).
NOTES: To determine the intensity level of the fluorescent background, incubate some cells/wells with secondary antibodies alone. The flow cytometric analysis of live (not fixed), undifferentiated hiPSCs can be performed to assess the expression of PSC-specific markers, such as SSEA4 (see the Table of Materials). Undifferentiated hiPSC colonies can be analyzed for alkaline phosphatase activity using commercially available BCIP/NBT kits, following the manufacturers' instructions (see the Table of Materials). Additionally, reverse phase protein array (RPPA) assays and analyses may be performed, as described in Reference 12 (for a list of tested antibodies, see the Table of Materials).
- Electrophysiological measurements13
- Plate the dissociated rosette fragments (after 7 DIV) or NSCs derived from rosettes on coated multielectrode arrays (MEAs; see the Table of Materials) in complete ND medium (~1 x 10⁵ cells/single-well MEA chip).
- Differentiate the cells for 3 weeks in complete ND medium, refreshing the medium twice a week.
- At the end of differentiation, seal the MEA chips with a semi-permeable membrane under a laminar flow hood to keep the cultures sterile for repeated measurements.
- Replace one of the electrodes with one ground reference, allowing for recordings from the remaining electrodes.
- Record the mean firing rate (MFR; number of spikes/min) using an MEA amplifier with the integrated temperature process control adjusted to 37 °C and 5% CO2.
- Detect peaks from the MEA raw data using threshold limit of -4.7σ (σ represents the standard deviation of the basal noise).
- Process the post-recording data with a suitable software.
Results
Characterization of undifferentiated hiPSCs
To assess the phenotype of the hiPSCs, the analysis of colony/cell morphology, the determination of PSC-specific markers, and the examination of gene expression and alkaline phosphate activity should be performed. Undifferentiated hiPSCs should be round, with large nucleoli and without abundant cytoplasm. The majority of the colonies should be characterized by a flat and tightly-packed morphology, indicative of an undifferentiated phenotype (Figure 2A and Figure 2B). Additionally, more than 80% of the colonies should be positive for alkaline phosphatase activity staining (Figure 2C).
About 80% of the cells should be positive for classic pluripotency-related markers, such as Oct4, SSEA3, SSEA4, and Tra1-60 (Figure 2D-H), as shown by immunocytochemistry and flow cytometry, whilst percentages of nestin+ and β-III-Tubulin+ cells should be significantly low (about 8% and 3%, respectively, as shown in Figure 2H). These results should be reproducible over passages.

Figure 2. Characterization of Undifferentiated IMR90-hiPSCs. (A and B) Representative phase-contrast images (10X and 20X magnifications) of undifferentiated IMR90-hiPSC colonies. (C) representative images of alkaline phosphatase-stained colonies (4X magnification). (D-F) Representative immunocytochemical images of (D) Oct4 (red), (E) SSEA3 (green), and (F) Tra1-60 (green). (G) Representative dot plot of SSEA1 (CD15) and SSEA4 staining, analyzed by flow cytometry. (H) The bar graph shows the percentages of Oct4+ (~75 - 80%), Tra1-60+ (~75 - 80%), SSEA3+ (~75 - 80%), nestin+ (~10 - 15%), and β-III-tubulin+ (~3 - 7%) cells, counterstained with DAPI and quantified by HCI, with a mean of 3 to 5 biological replicates ± the S.E.M. (graph modified from Reference 6). Please click here to view a larger version of this figure.
Assessment of pluripotency via EB formation
HiPSCs are pluripotent, meaning that they express three germ layer-related genes under appropriate conditions. To assess hiPSC pluripotency, it is possible to apply a common approach based on spontaneous EB formation, which induces the formation of the three germ layers14. Analyses of germ layer-specific genes must indicate a time-dependent increase of endoderm (α-fetoprotein (AFP) and Cytokeratin 18 (KRT18)), ectoderm (Nestin, SRY-box 1 (Sox1), and paired box 6 (Pax6)), and mesoderm (natriuretic peptide A (NPPA) and Brachyury-T) -related gene expression (Figure 3A and Figure 3B); see the Table of Materials.

Figure 3. Assessment of Pluripotency by EB formation. (A) Representative phase-contrast image of EBs at day 1. (B) The bar graph shows qPCR analyses of mesodermal (NPPA and brachyury), ectodermal (Pax6, Sox1, and nestin), and endodermal (AFP and KRT18) genes, normalized to the reference genes, β-actin and GAPDH, and calibrated to undifferentiated cells (Day 0). This is the ΔΔCt method, with a mean of 5 independent analyses ± the S.E.M. * p < 0,05, ** p < 0.01, *** p < 0.001; graph modified from Reference 6. Please click here to view a larger version of this figure.
Induction of neuronal and glial differentiation
IMR90-iPSCs can be differentiated into mixed cultures of post-mitotic neurons and glial cells following the steps summarized in Figure 1 and in the protocol sections. 5-8 days after plating the EBs onto standard matrix- or laminin-coated dishes in the presence of complete NRI medium, rosette-like structures should start becoming visible (Figure 4A). Rosettes are characterized by the presence of nestin+ cells (neuronal precursors, ~90%), with few β-III-tubulin+ cells (committed neuronal cells, ~5 - 10%), the latter generally localized mainly at the periphery of the rosettes (Figure 4B, rosettes on Day 12).
Upon rosette dissociation and replating onto laminin- or standard matrix-coated dishes or plates in the presence of complete ND medium, cells start undergoing differentiation into mixed cultures of neurons and glia, progressively forming clusters of neuronal cell bodies connected by bundles of neurites (Figure 4C and Figure 4D). Similar results should be obtained when analyzing neuronal populations obtained by expanding rosette-derived NSCs and differentiating them into neurons and glia. NSCs expanded from rosettes should be nestin+ (Figure 4E, inset showing nestin+ cells).
After 21 days of differentiation, the cells should be positive for β-III-tubulin; NF200; Tau; and MAP2, the late marker of dendrites (Figure 4D, 4F, and Figure 4H), with at least 10 - 15% of the cells positive for the glial fibrillary acidic protein (GFAP), an astroglial marker (Figure 4G and Figure 4H). Moreover, ~20 - 30% of the cells should retain the expression of nestin after differentiation (Figure 4H). It is important to consider that the percentage of each cell type (i.e., neuron, astrocyte, nestin+ cells) may vary over passages, and user-dependent variability may be observed.
By analyzing specific neuronal subpopulations, GABAergic neurons represent ~15 - 20% of the total cells, dopaminergic neurons ~13 - 20%, and glutamatergic neurons ~35 - 42%, as shown by immunostaining for gamma-aminobutyric acid (GABA), tyrosine hydroxylase (TH), and vesicular glutamate transporter 1 (VGlut1), respectively (see the representative quantification in Figure 4H). The induction of differentiation can also be assessed by the analysis of pluripotency-related markers (e.g., Oct4, Tra1-60, and SSEA3), which should be significantly downregulated in differentiated cells versus undifferentiated hiPSCs (not shown, see Reference 6). This can also be confirmed through the analysis of gene expression by qPCR, which should indicate a decrease of Oct4 and Nanog and the upregulation of neuronal genes, such as neural cell adhesion molecule 1 (NCAM1) and microtubule-associated protein 2 (MAP2); the presynaptic gene, synaptophysin (SYP); and the post-synaptic gene, microtubule-associated protein tau (MAPT), as shown in Figure 4I. Furthermore, dopaminergic (TH and NR4A1), noradrenergic (PHOX2A and PHOX2B), glutamatergic (NARG2, GRIA1 and GAP43), GABAergic (GABRA1 and GABRA3), motor neurons (ISL1 and LHX3), and cholinergic (SLC5A7 and SLC18A13) -related genes result in upregulated neuronal cells compared to undifferentiated cells (Figure 4J).
The analysis of spontaneous electrical activity, by means of MEA, is a valuable readout to assess the functionality of the neuronal network in differentiated hiPSCs. At the end of the differentiation period, neuronal derivatives are generally characterized by a mean firing rate (MFR) of at least 60 spikes/min (see the representative raster plot in Figure 4K). However, bursts are not observed.
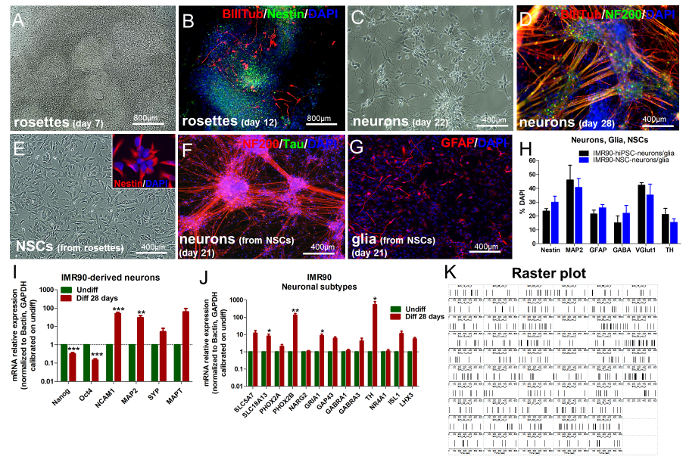
Figure 4. Differentiation of IMR90-hiPSCs into Mixed Cultures of Neurons and Glia. (A and B) Representative images of rosettes after 7 DIV (A) and after 12 DIV (B), stained for nestin (green) and β-III-tubulin (red)). (C and D) Representative images of differentiated cells after 22 DIV (C) and 28 DIV (D), stained for β-III-tubulin (red) and NF200 (green)). (E) Representative image of NSCs derived from rosette dissociation and expansion (inset shows nestin+ cells, red). (F and G) Representative images of neuronal cells (F, stained for NF200 (red) and Tau (green)) and glial cells (G, stained for GFAP (red)) differentiated from NSCs (after 21 DIV). (H) Quantification of nestin, MAP2, GFAP, gamma-aminobutyric acid (GABA), vesicular glutamate transporter 1 (VGlut1), and tyrosine hydroxylase (TH) -positive cells by HCI, comparing IMR90-hiPSC-derivatives and cells differentiated from IMR90-hiPSC-derived NSCs (graph modified from Reference 7). (I and J) Bar graphs showing qPCR analyses of pluripotency genes (Oct4 and Nanog) and neuronal genes (NCAM1, MAP2, SYP, and MAPT) (I) and of dopaminergic (TH and NR4A1), noradrenergic (PHOX2A and PHOX2B), glutamatergic (NARG2, GRIA1, and GAP43), GABAergic (GABRA1 and GABRA3), motor neuron (ISL1 and LHX3), and cholinergic (SLC5A7 and SLC18A13) -related genes (J). All analyses were normalized to the reference genes, β-actin and GAPDH, and calibrated to undifferentiated cells (green bars). This is the ΔΔCt method, with a mean of 5 independent analyses ± the S.E.M. * p < 0,05, ** p < 0.01, *** p < 0.001. The graphs in I and J were modified from Reference 6. (K) Representative raster plot of IMR90-NSC-derived neurons (the recording was carried out for a minimum of 600 s; the vertical bars represent single spikes). Please click here to view a larger version of this figure.
A specific signature of neuronal markers is upregulated in differentiated IMR90-hiPSCs
In the new toxicity testing paradigm, it is essential to define the molecular and cellular events occurring within a cell following exposure to a given toxicant. Therefore, it is relevant to characterize which signaling pathways are activated and/or upregulated within the cellular model under investigation.
Commercially available arrays for the analyses of protein kinase gene expression can be used to compare undifferentiated hiPSCs versus differentiated cells. Differentiated IMR90-hiPSCs undergo the upregulation of genes involved in the control of neurotrophin receptors, axon guidance regulation, neurite outgrowth modulation, glial-derived neurotrophic factor (GDNF) receptors, bone morphogenetic protein (BMP)/TGF-beta pathway, and platelet-derived growth factor (PDGF) receptors (Figure 5A and Figure 5B).
The analysis of RPPA shows the upregulation of a specific neuronal signature in differentiated IMR90-hiPSCs. In particular, Erk/CREB, Akt/PDK1/mTOR, and Notch1 signaling pathways are activated upon differentiation (Figure 5C).

Figure 5. Differentiated Neuronal and Glial Cells Exhibit the Activation of Neuron-related Pathways. (A and B) Bar graphs report the qPCR analyses of neuron-related kinases (A) and other kinase-related genes (B). Gene expression data were normalized to the reference genes 18S and GAPDH (provided in the array) and calibrated to undifferentiated cells. For these analyses, a gene was considered significantly upregulated when its expression was at least 2x higher than in undifferentiated cells (2-ΔΔCt≥ 2); mean of 3 independent analyses ± the S.E.M.). (C) The bar graph shows the absolute protein quantifications by means of RPPA analysis, comparing differentiated (red bars) and undifferentiated cells (green bars). The proteins belonging to the same signaling pathway cascades are clustered together as follows: CREB/Erk/Akt, PDK1/mTOR/Erk/Akt, Notch1, Shh and Wnt, SAPK/JNK, and BMP/SMAD. Mean ± the S.E.M. of 4 independent analyses. * p < 0,05, ** p < 0.01, *** p < 0.001; graph modified from Reference 6. Please click here to view a larger version of this figure.
IMR90-hiPSC-derived neuronal/glial cultures can be used to assess the effects of rotenone
Rotenone, an inhibitor of complex I of the mitochondrial respiratory chain, is known to cause oxidative stress by triggering the activation of the Nrf2 pathway. Under quiescent conditions, Nrf2 is anchored in the cytoplasm by Keap1 (Kelch-like ECH-associated protein 1), an Nrf2 repressor, which facilitates Nrf2 ubiquitination and proteolysis15. Upon the induction of oxidative stress, Nrf2 translocates into the nucleus and activates the expression of Nrf2-ARE target genes16.
IMR90-hiPSC-derived neurons and glial cells can be used to assess the effects of rotenone on Nrf2 activation by exposing the cells to different concentrations of rotenone (e.g., 1, 10, and 100 nM) for 24 h. These concentrations were established according to previous studies17,18.
At these concentrations and times of exposure, rotenone did not result in cytotoxicity, as shown by the quantification of live DAPI+ cell nuclei (Figure 6A). Rotenone induced Nrf2 nuclear translocation, especially after exposing the cells to 100 nM rotenone (Figure 6B and Figure 6E). At the same concentration, a significant decrease in cytoplasmic Keap1 was observed (Figure 6C), together with an increase in both NAD(P)H quinone oxidoreductase 1 (NQO1) and Sulfiredoxin 1 (SRXN1), two Nrf2-target enzymes19,20 (Figure 6D).

Figure 6. Effects of Rotenone on Nrf2 Nuclear Translocation, Keap1, SRXN1, and NQO1 protein levels. (A) Quantification of live DAPI+ cells (i.e., non-pyknotic nuclei) upon 24 h treatment with 1, 10, 100 nM rotenone and normalized to untreated cells (Control, Ctr). (B) Nrf2 protein nuclear translocation (i.e., nuclear/cytoplasmic ratios) after 24 h of exposure to rotenone, assessed by measurements of fluorescence intensity using HCI analysis. (C) Quantification of cytoplasmic Keap1 protein levels upon rotenone treatment, assessed by HCI analysis. (D) Quantification of NAD(P)H quinone oxidoreductase 1 (NQO1) and Sulfiredoxin 1 (SRXN1) by means of immunofluorescence and HCI after 24 h of treatment with rotenone. (E) Representative images of Nrf2 protein localization (green). All values are shown as the mean ± S.E.M. of 3 biological replicates. * p < 0,05, ** p < 0.01; figure modified from Reference 7. Please click here to view a larger version of this figure.
At these concentrations and times of treatment, rotenone also elicited a concentration-dependent increase of astroglial (GFAP+) cell percentage (Figure 7A and Figure 7B), without affecting the proportions of NSCs (nestin+) and neurons (MAP2+) (Figure 7B). By looking at the proportions of specific neuronal subtypes, rotenone treatment (10 nM and 100 nM) significantly decreased the number of dopaminergic neurons (TH+) (Figure 7C and D), whilst the percentages of GABAergic (GABA+) and glutamatergic (VGlut1+) neurons did not change (Figure 7D). Analogously, previous in vivo and in vitro studies have described a rotenone-dependent and selective dopaminergic neuronal cell death21,22,23.

Figure 7. Effects of Rotenone on Glial Cells and Dopaminergic Neurons. (A) Representative pictures of GFAP+ cells (red), with 40X magnification in the insets, untreated or treated with 100 nM rotenone for 24 h. (B) Quantification of nestin+, MAP2+, and GFAP+ cells, normalized to untreated cells (control, Ctr). (C) Representative pictures of dopaminergic TH+ neurons (green), with 40X magnification in the insets, untreated or treated with 100 nM rotenone for 24 h. (D) Quantification of GABA+, VGlut1+, and TH+ neuronal cells, normalized to untreated cells (Ctr). All values are shown as the mean ± S.E.M. of 3 biological replicates. * p < 0,05, ** p < 0.01, *** p < 0.001; figure modified from Reference 7. Please click here to view a larger version of this figure.
Statistical significance was assessed by one-way ANOVA with Dunnett's Multiple Comparison Test as a post-test (comparing all columns versus the control column)24 or by two-tailed unpaired or paired t-test according to the type of analysis. All data represent the average of at least three biological replicates ± the standard error of the mean (S.E.M.). An asterisk over a bar indicates a significant difference with the control group. * p < 0.05, ** p < 0.01, *** p < 0.001.
Table 1.
Note on dissociated rosette plating density: if rosette fragments do not look completely dissociated, in order to reach a cell plating density of about 15.000 cells/cm2, dissociated rosettes fragments deriving from about 50 EBs/1 x 60mm-dish can be resuspended in 50 mL of complete NRI medium and plated as follows (depending on the plate format):
| Multiwell plates / MEA | Growth area (cm2/well) | Volume of cell suspension to plate per well (or MEA chip) | Maximum number of plates that can be plated (with 50 ml of cell suspension) |
| 96 wells | 0.3 | 100 ul | 5 |
| 48 wells | 0.7 | 220 ul | 4 |
| 24 wells | 2 | 625 ul | 3 |
| 12 wells | 4 | 1.25 ml | 3 |
| 6 wells | 10 | 3.125 ml | 2 |
| Single well MEA chip | 3.5 | 1.1 ml | 45 |
Table 2: Acceptance Criteria
| Marker / Antibody | Percentage (on DAPI+ (live) cells) after 28 DIV |
| B-III-tubulin (Tuj1) | 35-45% |
| MAP2 | 50-60% |
| NF200 | 45-55% |
| GFAP | 10-25% |
| Nestin | 15-25% |
Discussion
This work describes a robust and relatively rapid protocol for the differentiation of IMR90-hiPSCs into post-mitotic neurons and glial cells. Previously published neuronal differentiation protocols based on hESCs and hiPSCs usually yield high percentages of neural precursors25,26 and a significant number of neuronal target cells27,28,29,30,31,32,33. Analogously, the differentiation protocol described here is suitable to generate heterogeneous cultures of GABAergic, glutamatergic, and dopaminergic neuronal cells, together with glia and a discrete proportion of nestin+ cells. The presence of glutamatergic (~35-42%) and GABAergic (~15-20%) neural cells suggests that this culture possesses forebrain, cortical-like features, and the presence of a discrete number of dopaminergic neurons (~13-20%) may also indicate midbrain specificity. Additionally, the permanence of a modest proportion of nestin+ cells may prove suitable for the study of neurogenesis and the possible effects of chemicals on NSCs, which are primarily confined to both the hippocampus and the subventricular zone (SVZ) of the forebrain34. Further immunocytochemical and gene expression analyses would help to better define the regional specificity of the differentiated cell derivatives.
The two most critical steps in the differentiation protocol described in this document are: (i) the cutting of hiPSC colonies into homogenous fragments (which is critical for the generation of EBs with homogenous sizes) and (ii) the cutting of neuroectodermal structures (rosettes) for NSC differentiation, which requires significant manual skill and precision to avoid collecting mesodermal and endodermal cells that may reduce the proportions of neurons and glial cells obtained upon differentiation.
It is crucial to characterize the phenotypes of the cells during expansion (as undifferentiated colonies or NSCs) and during all differentiation steps. In particular, the gene and protein expression profiles of the neuronal/glial cell derivatives should show upregulation and activation of neuron-related signaling pathways, whereas the expression of pluripotency markers should be decreased.
The generation of EBs and neuroectodermal derivatives (rosettes) can be manually challenging and prone to variability. For this reason, we developed a protocol for the expansion of rosette-derived NSCs and their further differentiation into neuronal/glial cells.
Possible limitations of this differentiation protocol are mainly (i) the relatively low percentage of differentiated glial derivatives and (ii) the lack of mature neuronal network functions (as shown by the lack of bursts). Moreover, specific subpopulations of astrocytes can function as primary progenitors or NSCs35. While nestin/GFAP double-positive cells were not observed in this differentiated cell culture (data not shown), it is hypothesized that the GFAP+ cells in these mixed cultures are astrocytic progenitors and astrocytes. It is plausible that by extending the time of differentiation, the number of astrocytes may increase, and their morphology may become more mature, as already indicated by previous works from Zhang's group36,37.
In the new toxicity testing paradigm, knowledge on chemical-induced perturbations of biological pathways is of the utmost importance when assessing chemical adversity. Therefore, in vitro test systems should be able to relate adverse effects to disturbances of signaling pathways, according to the concept of the adverse outcome pathway (AOP). As a proof-of-concept, rotenone can be used to assess the activation of the Nrf2 pathway, which is involved in the cellular defense against oxidative or electrophilic stress38, and oxidative stress is an important and common key event in various AOPs relevant to developmental and adult neurotoxicity39.
Rotenone should elicit the activation of the Nrf2 pathway, which can be demonstrated by Nrf2 protein nuclear translocation and increased expression of Nrf2-target enzymes, including NQO1 and SRXN1. It has been found that rotenone induces a dose-dependent increase of GFAP protein levels, indicative of astrocyte activation40,41. Rotenone also decreases the number of dopaminergic (TH+) cells, which is in agreement with previous in vitro and in vivo studies showing rotenone-dependent dopaminergic cell death, since this type of neuron is particularly sensitive to oxidative stress21,22,23.
In conclusion, this hiPSC-derived neuronal and glial cell culture model is a valuable tool to assess the neurotoxic effects of chemicals that elicit oxidative stress resulting in Nrf2 pathway activation. As this differentiation protocol allows for the generation of mixed cultures of neuronal cells (GABAergic, dopaminergic, and glutamatergic neurons) and astrocytes, it may prove suitable for studying the crosstalk between neurons and glia in physiological and pathological conditions, such as in neurodegenerative diseases (e.g., Parkinson's disease). Moreover, the presence of a significant proportion of NSCs may help to assess the possible effects of chemicals on neural progenitors, which are known to be the main target of chemically-induced mutations or viral infections42.
Disclosures
The authors have nothing to disclose.
Acknowledgements
The authors would like to thank Dr. Marc Peschanski (I-Stem, Évry, France), for providing the IMR90-hiPSCs; Dr. Giovanna Lazzari and Dr. Silvia Colleoni (Avantea srl, Cremona, Italy); Dr. Simone Haupt (University of Bonn, Germany); Dr. Tiziana Santini (Italian Institute of Technology, Rome), for providing advice on immunofluorescence staining evaluation; Dr. Benedetta Accordi, Dr. Elena Rampazzo, and Dr. Luca Persano (University of Padua, Italy), for their contributions to the RPPA analysis and antibody validation. Funding: this work was supported by the EU-funded project "SCR&Tox" (Grant Agreement N°. 266753).
Materials
| Name | Company | Catalog Number | Comments |
|---|---|---|---|
| Complete hiPSC medium: | |||
| mTeSR1 Basal Medium | Stem Cell Technologies | 05851 | (Step 1.2.6). Complete mTeSR1 is stable when stored at 2 - 8 °C for up to 2 weeks. 5x Supplements can be dispensed into working aliquots and stored at -20 °C. Use frozen aliquots within 3 months. |
| mTeSR1 5x Supplements | Stem Cell Technologies | 05852 | |
| Matrigel hESC-qualified Matrix | Corning | 354277 | 1:100 (Step 1.1). Thaw Matrigel on ice, prepare 200 μL aliquots and store them in -80 °C. For coating, dilute 200 μL aliquot in 20 mL of DMEM/F12 medium. |
| CryoStem Freezing Medium | Stemgent | 01-0013-50 | Freeze ~ 100 fragments/250 μL/vial (Step 1.2.1) |
| Name | Company | Catalog Number | Comments |
| hiPSC EB medium: | |||
| Knockout DMEM | Thermo-Fisher | 10829-018 | (Step 2.1.7) |
| Knockout Serum Replacement (KOSR) | Thermo-Fisher | 10828-028 | 20% final concentration (Step 2.1.7) |
| Non-Essential Amino Acids | Thermo-Fisher | 11140-035 | (Step 2.1.7) |
| Penicillin/Streptomycin | Thermo-Fisher | 15140-122 | 50 U/mL final concentration (Step 2.1.7) |
| L-Glutamine 200 mM Solution | Thermo-Fisher | 25030-081 | 2 mM final concentration (Step 2.1.7) |
| β-Mercaptoethanol | Thermo-Fisher | 31350-010 | 50 µM final concentration (Step 2.1.7) |
| Name | Company | Catalog Number | Comments |
| Complete neuroepithelial induction medium (NRI): | |||
| DMEM/F12 | Thermo-Fisher | 3133-038 | (Step 2.3.1) |
| Non-Essential Amino Acids | Thermo-Fisher | 11140-035 | (Step 2.3.1) |
| N2 Supplement | Thermo-Fisher | 17502-048 | (Step 2.3.1) |
| Penicillin/Streptomycin | Thermo-Fisher | 15140-122 | 50 U/mL final concentration (Step 2.3.1) |
| Heparin Grade I-A, ≥180 USP units/mg | Sigma-Aldrich | H3149-100KU | 2 µg/mL final concentration (Step 2.3.1) |
| bFGF | Thermo-Fisher | 13256-029 | 20 ng/mL final concentration added before use (Step 2.3.1) |
| Matrigel Basement Membrane Matrix | Corning | 354234 | 1:100 (Step 2.2). Thaw Matrigel on ice, prepare 200 μL aliquots and store them in -80 °C. For coating, dilute 200 μL aliquot in 20 mL of cold DMEM/F12 medium. |
| Laminin | Sigma-Aldrich | L2020 | 1:100 (Step 2.2). Dilute in PBS 1x. |
| Name | Company | Catalog Number | Comments |
| Complete Neuronal Differentiation medium (ND): | |||
| Neurobasal Medium | Thermo-Fisher | 21103049 | (Step 2.4.11) |
| B-27 Supplements (50x) | Thermo-Fisher | 17504044 | (Step 2.4.11) |
| N2 Supplement | Thermo-Fisher | 17502-048 | (Step 2.4.11) |
| Penicillin/Streptomycin | Thermo-Fisher | 15140-122 | 50 U/mL final concentration (Step 2.4.11) |
| GDNF | Thermo-Fisher | PHC7045 | 1 ng/mL final concentration. Added before use. (Step 2.4.11) |
| BDNF | Thermo-Fisher | PHC7074 | 2.5 ng/mL final concentration. Added before use. (Step 2.4.11) |
| Name | Company | Catalog Number | Comments |
| Neural induction medium (NI): | |||
| DMEM/F12 | Thermo-Fisher | 3133-038 | (Step 3.3) |
| Non-Essential Amino Acids | Thermo-Fisher | 11140-035 | (Step 3.3) |
| N2 Supplement | Thermo-Fisher | 17502-048 | (Step 3.3) |
| Penicillin/Streptomycin | Thermo-Fisher | 15140-122 | 50 U/mL final concentration (Step 3.3) |
| Heparin Grade I-A, ≥180 USP units/mg | Sigma-Aldrich | H3149-100KU | 2 µg/mL final concentration (Step 3.3) |
| B-27 Supplement (50x), minus vitamin A | Thermo-Fisher | 12587010 | (Step 3.3) |
| L-Glutamine 200 mM Solution | Thermo-Fisher | 25030-081 | 2 mM final concentration (Step 3.3) |
| bFGF | Thermo-Fisher | 13256-029 | 10 ng/mL final concentration. Added before use (Step 3.3) |
| EGF | Thermo-Fisher | PHG6045 | 10 ng/mL final concentration. Added before use (Step 3.3) |
| BDNF | Thermo-Fisher | PHC7074 | 2.5 ng/mL final concentration. Added before use (Step 3.3) |
| Defined Trypsin Inhibitor (DTI) | Thermo-Fisher | R007-100 | Pre-warm at 37 °C. Add an equal amount of DTI to Trypsin-EDTA (Step 3.10) |
| Trypsin-EDTA (0.5%), no phenol red | Thermo-Fisher | 15400054 | 1:10. Dilute Trypsin-EDTA in PBS 1x (without calcium and magnesium), pre-warm the solution at 37 °C (Step 3.8) |
| CryoStor cell cryopreservation medium | Sigma-Aldrich | C2874-100ML | (Step 4.2) |
| Trypan Blue (0.4%) | Sigma-Aldrich | T8154-100ML | multiple manufacturers/suppliers |
| Name | Company | Catalog Number | Comments |
| TaqMan Probesets and reagents for gene expression analysis: | |||
| RNAqueous-Micro kit | Thermo-Fisher | AM1931 | (Step 5.1.6) |
| High Capacity cDNA Reverse Transcription Kits | Thermo-Fisher | 4368814 | |
| TaqMan Gene Expression Master Mix | Thermo-Fisher | 4369016 | |
| GFAP | Thermo-Fisher | Hs00909233_m1 | |
| MAP2 | Thermo-Fisher | Hs00258900_m1 | |
| NQO1 | Thermo-Fisher | Hs02512143_s1 | |
| SRXN1 | Thermo-Fisher | Hs00607800_m1 | |
| HMOX1 | Thermo-Fisher | Hs01110250_m1 | |
| GSR | Thermo-Fisher | Hs00167317_m1 | |
| PAX6 | Thermo-Fisher | Hs01088112_m1 | |
| NES | Thermo-Fisher | Hs00707120_s1 | |
| GRIA1 | Thermo-Fisher | Hs00181348_m1 | |
| GAP43 | Thermo-Fisher | Hs00967138_m1 | |
| GABRA3 | Thermo-Fisher | Hs00968132_m1 | |
| GABRA1 | Thermo-Fisher | Hs00168058_m1 | |
| NR4A2 | Thermo-Fisher | Hs00428691_m1 | |
| TH | Thermo-Fisher | Hs00165941_m1 | |
| GAPDH | Thermo-Fisher | Hs02758991_g1 | |
| ACTB | Thermo-Fisher | Hs99999903_m1 | |
| MAPT | Thermo-Fisher | Hs00902194_m1 | |
| SYP | Thermo-Fisher | Hs00300531_m1 | |
| NANOG | Thermo-Fisher | Hs04260366_g1 | |
| POU5F1 (OCT4) | Thermo-Fisher | Hs04195369_s1 | |
| SOX1 | Thermo-Fisher | Hs01057642_s1 | |
| AFP | Thermo-Fisher | Hs00173490_m1 | |
| KRT18 | Thermo-Fisher | Hs01941416_g1 | |
| NPPA | Thermo-Fisher | Hs00383230_g1 | |
| T | Thermo-Fisher | Hs00610080_m1 | |
| NCAM1 | Thermo-Fisher | Hs00941821_m1 | |
| NR4A1 | Thermo-Fisher | Hs00374226_m1 | |
| PHOX2A | Thermo-Fisher | Hs00605931_mH | |
| PHOX2B | Thermo-Fisher | Hs00243679_m1 | |
| NARG2 | Thermo-Fisher | Hs00973298_g1 | |
| SLC18A3 | Thermo-Fisher | Hs00268179_s1 | |
| SLC5A7 | Thermo-Fisher | Hs00222367_m1 | |
| ISL1 | Thermo-Fisher | Hs00158126_m1 | |
| LHX3 | Thermo-Fisher | Hs01033412_m1 | |
| TaqMan Human Protein Kinase Array | Thermo-Fisher | 4418721 | |
| Name | Company | Catalog Number | Comments |
| Antibodies and reagents for immunostaining: | |||
| B-III-tubulin (Tuj1) | Covance | MMS-435P | 1:500 (Step 5.2.5). Other antibodies may also be used. |
| MAP2 | Sigma Aldrich | M4403 | 1:500 |
| NF200 | Sigma Aldrich | N4142 | 1:1000 |
| GFAP | Acris Antibodies GmbH | AP02002SU-N | 1:500 |
| Nestin | Sigma-Aldrich | N5413 | 1:200 |
| synaptophysin (SYN) | Abcam | AB14692 | 1:200 |
| Tau | Thermo-Fisher | MA5-12808 | 1:100 |
| Nrf2 | Abcam | AB62352 | 1:200 |
| Keap1 | Abcam | AB66620 | 1:200 |
| sulfiredoxin1 (SRXN1) | Abcam | AB92298 | 1:200 |
| NAD(P)H quinone oxidoreductase 1 (NQO1) | Abcam | AB2346 | 1:200 |
| OCT4 | Millipore | MAB4401 | 1:100 |
| SSEA3 | Millipore | MAB4303 | 1:100 |
| Tra1-60 | Millipore | MAB4360 | 1:250 |
| Tyrosine hydroxylase (TH) | Millipore | AB152 | 1:200 |
| Gamma-aminobutyric acid (GABA) | Sigma-Aldrich | A0310 | 1:100 |
| Vesicular glutamate transporter 1 (VGlut1) | Abcam | AB72311 | 1:500 |
| Paraformaldehyde | Sigma-Aldrich | P6148-500G | 4% (4% formaldehyde can also be used) |
| DPBS, no calcium, no magnesium | Thermo-Fisher | 14190144 | |
| Triton-X-100 Solution | Sigma-Aldrich | 93443-100ML | 0.1% |
| BSA 35% | Sigma-Aldrich | A7979-50ML | 3.5% |
| Donkey anti-Rabbit IgG (H+L) Cross Adsorbed Secondary Antibody, DyLight 594 conjugate | Thermo-Fisher | SA5-10040 | 1:500. (Step 5.2.7) Other fluorochrome-conjugated secondary antibodies may also be used. In this case, appropriate dilutions should be tested by the enduser. |
| Donkey anti-Mouse IgG (H+L) Cross Adsorbed Secondary Antibody, DyLight 488 conjugate | Thermo-Fisher | SA5-10166 | 1:500 |
| Donkey anti-Goat IgG (H+L) Cross Adsorbed Secondary Antibody, DyLight 488 conjugate | Thermo-Fisher | SA5-10086 | 1:500 |
| DAPI Solution (1 mg/mL) | Thermo-Fisher | 62248 | 1:1000 (Step 5.2.7) |
| Name | Company | Catalog Number | Comments |
| Antibodies for Reverse Phase Protein Array (RPPA): | |||
| 4E-BP1 (S65) | Abcam | AB81297 | 1:250 (Note after step 5.2.8) |
| Akt (T308) | Cell Signaling | 9275 | 1:100 |
| Akt (S473) | Cell Signaling | 9271 | 1:100 |
| AMPKalpha (T172) | Cell Signaling | 2531 | 1:100 |
| AMPKbeta1 (S108) | Cell Signaling | 4181 | 1:100 |
| ATF-2 (T71) | Cell Signaling | 9221 | 1:100 |
| c-Jun (S63) | Cell Signaling | 9261 | 1:200 |
| c-Jun (S73) | Cell Signaling | 9164 | 1:200 |
| c-Kit (Y719) | Cell Signaling | 3391 | 1:250 |
| CREB (S133) | Cell Signaling | 9191 | 1:100 |
| EGFR (Y1068) | Cell Signaling | 2234 | 1:50 |
| ErbB2/HER2 (Y1248) | Cell Signaling | 2247 | 1:100 |
| ERK 1/2, p44/42 (T202/Y204) | Cell Signaling | 9101 | 1:2000 |
| GSK-3alpha (S21) | Cell Signaling | 9337 | 1:50 |
| Jak1 (Y1022/1023) | Cell Signaling | 3331 | 1:100 |
| Lck (Y505) | Cell Signaling | 2751 | 1:500 |
| LKB1 (S428) | Cell Signaling | 3051 | 1:100 |
| mTOR (S2448) | Cell Signaling | 5536 | 1:100 |
| NFkB p65 (S536) | Cell Signaling | 3031 | 1:50 |
| p70 S6 Kinase (T389) | Cell Signaling | 9205 | 1:200 |
| PDK1 (S241) | Cell Signaling | 3061 | 1:100 |
| PKA C (T197) | Cell Signaling | 4781 | 1:250 |
| PRAS40 (T246) | BioSource | 44-1100 | 1:2000 |
| PTEN (S380) | Cell Signaling | 9551 | 1:500 |
| Smad1 (S463/465), Smad5 (S463/465), Smad8 (S426/428) | Cell Signaling | 9511 | 1:500 |
| Src (Y527) | Cell Signaling | 2105 | 1:500 |
| Src Family (Y416) | Cell Signaling | 2101 | 1:200 |
| Stat1 (Y701) | Cell Signaling | 9171 | 1:200 |
| Stat3 (S727) | Cell Signaling | 9134 | 1:200 |
| Zap-70 (Y319) | Enogene | E011159 | 1:100 |
| βCatenin (S33/37/T41) | Cell Signaling | 9561 | 1:250 |
| CREB | Upstate Biotechnologies | 06-863 | 1:100 |
| Fos B | Cell Signaling | 2251 | 1:200 |
| GRB2 | Cell Signaling | 3972 | 1:2000 |
| HSP70 | Stressgen | SPA-810 | 1:100 |
| c-Jun | Cell Signaling | 9165 | 1:100 |
| Kip1/p27 | BD | 610241 | 1:100 |
| Lck | Cell Signaling | 2984 | 1:250 |
| Mcl-1 | Cell Signaling | 4572 | 1:80 |
| Musashi | Cell Signaling | 2154 | 1:100 |
| NOTCH1 | Cell Signaling | 3439 | 1:100 |
| PTEN | Cell Signaling | 9552 | 1:500 |
| SGK1 | Abnova | PAB4590 | 1:250 |
| Zap-70 | Cell Signaling | 2705 | 1:250 |
| β-Catenin | Abcam | AB32572 | 1:1000 |
| Dll4 | Abcam | AB7280 | 1:500 |
| Shh | Abcam | AB53281 | 1:250 |
| HIF-1α | BD | 610958 | 1:50 |
| NUMB PAN-ISO | Upstate Biotechnologies | 07-207 | 1:400 |
| NUMB-L | Chemicon | AB15145 | 1:750 |
| Cyclin B | BD | 610220 | 1:75 |
| c-Myc | Calbiochem | OP-10 | 1:100 |
| BCIP/NBT Kit | Thermo-Fisher | 002209 | (Note after step 5.2.8). Kit used to measure alkaline phosphatase activity, similar kits can be used. |
| Name | Company | Catalog Number | Comments |
| Antibodies for Flow Cytometry: | |||
| SSEA1 Antibody, Pacific Blue conjugate | Thermo-Fisher | MHCD1528 | 1:100 (Note after step 5.2.8) |
| SSEA4 Antibody (MC813-70), Alexa Fluor 647 | Thermo-Fisher | SSEA421 | 1:100 |
| Name | Company | Catalog number | Comments |
| Specific instruments, tools and softwares: | |||
| Countess Automated Cell Counter | Thermo-Fisher | C10227 | Neubauer chamber or other suitable glass hemocytometer can be used. |
| MEA1060-Inv-BC | Multichannel Systems | MEA1060-Inv-BC | (Step 5.3) |
| MEA1060-BC control software | Multichannel Systems | MEA1060-BC | (Step 5.3) |
| NeuroExplorer | Multichannel Systems | NeuroExplorer (NE) | (Step 5.3) For post-processing of MEA data |
| Multielectrode arrays (MEA) | Multichannel Systems | 60MEA100/10iR-Ti-gr | (Step 5.3) Single-well MEA chip |
| ArrayScan XTI High Content Platform | Thermo-Fisher | ASN00002P | (Step 5.2.8) Mean fluorescence can be quantified by using specific ArrayScan algorithms (e.g., Cytotoxicity V.4 and NucTrans V.4 bioapplications). It is recommended to take minimum 20 pictures/well, and have 7-8 internal replicates per condition |
| 7900HT Fast Real-Time PCR System | Thermo-Fisher | 4351405 | (Step 5.1.6) |
| BD ULTRA-FINE Needle Insulin Syringe (with 30G needle) | BD | 328280 | (Steps 1.3.1, 2.1.2, and 2.4.1) |
| StemPro EZPassage Disposable Stem Cell Passaging Tool | ThermoFisher | 23181010 | This colony cutting tool can be used as an alternative to the use of 30G needle 1 mL syringes (Step 1.3.1) |
| Ultra-Low attachment Petri dish (60 mm) | Corning | 10010582 | (Step 2.1.8) Also other brands can be used. |
| Mr. Frosty Freezing container | Sigma-Aldrich | C1562-1EA |
References
- NRC. Toxicity Testing in the 21st Century: A Vision and a Strategy. , National Academy Press. Washington, DC. (2007).
- Drews, K., Jozefczuk, J., Prigione, A., Adjaye, J. Human induced pluripotent stem cells--from mechanisms to clinical applications. J Mol Med (Berl). 90 (7), 735-745 (2012).
- Ho, P. J., Yen, M. L., Yet, S. F., Yen, B. L. Current applications of human pluripotent stem cells: possibilities and challenges. Cell Transplant. 21 (5), 801-814 (2012).
- Krueger, W. H., Swanson, L. C., Tanasijevic, B., Rasmussen, T. P. Natural and artificial routes to pluripotency. Int J Dev Biol. 54 (11-12), 1545-1564 (2010).
- Pistollato, F., Bremer-Hoffmann, S., Healy, L., Young, L., Stacey, G. Standardization of pluripotent stem cell cultures for toxicity testing. Expert Opin Drug Metab Toxicol. 8 (2), 239-257 (2012).
- Pistollato, F., et al. Development of a pluripotent stem cell derived neuronal model to identify chemically induced pathway perturbations in relation to neurotoxicity: effects of CREB pathway inhibition. Toxicol Appl Pharmacol. 280 (2), 378-388 (2014).
- Zagoura, D., Canovas-Jorda, D., Pistollato, F., Bremer-Hoffmann, S., Bal-Price, A. Evaluation of the rotenone-induced activation of the Nrf2 pathway in a neuronal model derived from human induced pluripotent stem cells. Neurochem Int. , (2016).
- Standard operating procedure for differentiation of human induced pluripotent stem cells into post-mitotic neurons and glial cells. EURL ECVAM. , Available from: https://ecvam-dbalm.jrc.ec.europa.eu/methods-and-protocols/protocol/standard-operating-procedure-for-differentiation-of-human-induced-pluripotent-stem-cells-into-post-mitotic-neurons-and-glial-cells-%28mixed-culture%29-protocol-no.-165/key/p_1570 (2016).
- Standard operating procedure for expansion of rosette-derived neural stem cells. EURL ECVAM. , Available from: https://ecvam-dbalm.jrc.ec.europa.eu/methods-and-protocols/protocol/standard-operating-procedure-for-expansion-of-rosette-derived-neural-stem-cells-protocol-no.-166/key/p_1571 (2016).
- Schmittgen, T. D., Livak, K. J. Analyzing real-time PCR data by the comparative C(T) method. Nat Protoc. 3 (6), 1101-1108 (2008).
- Brien, P. J., et al. High concordance of drug-induced human hepatotoxicity with in vitro cytotoxicity measured in a novel cell-based model using high content screening. Arch Toxicol. 80 (9), 580-604 (2006).
- Accordi, B., et al. Functional protein network activation mapping reveals new potential molecular drug targets for poor prognosis pediatric BCP-ALL. PLoS One. 5 (10), e13552(2010).
- Vassallo, A., et al. A multi-laboratory evaluation of microelectrode array-based measurements of neural network activity for acute neurotoxicity testing. Neurotoxicology. , (2016).
- Shamblott, M. J., et al. Human embryonic germ cell derivatives express a broad range of developmentally distinct markers and proliferate extensively in vitro. Proc Natl Acad Sci U S A. 98 (1), 113-118 (2001).
- Bryan, H. K., Olayanju, A., Goldring, C. E., Park, B. K. The Nrf2 cell defence pathway: Keap1-dependent and -independent mechanisms of regulation. Biochem Pharmacol. 85 (6), 705-717 (2013).
- Tufekci, K. U., Civi Bayin, E., Genc, S., Genc, K. The Nrf2/ARE Pathway: A Promising Target to Counteract Mitochondrial Dysfunction in Parkinson's Disease. Parkinsons Dis. , 314082(2011).
- Kovac, S., et al. Nrf2 regulates ROS production by mitochondria and NADPH oxidase. Biochim Biophys Acta. 1850 (4), 794-801 (2015).
- Lee, J. M., Shih, A. Y., Murphy, T. H., Johnson, J. A. NF-E2-related factor-2 mediates neuroprotection against mitochondrial complex I inhibitors and increased concentrations of intracellular calcium in primary cortical neurons. J Biol Chem. 278 (39), 37948-37956 (2003).
- Itoh, K., et al. An Nrf2/small Maf heterodimer mediates the induction of phase II detoxifying enzyme genes through antioxidant response elements. Biochem Biophys Res Commun. 236 (2), 313-322 (1997).
- Li, L., et al. Nrf2/ARE pathway activation, HO-1 and NQO1 induction by polychlorinated biphenyl quinone is associated with reactive oxygen species and PI3K/AKT signaling. Chem Biol Interact. , 56-67 (2014).
- Cannon, J. R., et al. A highly reproducible rotenone model of Parkinson's disease. Neurobiol Dis. 34 (2), 279-290 (2009).
- Sherer, T. B., Kim, J. H., Betarbet, R., Greenamyre, J. T. Subcutaneous rotenone exposure causes highly selective dopaminergic degeneration and alpha-synuclein aggregation. Exp Neurol. 179 (1), 9-16 (2003).
- Testa, C. M., Sherer, T. B., Greenamyre, J. T. Rotenone induces oxidative stress and dopaminergic neuron damage in organotypic substantia nigra cultures. Brain Res Mol Brain Res. 134 (1), 109-118 (2005).
- Tukey and Dunnett methods. GraphPad. , Available from: http://www.graphpad.com/guides/prism/7/statistics/index.htm?stat_the_methods_of_tukey_and_dunne.htm (2017).
- Zhou, J., et al. High-efficiency induction of neural conversion in human ESCs and human induced pluripotent stem cells with a single chemical inhibitor of transforming growth factor beta superfamily receptors. Stem Cells. 28 (10), 1741-1750 (2010).
- Topol, A., Tran, N. N., Brennand, K. J. A Guide to Generating and Using hiPSC Derived NPCs for the Study of Neurological Diseases. J Vis Exp. (96), e52495(2015).
- Jiang, Y., Zhang, M. J., Hu, B. Y. Specification of functional neurons and glia from human pluripotent stem cells. Protein Cell. 3 (11), 818-825 (2012).
- Parsons, X. H., et al. Efficient derivation of human neuronal progenitors and neurons from pluripotent human embryonic stem cells with small molecule induction. J Vis Exp. (56), e3273(2011).
- Shi, Y., Kirwan, P., Livesey, F. J. Directed differentiation of human pluripotent stem cells to cerebral cortex neurons and neural networks. Nat Protoc. 7 (10), 1836-1846 (2012).
- Zeng, H., et al. Specification of region-specific neurons including forebrain glutamatergic neurons from human induced pluripotent stem cells. PLoS One. 5 (7), e11853(2010).
- Zeng, X., et al. An in vitro model of human dopaminergic neurons derived from embryonic stem cells: MPP+ toxicity and GDNF neuroprotection. Neuropsychopharmacology. 31 (12), 2708-2715 (2006).
- Paşca, A. M., et al. Functional cortical neurons and astrocytes from human pluripotent stem cells in 3D culture. Nat Methods. 12 (7), 671-678 (2015).
- Almeida, S., et al. Modeling key pathological features of frontotemporal dementia with C9ORF72 repeat expansion in iPSC-derived human neurons. Acta Neuropathol. 126 (3), 385-399 (2013).
- Urbán, N., Guillemot, F. Neurogenesis in the embryonic and adult brain: same regulators, different roles. Front Cell Neurosci. 8, 396(2014).
- Kriegstein, A., Alvarez-Buylla, A. The glial nature of embryonic and adult neural stem cells. Annu Rev Neurosci. 32, 149-184 (2009).
- Krencik, R., Weick, J. P., Liu, Y., Zhang, Z. J., Zhang, S. C. Specification of transplantable astroglial subtypes from human pluripotent stem cells. Nat Biotechnol. 29 (6), 528-534 (2011).
- Krencik, R., Zhang, S. C. Directed differentiation of functional astroglial subtypes from human pluripotent stem cells. Nat Protoc. 6 (11), 1710-1717 (2011).
- Nguyen, T., Nioi, P., Pickett, C. B. The Nrf2-antioxidant response element signaling pathway and its activation by oxidative stress. J Biol Chem. 284 (20), 13291-13295 (2009).
- Bal-Price, A., et al. Putative adverse outcome pathways relevant to neurotoxicity. Crit Rev Toxicol. 45 (1), 83-91 (2015).
- Cabezas, R., El-Bacha, R. S., Gonzalez, J., Barreto, G. E. Mitochondrial functions in astrocytes: neuroprotective implications from oxidative damage by rotenone. Neurosci Res. 74 (2), 80-90 (2012).
- Swarnkar, S., et al. Astrocyte activation: a key step in rotenone induced cytotoxicity and DNA damage. Neurochem Res. 37 (10), 2178-2189 (2012).
- Canovas-Jorda, D., Louisse, J., Pistollato, F., Zagoura, D., Bremer, S. Regenerative toxicology: the role of stem cells in the development of chronic toxicities. Expert Opin Drug Metab Toxicol. 10 (1), 39-55 (2014).
Reprints and Permissions
