'Super-selective' adrenal venous sampling (ssAVS, also called segmental adrenal venous sampling: sAVS) was performed using a micro-catheter to identify adrenal segment(s) that produce excessive amounts of hormones. The ssAVS technique was described, cases in which adrenal segmental lesion(s) were identified by ssAVS were presented, and the usefulness of ssAVS in future adrenal research was discussed.
Method Article
A Novel Method: Super-selective Adrenal Venous Sampling
In This Article
Summary
Abstract
Primary aldosteronism (PA) and subclinical Cushing's syndrome (SCS) are conditions in which the adrenal glands autonomously produce excessive amounts of aldosterone and cortisol, respectively. The conventional adrenal venous sampling (cAVS) method collects blood samples from both adrenal central veins and is useful for identifying the laterality of excess hormone production in a unilateral lesion(s), as documented in PA cases. In cAVS, plasma cortisol concentrations (PCCs) are used to normalize plasma aldosterone concentrations (PACs). A novel "super-selective" adrenal venous sampling (ssAVS) method was developed using a micro-catheter, which collects blood samples from adrenal tributary veins (TVs). PACs in ssAVS samples do not require PCC normalization because samples contain a limited amount of systemic venous blood, if any. The ssAVS method enabled segmental lesion(s) to be detected in both adrenal glands, which may be treated by bilateral adrenalectomy, thereby sparing lesion-free segment(s). Right and left adrenals typically have three TVs each, i.e., the superior, lateral, and inferior TVs in the right adrenal as well as the superior-median, superior-lateral, and lateral TVs in the left adrenal. In the ssAVS method, specific parent catheters and a technique to handle them are required, and have been described herein. Furthermore, ssAVS results from three cases of PA are presented: bilateral aldosterone-producing adenoma (APA) (Case #1), left APA and right possible cortisol-producing adenoma causing SCS (Case #2), and idiopathic hyperaldosteronism in which bilateral adrenal segments produced excessive amounts of aldosterone (Case #3). The ssAVS method is not difficult for expert angiographers, and, thus, is recommended worldwide to treat PA cases for which cAVS does not represent a viable surgical treatment option.
Introduction
Primary aldosteronism (PA) and subclinical Cushing's syndrome (SCS) are conditions in which the adrenal glands autonomously produce excess amounts of aldosterone and cortisol, respectively. In adults, PA is mainly caused by an aldosterone-producing adenoma (APA) or idiopathic hyperaldosteronism (IHA)1, whereas SCS is mainly caused by a cortisol-producing adenoma2. Somatic mutations in ion channel/pump genes, including potassium channel, inwardly rectifying subfamily J, member 5 (KCNJ5), have been identified in APAs, and are associated with autonomous aldosterone production3,4,5,6. Familial hyperaldosteronism types 1 - 3 are rare types of PA, and type 3 is caused by a KCNJ5 germ-line mutation3. A case of a novel type of juvenile PA, which was presumably due to the genetic mosaicism of normal and KCNJ5 mutant adrenocortical cells, was recently identified7. In the juvenile PA case, the adrenal cortices consisted of a normal portion and hyperplastic aldosterone-producing lesions, with the normal portion being identified by the novel 'super-selective' adrenal venous sampling (ssAVS, also called segmental adrenal venous sampling) method described herein. The ssAVS method allowed this bilateral PA patient to be treated surgically by bilateral adrenalectomy while sparing the normal portion7.
Adrenal venous sampling was initially reported in 19718 when computed tomography (CT) had not yet been developed. In "conventional" adrenal venous sampling (cAVS), a catheter is inserted into both adrenal central veins, from which blood samples are collected. Thus, cAVS is only useful for judging the laterality of PA and not for identifying surgical options for bilateral PA. Drs. Masao Omura and Kohzoh Makita (authors of this article) in Yokohama Rosai Hospital developed the ssAVS method in order to investigate additional surgical treatment options for PA7,8,9,10,11, which may also be useful for SCS, as described in Case #2 (see Representative Results).
In ssAVS, blood samples are collected from small adrenal tributary veins (TVs: smaller upstream branches of the adrenal central veins) using a specialized split-tip micro-catheter9. The right and left adrenals typically have three tributary veins each, i.e., the superior, lateral, and inferior TVs in the right adrenal as well as the superior-median, superior-lateral, and lateral TVs in the left adrenal. Very few connections have been identified between these TVs12. Therefore, ssAVS enables the identification of a specific adrenal segment(s) not producing aldosterone autonomously within an affected adrenal, thereby allowing bilateral adrenal surgery to be performed on bilateral PA while sparing unaffected adrenal segment(s). Furthermore, the ssAVS method is applicable to investigations on the pathophysiology of novel types of PA such as juvenile PA (described above7) and bilateral APA13,14. Since it is critical for the treatment of bilateral PAs and the elucidation of their pathogenesis, which may include "idiopathic" hyperaldosteronism, ssAVS is recommended worldwide, and, hence, a detailed description of the method involved was provided herein.
Protocol
This study was approved by the Institutional Review Boards of Saitama Medical University International Medical Center and Yokohama Rosai Hospital (approval #: 16-093 and 26-38, respectively). Written consent was obtained from all patients prior to the procedure.
1. Patient Preparation
- Set the patient on the examination bed.
- Place a venous line in an upper arm (or left leg) for the administration of medication during the procedure.
- Insert the access sheath into the right femoral vein after appropriate skin disinfection and local anesthesia.
- Collect a blood sample (1 mL) from the right femoral vein (peripheral blood sample before the administration of cosyntropin).
2. Catheterization
- ssAVS of right adrenal TVs
- Insert either the catheter with the MK Adrenal-R shape (Figure 1A and 1B) or the catheter with the MK X shape (Figure 1C) into the right adrenal vein (RAV) as previously reported 15,16, collect a blood sample (1 mL), and remove the catheter (right cAVS sample before the administration of cosyntropin). Use the micro-catheter if needed.
- Select an appropriate parent catheter for the right adrenal: When the "long diameter of the IVC" is shorter than 25 mm, use MK Adrenal-R. Otherwise, use MK X.
- Re-shape the parent catheter if needed.
- Based on CT images, re-shape the width of the selected catheter (red bidirectional arrows in Figure 1A or 1C) to fit the "long diameter of the IVC"15 (also see Case #1) and the angle of the catheter tip to fit the "modified transverse angle of the RAV"15 (also see Case #1).
- Re-shape the catheter while applying high temperature steam from boiled water (e.g. electronic kettle) to the catheters. Detailed procedures are described elsewhere15.
- Place the tip of the parent catheter into the RAV with an appropriate angle (average modified transverse angle of the RAV: 123.6 °)15 and depth (1 - 2 mm).
NOTE: Accurate parent catheter placement is essential for delivery of the micro-catheter into the target TV. - Manipulate the parent catheter to change the direction of the catheter tip to aim for one of the right TVs, and insert a saline-filled micro-catheter with a guidewire.
NOTE: Pushing and pulling the parent catheter will change the vertical angle of the parent catheter, i.e. when the 3D-type catheter is pulled toward the foot, the catheter tip is directed upwards, whereas the catheter tip is directed downwards when the catheter is pushed (see Case #1 below). Once the tip of catheter is inserted into the RAV exit with an appropriate angle and depth, the micro-catheter may be inserted. It is important for the examiner to prevent a patient from breathing deeply or the vertical angle may change. The micro-catheter described above is inserted with a guidewire into a TV. - Perform venography using digital subtraction angiography through the micro-catheter with a small amount of saline-diluted (1:1) contrast-medium (0.1 - 0.3 mL; iopromide injection) and flush it gently. Collect a 1-mL blood sample slowly for the measurement of plasma aldosterone concentrations (PAC) and plasma cortisol concentrations (PCC).
- Pull the micro-catheter slightly back, and flush the micro-catheter line with at least 0.5 mL of saline. Aim the parent catheter tip at the next TV.
- Repeat steps 2.1.6 and 2.1.7 above for all right TVs.
- ssAVS of left adrenal TVs
- Insert an L shape catheter (Figure 2) into the left adrenal vein (LAV), collect a blood sample (1 mL), and remove the catheter (left cAVS sample before the administration of cosyntropin). Use the micro-catheter.
- Place the parent catheter.
NOTE: Anatomically, the left adrenal central vein is confluent with the inferior phrenic vein, and venous blood in these veins flows into LAV8. Therefore, to only collect venous blood samples from left adrenal tissues, catheterization into the left adrenal central vein is needed, i.e., catheterization into the point before merging with the inferior phrenic vein, which typically requires micro-catheterization, even for cAVS. While performing adrenal central venography, similar to the right side, it is important to identify left adrenal TVs, particularly lateral TV (see "Case #2 as an example of LAV-ssAVS"). A catheter with the L shape was preferred for use. Portions #1, #2, and #3 (Figure 2) of the catheter fit the IVC, renal vein, as well as common trunk of the inferior phrenic vein and LAV, respectively, thereby allowing portion #3 to stably sit in the common trunk. - Insert the micro-catheter into left adrenal TVs and collect blood samples from left TVs. See Steps 2.1.5 - 2.1.6 above for right adrenal TVs for general procedures.
NOTE: The micro-catheter and guidewire (the same as those in the right ssAVS) are inserted into TVs (typically the superior-median, superior-lateral, and lateral TVs) as described in Case #2 below, and blood samples are collected.
3. After Injections
- Inject 200 µg of synthetic adrenocorticotropic hormone (cosyntropin, bolus) through the venous line followed by the continuous administration of cosyntropin at a rate of 50 µg/min.
- Fifteen minutes after the bolus cosyntropin injection, perform cAVS again, as described above, and ssAVS, as described in steps 2.1 and 2.2. Collect 1 mL blood each.
- Collect a blood sample from the right femoral vein.
- Remove all catheters and access sheath, and complete the cAVS and ssAVS examinations after astriction.
NOTE: Regarding details on the general adrenal venous sampling technique (steps except for 3.2), refer to other textbooks or journals17.
Results
Case #1 (YRPA #3472)
Case #1 was a 46-year-old female. When she was 33 years old, she was hospitalized in a local hospital for severe hypertension with hypokalemia (serum K 1.8 [normal range: 3.5 - 5.9] mEq/L). She was diagnosed with PA based on blood test results (PAC 320 [35.7 - 240] pg/mL, PRA <0.1 [0.3 - 2.9] ng/mL/h). CT indicated bilateral adrenocortical adenoma (data not available). After cAVS (data not available), she underwent left adrenalectomy, but her PA persisted. Thirteen years after the first surgery (46 years old), she was referred to Yokohama Rosai Hospital for an evaluation of PA. A physical examination was normal, except for a high body mass index (29.3 [<25] kg/m2). Laboratory tests were normal, except for very high PAC (1490 pg/mL) and very low serum K (2.2 mEq/L). Her PAC was very high (2,550 [cut-off: <60] pg/mL) even 4 hours after a 2-L infusion of saline (saline infusion test), suggesting that she had severe PA. An abdominal CT scan revealed a 22-mm right adrenal tumor (Figure 3A).
cAVS and ssAVS were performed under a stimulation with synthetic adrenocorticotropic hormone (ACTH). Based on CT, the "long diameter of the IVC" (the length of the red dotted line in Figure 3A) and "modified transverse angle of the RAV" (the larger angle between the red and blue dotted lines in Figure 3A) were 28 mm and 145 degrees, respectively. The "width" and "tip angle" of the catheter with the X shape (Figure 1C) were pre-operatively re-shaped to fit the IVC and RAV, as detailed in reference15. Catheterization into the exit of the RAV was quickly performed without any difficulty. Right adrenal venography demonstrated that the lateral TV was significantly expanded (pink arrowhead in Figure 3B) at the point at which its branches outlined the shape of the tumor, suggesting that a large volume of blood was flowing out from the adenoma into this TV. A micro-catheter was inserted and a blood sample was collected from the lateral TV after confirming its venography (Figure 3C). By pulling and pushing the catheter, the micro-catheter was easily inserted into the superior and inferior TVs for venography (Figure 3D and 3E), and this was followed by sampling.
PAC in the central vein and lateral TV were very high (422,000 pg/mL and 588,000 pg/mL, respectively; normal range < 14,000 pg/mL for both18), suggesting that the tumor was an APA (Figure 3C, Table 1). PAC in the superior and inferior TVs were 8,230 pg/mL and 12,600 pg/mL, respectively (Figure 3D and 3E), indicating that these TVs were collecting blood from the normal adrenal tissues. PCC levels in the central vein, superior TV, lateral TV, and inferior TV were similar (1,110 µg/dL, 1,150 µg/dL, 1,050 µg/dL, and 1,080 µg/dL, respectively), suggesting that cortisol production was uniform throughout the adrenal cortex including the tumor-bearing part. Thus, PAC/PCC values, which are generally used for data analyses in cAVS, were consistent with PAC values in cAVS and ssAVS in this case. She underwent partial adrenalectomy sparing the normal portion. A pathological examination identified adrenocortical adenoma (T in Figure 3F), which expressed aldosterone synthase (CYP11B2) in many cells (T in Figure 3G) and steroid 11β-hydroxylase (CYP11B1, cortisol-synthesizing enzyme) in a small number of cells (T in Figure 3H), which confirmed the diagnosis of APA19,20. In the adjacent normal adrenal, although CYP11B2 was not expressed in the zona glomerulosa, which may have been due to low circulating renin, CYP11B1 was expressed in the zona fasciculata and zona reticularis (N in Figure 3H), suggesting that cortisol production was normal. These pathological results of APA and suppressed CYP11B2 expression in adjacent normal adrenal tissue were consistent with the ssAVS results (Table 1). After surgery, her blood pressure (114/62 mmHg) as well as PAC and PRA in her peripheral blood (52 pg/mL and 0.8 ng/mL/h, respectively) normalized without any antihypertensive drugs.
Case #2 (YRPA #4119)
Case #2 was a 59 year-old male with hypertension since he was 45 years old. CT during a routine physical examination incidentally identified bilateral adrenal nodules, which were enhanced by contrast medium (Figure 4A). He was referred to Yokohama Rosai Hospital for the further evaluation of hypertension and adrenal nodules. A physical examination was normal without apparent Cushingoid features. Blood tests were normal including PCC (7.6 [6.2 - 18.0] µg/dL), ACTH (20.8 [7.2 - 63.3] pg/mL), and PAC (201 pg/mL), except for PRA (<0.2 ng/mL/h) and serum K (3.0 mEq/L). The saline infusion test showed high PAC (374 pg/mL). PCC at 11 pm and after the overnight administration of 1 mg of dexamethasone were 6.8 and 7.2 (cut-off: ≤5 and ≤1.8) µg/dL, respectively. Thus, he was diagnosed with PA with SCS2,18.
In order to identify which tumor was responsible for excess hormone production, cAVS with ssAVS was performed under a synthetic ACTH stimulation. Left adrenal venography using the micro-catheter through the catheter with the L shape (Figure 2) identified the typical superior-median (yellow arrowhead in Figure 4B), superior-lateral (red arrowhead), and lateral TVs (pink arrowhead). The superior-median TV had a short filling defect, presumably due to the adenoma (green arrows in Figure 4B). It is noteworthy that the head of the micro-catheter (black arrowhead in Figure 4B) was placed inside the adrenal central vein before merging with the inferior phrenic vein, thereby enabling unobstructed imaging of the lateral TV. Following the guidewire, the micro-catheter was inserted into the superior-median (venography is not available) and superior-lateral (Figure 4C) TVs for venography and sample collection. The lateral TV merged perpendicularly with the central vein, which was a typical finding. The tip of the micro-catheter and its guidewire were bended and inserted into the lateral TV, and a blood sample was collected. As described in Case #1, cAVS from RAV and ssAVS from right superior TV (red arrowhead in Figure 4E), lateral TV (pink arrowhead) downstream of the tumor, and inferior TV (yellow arrowhead) were also performed.
In data analyses of cAVS and ssAVS, PAC and PCC values were utilized, but not PAC/PCC values because PCC values markedly varied among the right and left TVs (median and interquartile range: 99.6 and 70.3 - 577.5 µg/dL, respectively, Table 1). PAC in the left adrenal central vein was high (94,800 [<14,000] pg/mL), and that in the left superior-median TV was very high (304,000 pg/mL: 3.2-fold that in the central vein), suggesting that the left adrenal tumor was the lesion responsible for PA. However, PAC in left superior-lateral and lateral TVs were low (2,060 and 2,240 pg/mL, respectively), suggesting that they collect blood from non-tumor portions. PCC in the left central vein, superior-median TV, superior-lateral TV, and lateral TV (74.7 µg/dL, 87.1 µg/dL, 75.7 µg/dL, and 54.1 µg/dL, respectively) were markedly lower than those in Case #1, suggesting that cortisol production was suppressed throughout the left adrenal cortex including the tumor due to excess cortisol production from the right adrenal gland, as described below. Regarding the right adrenal, PAC in the right central vein (5,190 pg/mL, i.e., within the normal range of <14,000) and lateral TV (5,300 pg/mL) were higher than those in the superior and inferior TVs (1,710 and 2,180 pg/mL, respectively), which suggested that the right tumor produced a small amount of aldosterone. PCC in the right lateral TV (1,050 µg/dL) was markedly higher than those in the right superior TV (112 µg/dL), right inferior TV (420 µg/dL), and left TVs, suggesting that the right adrenal tumor produced excessive amounts of cortisol (i.e. cortisol-producing adenoma) and caused SCS. In order to treat PA, the patient underwent right partial adrenalectomy, which normalized his hypertension (136/82 mmHg without anti-hypertensives) and PAC (50 pg/mL) 3 days after surgery. A pathological examination identified an adrenocortical adenoma (T in Figure 4F) that expressed CYP11B2 (T in Figure 4G), but not CYP11B1 (T in Figure 4H), confirming the diagnosis of APA. The adjacent normal adrenal did not express CYP11B1 (N in Figure 4H), suggesting that cortisol production was suppressed due to the probable cortisol-producing adenoma on the opposite side. These pathological results of adenoma and adjacent adrenal tissue were consistent with the ssAVS results (Table 1). SCS is currently being followed-up without treatment because it has not caused hypertension or impaired glucose tolerance2.
Overall, in Cases #1 and #2, the ssAVS method clearly indicated segmental adrenal hormone production, not only for aldosterone, but for cortisol, and enabled these patients to be treated by surgery.
Case #3 (YRPA #8243)
Case #3 was a 50-year-old female with dizziness due to severe hypertension since she was 48 years old. A high PAC to PRA ratio ([131 pg/mL] / [0.3 ng/mL/h] = 436.7, [cut-off: <200]18) suggested that she had PA. She was referred to Yokohama Rosai Hospital for further evaluations of hypertension. A physical examination was normal with a normal body mass index (23.4 kg/m2). Blood tests were normal including PAC (183 pg/mL) and PRA (0.4 ng/mL/h). The saline infusion test showed slightly high PAC (66 [cut-off: <60] pg/mL)18, suggesting that she had mild PA. A high PAC to PRA ratio ([146 pg/mL] / [0.4 ng/mL/h] = 365 [cut-off: < 200]) after the administration of captopril confirmed that she had PA (captopril challenge test)18. CT detected no apparent adrenal adenoma (Figure 5A). In order to identify aldosterone-producing adrenal segment(s), cAVS with ssAVS was performed under a synthetic ACTH stimulation. In cAVS, PAC/PCC in the right and left central veins were ([57,600 pg/mL] / [901 µg/dL] = 63.9) and ([18,000 pg/mL] / [389 µg/dL] = 46.3), respectively, suggesting that she had bilateral PA (lateralized ratio = 1.4, cut-off: <2.618, Table 1). In right ssAVS, PAC in the superior TV (#1 in Figure 5B), superior-median TV (#2), lateral TV (#3), and inferior TV (#4) were 59,100 pg/mL, 66,400 pg/mL, 57,300 pg/mL, and 45,400 pg/mL, respectively. In left ssAVS, PAC in the superior-median TV (#1 in Figure 5C), superior-lateral TV (#2), lateral TV (#3), and inferior TV (#4) were 43,900 pg/mL, 19,600 pg/mL, 23,000 pg/mL, and 36,900 pg/mL, respectively. Thus, PAC were higher than 14,000 pg/mL throughout bilateral TVs, suggesting that Case #3 was true IHA. She is currently being treated with a mineralocorticoid receptor antagonist.
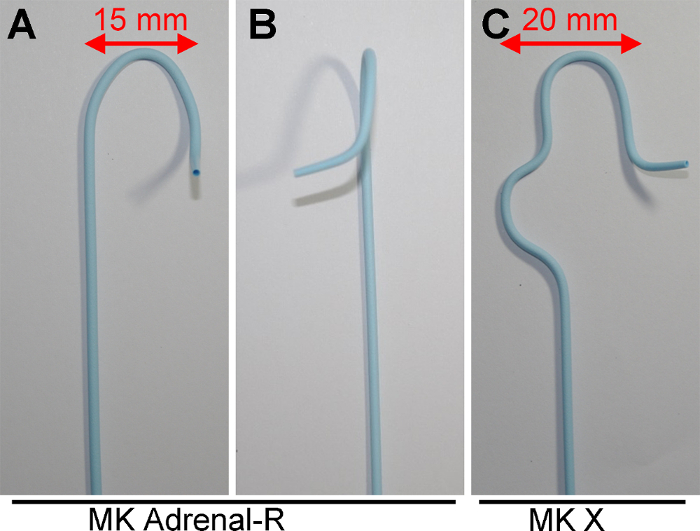
Figure 1: Catheters used for Right cAVS. (A and B) Frontal and lateral views of the catheter with the R shape, respectively. (C) A frontal view of the catheter with the X shape. Lengths indicated by bidirectional arrows in Figure 1A and 1C fit the "long diameter of the IVC"15 for cAVS. Please click here to view a larger version of this figure.
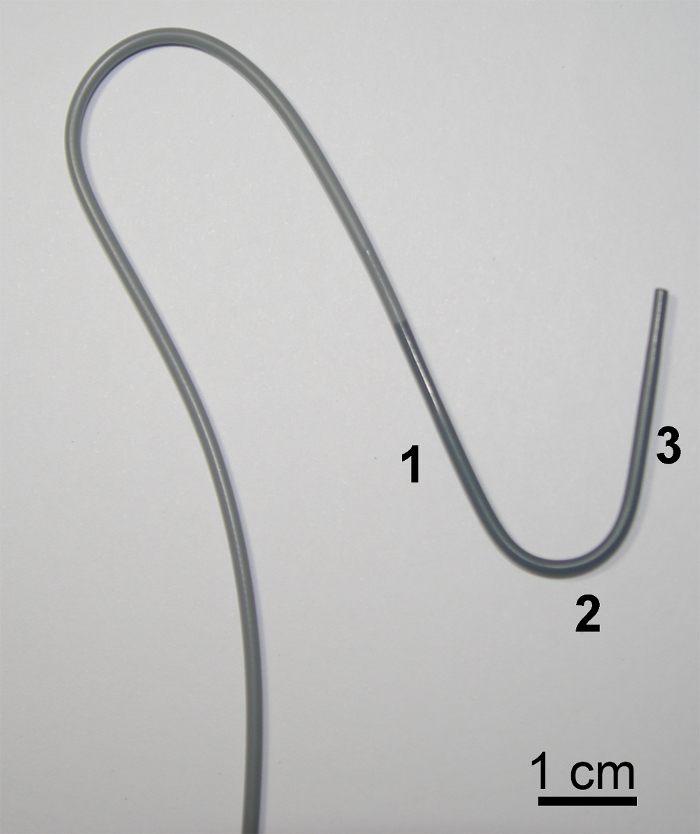
Figure 2: Catheter used for Left cAVS. A frontal view of the catheter with the L shape. Portions #1, #2, and #3 in the figure fit the IVC, renal vein, and common trunk of the inferior phrenic vein and LAV, respectively, letting portion #3 stably sit in the common trunk. Please click here to view a larger version of this figure.
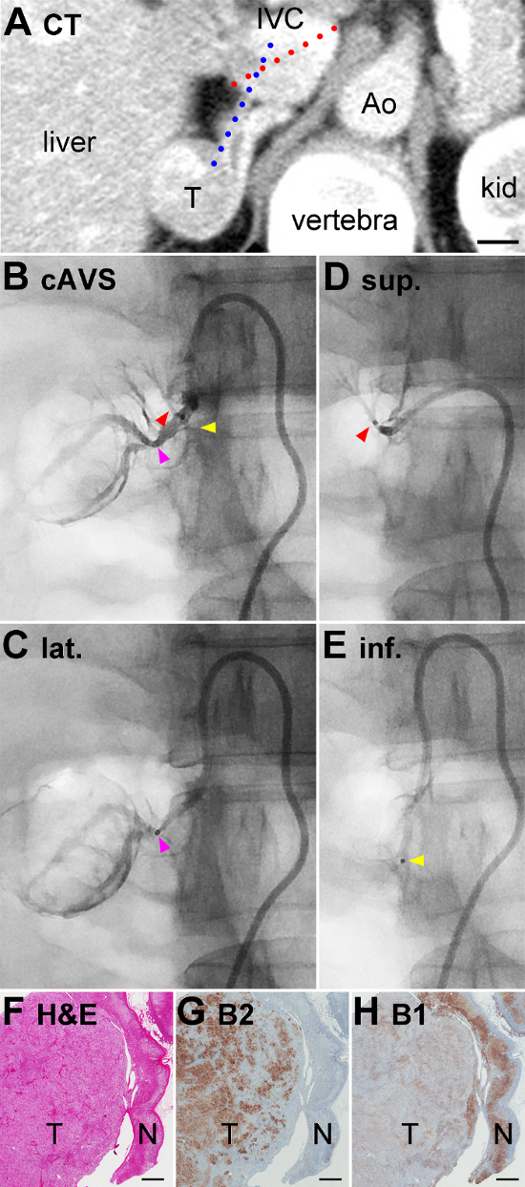
Figure 3: CT, Venography in ssAVS, Histology of Removed Adrenal of Case #1. (A) Contrast-enhanced CT. The length of the red dotted line indicates the "long diameter of the IVC"15. The larger angle between the red and blue dotted lines indicates the "modified transverse angle of the RAV"15. IVC, inferior vena cava; Ao, aorta; kid, kidney; T, tumor. (B) Right adrenal venography. Red, yellow, and pink arrowheads indicate superior, lateral, and inferior TVs, respectively. (C, D, and E) venography images of lateral (lat.), superior (sup.), and inferior (inf.) TVs, respectively. Black dots pointed by pink, red, and yellow arrowheads indicate micro-catheter heads. (F) Hematoxylin and eosin staining of the removed adrenocortical tumor (T) and adjacent adrenal gland (N). (G and H) Immunohistochemistry for aldosterone synthase (CYP11B2: abbreviated as B2 in the figure) and steroid 11β-hydroxylase (CYP11B1: B1) on serial sections of that in Figure 3F. Scale bars in A and F - H indicate 1 cm and 1 mm, respectively. Please click here to view a larger version of this figure.
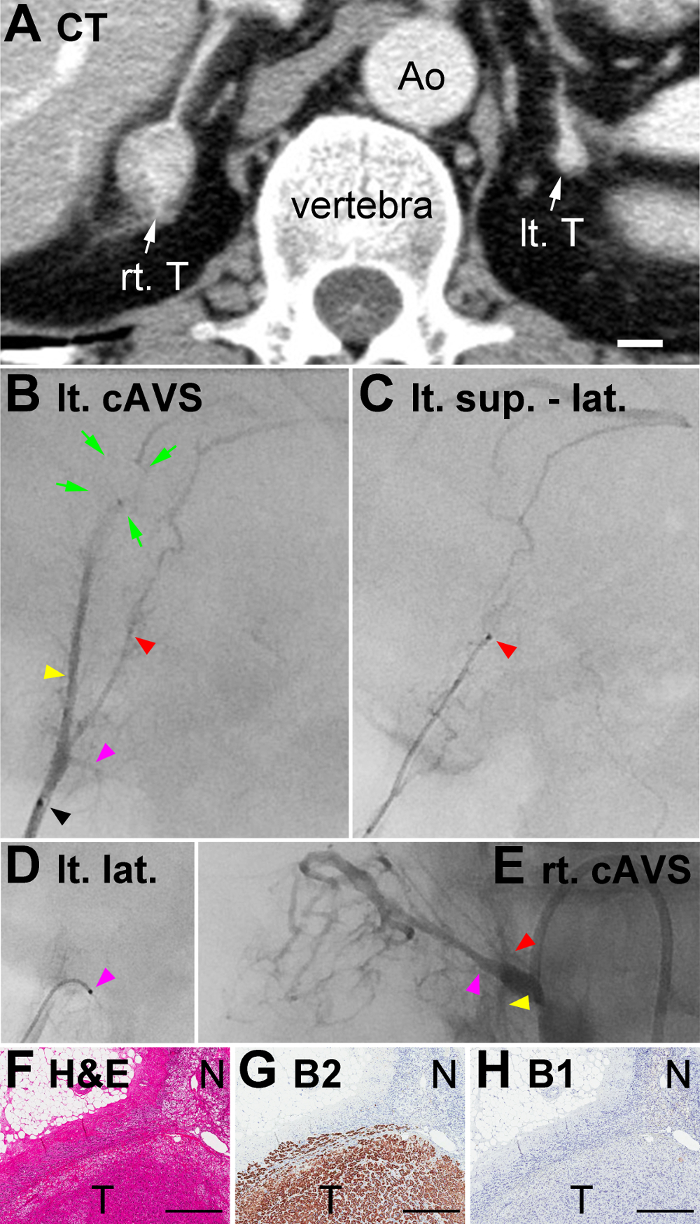
Figure 4: CT, Venography in ssAVS, Histology of Removed Adrenal of Case #2. (A) Contrast-enhanced CT. IVC, inferior vena cava; Ao, aorta; Lt. T: left adrenocortical tumor; Rt. T: right adrenocortical tumor. (B) Left adrenal venography. Yellow, red, and pink arrowheads indicate the superior-median, superior-lateral, and lateral TVs, respectively. Venography was performed using a micro-catheter, and its head is indicated by a black arrowhead. Green arrows indicate a short filling defect presumably due to the adenoma. (C and D) Venography images of the superior-lateral (sup. - lat.) and lateral (lat.) TVs, respectively. Red and pink arrowheads indicate micro-catheter heads (black dots in Figures 4C and 4D, respectively). It is noteworthy that the same colored arrowheads in Figure 4B and Figures 4C - 4D indicate the same portion of TVs, although venography of the superior-median TV, indicated by the yellow arrowhead in Figure 4B, was not available. (F) Hematoxylin and eosin staining of the removed adrenocortical tumor (T) and adjacent adrenal gland (N). (G and H) Immunohistochemistry for aldosterone synthase (CYP11B2: abbreviated as B2 in the figure) and steroid 11β-hydroxylase (CYP11B1: B1) on serial sections of that in Figure 4F. Scale bars in A and F - H indicate 1 cm and 0.5 mm, respectively. Please click here to view a larger version of this figure.
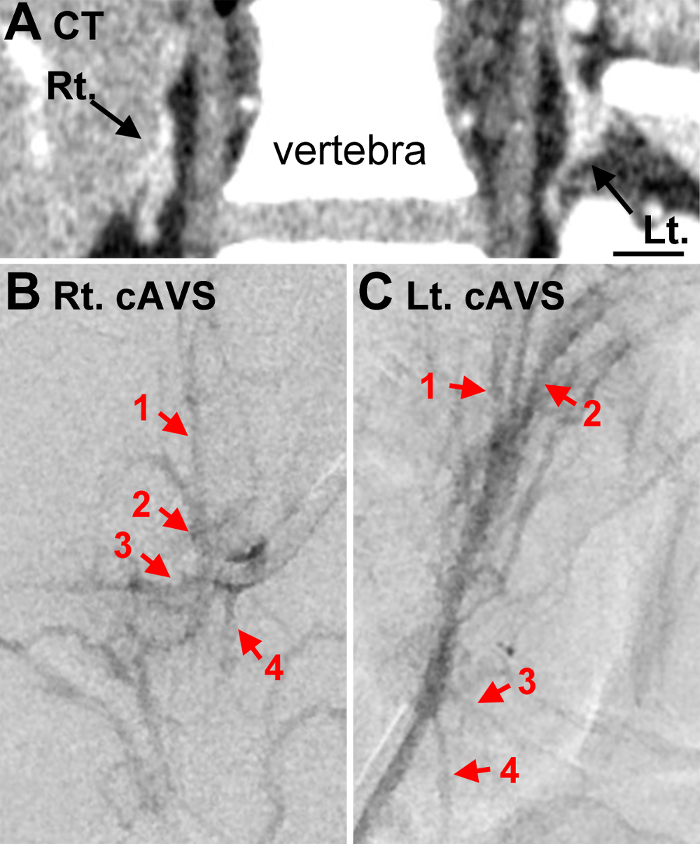
Figure 5: CT and Venography in ssAVS of Case #3. (A) Contrast-enhanced CT. Rt. and Lt indicate adrenal glands. (B) right adrenal venography. Numbers 1, 2, 3, and 4 with red arrows indicate the superior, superior-median, lateral, and inferior TVs. (C) Left adrenal venography. Numbers 1, 2, 3, and 4 with red arrows indicate the superior-median, superior-lateral, superior-lateral, and superior-lateral TVs. Scale bar = 1 cm (A). Please click here to view a larger version of this figure.
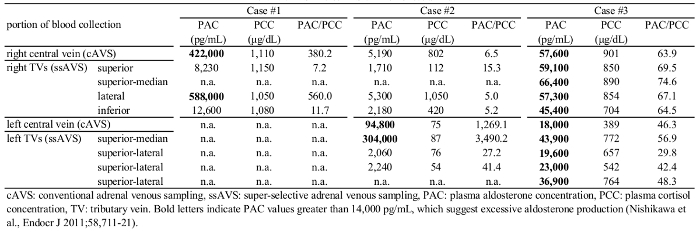
Table 1: cAVS and ssAVS Data of Cases #1 - 3. Please click here to view a larger version of this table.
Discussion
The ssAVS technique with representative case outcomes were described herein. Cases #1 - 2 and Case #3 were surgically and medically treated based on ssAVS results, respectively. Moreover, the results obtained for Cases #1 - 3 indicated that steroid hormone concentrations in ssAVS samples clearly reflect the hormonal activity of upstream adrenal tissues, particularly tumors, presumably because tumor blood outflow is directly obtained. The ssAVS method may play an invaluable role in identifying the affected adrenal segments from bilateral adrenocortical lesions (e.g., Cases #1 - 2), in definitive diagnoses of IHA (e.g., Case #3), and in basic science research to elucidate the pathophysiologies of adrenocortical diseases and discover novel biomarkers for these diseases as discussed below.
The guidelines for PA1,18,21 recommend performing cAVS to identify a unilateral adrenal lesion of PA by calculating the lateralized ratio ([higher PAC/PCC] / [lower PAC/PCC]). However, this calculation may result in a misdiagnosis when cortisol-producing lesions co-exist. The probable cortisol-producing adenoma in Case #2 clearly produced excessive amounts of cortisol in the right adrenal, and cortisol production in the left adrenal was suppressed. It is important to note that many APAs also produce excessive amounts of cortisol because they often express both CYP11B2 and CYP11B120. Another limitation of the lateralized ratio in cAVS is that it cannot distinguish bilateral APAs from idiopathic hyperaldosteronism (e.g., Case #3).
Furthermore, ssAVS blood samples may significantly contribute to the advancement of hormone excess disease research and treatments. For example, the ssAVS blood directory collected from adenoma may contain high concentrations of circulating tumor cells and their DNA22,23. Previous studies reported that the liquid biopsy method is clinically useful for distinguishing adrenocortical carcinoma from adenoma24 and for the diagnosis of benign adenoma diseases25,26. In order to prove this concept, current attempts are being made to detect APA-associated mutations including KCNJ5 using ssAVS samples and a high performance next generation sequencer7,11,19,27, which may contribute to future APA treatments. Liquid-biopsied cells may also provide researchers with the opportunity to perform molecular analyses on IHA, which is currently not possible because the disease cannot be treated surgically. In addition to the liquid biopsy method, pure tumor outflow samples may be useful for metabolomics study to identify novel steroid biomarkers.
The critical technical steps of ssAVS method are to: (i) Identify each tributary vein during central adrenal venography. (ii) during venography, use a small amount of contrast medium (0.1 - 0.3 mL) and flush it gently to avoid adrenal hemorrhage. (iii) Advance the guidewire gently and without too much force to avoid penetrating tributary veins. (iv) Terminate the method immediately when adrenal hemorrhage occurs or is suspected.
The selection of a parent catheter is also critical for the success of ssAVS. Regarding cAVS of the RAV, Araki et al. recently reported the usefulness of a three-dimensional (3D)-type catheter with a 3D shape15. A catheter with the R shape (Figure 1A and 1B) and a catheter with the X shape (Figure 1C) are available as 3D-type catheters for ssAVS. Araki et al. analyzed several anatomical parameters based on CT findings with regards to the success rate of 3D-type catheters15. In univariate analyses (i) a shorter "short diameter of the inferior vena cava (IVC)" (ii) larger "ratio of the long diameter to short diameter of the IVC" (iii) smaller "transverse angle of the RAV" (iv) smaller "modified transverse angle of the RAV", and (v) smaller "vertical angle of the RAV" correlated with the success rate in the RAV. In a multivariate analysis, only (iv) a smaller "modified transverse angle of the RAV" was an independent predictor of successful RAV catheterization. They concluded that the findings of the multivariate analysis may be due to the stability of the catheter in the IVC; namely, the width of 3D-type catheters (red bidirectional arrow in Figure 1A and 1C) fits well in the "long diameter of the IVC", thereby stabilizing these catheters. Overall, when the "long diameter of the IVC" is shorter than 25 mm, use MK Adrenal-R, otherwise MK X.
Overall, the significance of ssAVS is: (i) its contribution to the advancement of hormone excess disease research (ii) its promotion of partial adrenalectomy by isolating a hormone-producing lesion to the level of an adrenal segment (see Case #1) (iii) its promotion of the assessment of cortisol excesses by collecting pure adrenal efflux (see Case #2) (iv) its detection of actual idiopathic hyperaldosteronism (see Case #3) (v) its contribution to advancing the development of novel therapies, which may include trans-venous segmental ablation of the adrenals. Thus, if performed as described herein, any angiographer may successfully perform the ssAVS protocol in addition to cAVS and contribute to the advancement of research on and the treatment of adrenal hormonal excess diseases.
ssAVS with cAVS are routinely performed at Yokohama Rosai Hospital and Saitama Medical University for PA patients. Between October 2014 and September 2015, two angiographers (KM and SM) performed ssAVS on 125 cases (78 and 47 cases, respectively) with a 100 % success rate and within a reasonable time (58 - 130 min) without adrenal rupture or thrombosis that required surgery. In this method, an additional cost is incurred for the micro-catheter (10-fold more expensive in Japan than the conventional catheter) and PAC/PCC measurements of tributary samples. However, considering the clinical and scientific benefits of the procedure, the additional cost is justified, at least in industrialized countries. One marginal limitation of ssAVS and bilateral adrenalectomy is that it may not cure bilateral lesions and follow-up assessments are needed, which includes the evaluation of PA recurrence (see Case #1). However, this is also true for unilateral PA cases. Consequently, these results indicate that any angiographer has the ability to perform ssAVS with a high success rate by following the protocol provided in this video article. In order to promote the ssAVS method worldwide, hands-on training is always provided at Yokohama Rosai Hospital and Saitama Medical University. Please feel free to contact these institutions if you are interested in this method.
Disclosures
The authors have nothing to disclose.
Acknowledgements
We acknowledge funding support from the Japan Society for the Promotion of Science (KAKENHI-Grants to K.N [26893261]), Okinaka Memorial Institute for Medical Research (to KN), and Japanese Ministry of Health, Labour and Welfare (to TN); Mrs. Kohichi Kamata and Atsushi Seyama at the Department of Pathology in the Saitama Medical University International Medical Center for their excellent assistance in histochemical and immunohistochemical staining; as well as Dr. Celso E. Gomez-Sanchez for providing the mouse monoclonal CYP11B2 antibody and rat monoclonal CYP11B1 antibody.
Materials
| Name | Company | Catalog Number | Comments |
|---|---|---|---|
| CX-Catheter EII with the MK Adrenal-R shape | Silux co. | GA-E5F-MK1-60S | 3D catheter for right adrenal venous sampling |
| CX-Catheter EII with the MK X shape | Silux co. | GA-E5F [MK-X] 60S | 3D catheter for right adrenal venous sampling |
| Aqua V3 guidewire | Formec co. | HS8616H | guidewire for the micro-catheter |
| Gold Crest Micro-Catheter | Goldcrest Medic Inc. | KCV29S1S-OM | micro-catheter for superselective adrenal venous sampling |
| CX catheter-UII with the MK ADRENAL-L shape | Silux co. | GA-US5F [MK-3] B65S | 3D catheter for left adrenal venous sampling |
References
- Funder, J. W., et al. The Management of Primary Aldosteronism: Case Detection, Diagnosis, and Treatment: An Endocrine Society Clinical Practice Guideline. J Clin Endocrinol Metab. 101 (5), 1889-1916 (2016).
- Akehi, Y., et al. Proposed diagnostic criteria for subclinical Cushing's syndrome associated with adrenal incidentaloma. Endocr J. 60 (7), 903-912 (2013).
- Choi, M., et al. K+ channel mutations in adrenal aldosterone-producing adenomas and hereditary hypertension. Science. 331 (6018), 768-772 (2011).
- Beuschlein, F., et al. Somatic mutations in ATP1A1 and ATP2B3 lead to aldosterone-producing adenomas and secondary hypertension. Nat Genet. 45 (4), 440-444 (2013).
- Scholl, U. I., et al. Somatic and germline CACNA1D calcium channel mutations in aldosterone-producing adenomas and primary aldosteronism. Nat Genet. 45 (9), 1050-1054 (2013).
- Azizan, E. A., et al. Somatic mutations in ATP1A1 and CACNA1D underlie a common subtype of adrenal hypertension. Nat Genet. 45 (9), 1055-1060 (2013).
- Tamura, A., et al. Somatic KCNJ5 mutation occurring early in adrenal development may cause a novel form of juvenile primary aldosteronism. Mol Cell Endocrinol. 441, 134-139 (2017).
- McLachlan, M. S., Roberts, E. E. Demonstration of the normal adrenal gland by venography and gas insufflation. Br J Radiol. 44 (525), 664-671 (1971).
- Nishikawa, T., Matsuzawa, Y., Saito, J., Omura, M. Is it Possible to Extirpate Cardiovascular Events in Primary Aldosteronism After Surgical Treatment. Jpn Clin Med. 1, 21-23 (2010).
- Nishikawa, T., Matsuzawa, Y., Saito, J., Omura, M. Super-selective ACTH-stimulated adrenal venous sampling can simply differentiated bilateral adrenal hyperplasia from bilateral adenomas in primary aldosteronism. 35th Meeting of the International Aldosterone Conference, Washington D.C, , 35-36 (2009).
- Nishimoto, K., et al. Case Report: Nodule Development From Subcapsular Aldosterone-Producing Cell Clusters Causes Hyperaldosteronism. J Clin Endocrinol Metab. 101 (1), 6-9 (2016).
- Miekos, E. Anatomical basis of radiodiagnosis of the adrenal gland. Int Urol Nephrol. 11 (3), 193-200 (1979).
- Omura, M., Saito, J., Matsuzawa, Y., Nishikawa, T. Supper-selective ACTH-stimulated adrenal vein sampling is necessary for detecting precisely functional state of various lesions in unilateral and bilateral adrenal disorders, inducing primary aldosteronism with subclinical Cushing's syndrome. Endocr J. 58 (10), 919-920 (2011).
- Nishikawa, T., Omura, M., Saito, J., Matsuzawa, Y. Primary aldosteronism: comparison between guidelines of the Japanese and the US Endocrine Society. Expert Rev. Endocrinol. Metab. 7 (6), 637-645 (2012).
- Araki, T., Okada, H., Onishi, H. Does catheter shape influence the success of right adrenal venous sampling? The interaction of catheter shape to anatomical factors on CT. Jpn J Radiol. 34 (11), 707-717 (2016).
- Young, W. F., Stanson, A. W. What are the keys to successful adrenal venous sampling (AVS) in patients with primary aldosteronism? Clin Endocrinol (Oxf). 70 (1), 14-17 (2009).
- Harsha, A., Trerotola, S. O. Technical aspects of adrenal vein sampling. J Vasc Interv Radiol. 26 (2), 239(2015).
- Nishikawa, T., et al. Guidelines for the diagnosis and treatment of primary aldosteronism--the Japan Endocrine Society 2009. Endocr J. 58 (9), 711-721 (2011).
- Nishimoto, K., et al. Immunohistochemistry of aldosterone synthase leads the way to the pathogenesis of primary aldosteronism. Mol Cell Endocrinol. , (2016).
- Nishimoto, K., et al. Adrenocortical zonation in humans under normal and pathological conditions. J Clin Endocrinol Metab. 95 (5), 2296-2305 (2010).
- Funder, J. W., et al. Case detection, diagnosis, and treatment of patients with primary aldosteronism: an endocrine society clinical practice guideline. J Clin Endocrinol Metab. 93 (9), 3266-3281 (2008).
- Heitzer, E., Auer, M., Ulz, P., Geigl, J. B., Speicher, M. R. Circulating tumor cells and DNA as liquid biopsies. Genome Med. 5 (8), 73(2013).
- Alix-Panabieres, C., Pantel, K. Clinical Applications of Circulating Tumor Cells and Circulating Tumor DNA as Liquid Biopsy. Cancer Discov. 6 (5), 479-491 (2016).
- Pinzani, P., et al. Detection of circulating tumor cells in patients with adrenocortical carcinoma: a monocentric preliminary study. J Clin Endocrinol Metab. 98 (9), 3731-3738 (2013).
- Pantel, K., et al. Circulating epithelial cells in patients with benign colon diseases. Clin Chem. 58 (5), 936-940 (2012).
- Chiu, L. Y., et al. Identification of differentially expressed microRNAs in human hepatocellular adenoma associated with type I glycogen storage disease: a potential utility as biomarkers. J Gastroenterol. 49 (8), 1274-1284 (2014).
- Nishimoto, K., et al. Aldosterone-stimulating somatic gene mutations are common in normal adrenal glands. Proc Natl Acad Sci U S A. 112 (33), E4591-E4599 (2015).
Reprints and Permissions
