We report two cell synchronization protocols that provide a context for studying events related to specific phases of the cell cycle. We show that this approach is useful for analyzing the regulation of specific genes in an unperturbed cell cycle or upon exposure to agents affecting the cell cycle.
Method Article
Studying Cell Cycle-regulated Gene Expression by Two Complementary Cell Synchronization Protocols
* These authors contributed equally
In This Article
Summary
Abstract
The gene expression program of the cell cycle represents a critical step for understanding cell cycle-dependent processes and their role in diseases such as cancer. Cell cycle-regulated gene expression analysis depends on cell synchronization into specific phases. Here we describe a method utilizing two complementary synchronization protocols that is commonly used for studying periodic variation of gene expression during the cell cycle. Both procedures are based on transiently blocking the cell cycle in one defined point. The synchronization protocol by hydroxyurea (HU) treatment leads to cellular arrest in late G1/early S phase, and release from HU-mediated arrest provides a cellular population uniformly progressing through S and G2/M. The synchronization protocol by thymidine and nocodazole (Thy-Noc) treatment blocks cells in early mitosis, and release from Thy-Noc mediated arrest provides a synchronized cellular population suitable for G1 phase and S phase-entry studies. Application of both procedures requires monitoring of the cell cycle distribution profiles, which is typically performed after propidium iodide (PI) staining of the cells and flow cytometry-mediated analysis of DNA content. We show that the combined use of two synchronization protocols is a robust approach to clearly determine the transcriptional profiles of genes that are differentially regulated in the cell cycle (i.e. E2F1 and E2F7), and consequently to have a better understanding of their role in cell cycle processes. Furthermore, we show that this approach is useful for the study of mechanisms underlying drug-based therapies (i.e. mitomycin C, an anticancer agent), because it allows to discriminate genes that are responsive to the genotoxic agent from those solely affected by cell cycle perturbations imposed by the agent.
Introduction
Transition through all the phases of the cell cycle is coupled to a tightly regulated gene expression program. This coordinated "on and off" of gene transcription throughout the cell cycle is believed to be under the control of complex transcriptional regulatory systems, regulating not just the timing but also the levels of gene expression. Deregulation of key cell cycle components is known to contribute to the development of several diseases and is a well- established hallmark of tumorigenesis1,2. Genome-wide transcriptomic analyses carried out in yeast and mammalian cells have revealed that a large number of genes exhibit periodic gene expression patterns in the cell cycle, suggesting that transcriptional fluctuation during the cell cycle is a reflection of the temporal requirement of a given gene product in a precise phase3,4,5.
A major task in the study of cell cycle-regulated gene expression is the synchronization of cells into specific cell cycle phases. Cell synchronization helps to interpret association of a gene expression pattern to a particular cell cycle phase transition, and it has led to a better understanding of the regulation and function of numerous genes. Cell synchronization is also important for studying the mechanism of action of anticancer drugs, as chemotherapeutic agents are known to affect both gene expression as well as cell cycle kinetics6,7. Nevertheless, it is often difficult to determine whether gene expression differences resulting from treatment with these agents are a direct response to the treatment or are merely the consequence of changes in cell cycle profiles. To distinguish between these possibilities, gene expression should be analyzed in cells that have been synchronized prior to addition of the chemotherapeutic drug.
With the exception of some primary cells such as freshly isolated lymphoid cells -which constitute a homogeneous cell population synchronized in G08-, in vitro established cell lines grow asynchronously in culture. Under regular growth conditions, these asynchronously cycling cells are found in all phases of the cell cycle but, preferentially in G19. Therefore, this context does not provide an optimal scenario for functional or gene expression analyses in a specific cell cycle phase (e.g. G1, S etc.). Non-transformed immortalized cell lines (e.g. fibroblasts) can be synchronized with so-called physiological methods10. These methods are based on the retained primary cell features of non-transformed cells, such as cell-contact inhibition and growth factor dependency in order to continue cycling. Removal of serum in combination with contact inhibition renders non-transformed cells arrested at G0/G1. However, synchronized cell cycle entry and progression often requires subculture, which also involves artificial detachment of the cells and re-plating10. Most importantly, this method is not suitable for synchronization of transformed cell lines, the vast majority of established cell lines presently in use, characterized for lacking cell contact-mediated growth inhibition or response to growth factor withdrawal. Thus, it is clear that alternative methods are required for efficient cell synchronization in specific phases of the cell cycle. In general terms, the most frequently used synchronization methods are based on transient chemical or pharmacological inhibition of one defined point of the cell cycle, typically DNA synthesis or mitotic spindle formation. Inhibition of DNA synthesis synchronizes cells by arresting them in late G1 or early S phase. This can be achieved by the addition of compounds such as mimosine, an inhibitor of nucleotide biosynthesis11,12, aphidicolin, an inhibitor of DNA polymerases13,14, hydroxyurea, an inhibitor of ribonucleotide reductase15,16 or by excess amounts of thymidine17,18. On the other hand, inhibitors of microtubule polymerization, such as colchicine or nocodazole, are able to block mitotic spindle formation leading to cell synchronization at early M phase19,20,21.
In this work we describe a method involving two complementary synchronization protocols based on transient chemical inhibition for studying the expression of cell cycle-regulated genes at the mRNA level. This method is fundamental for defining the role of cell cycle genes in specific cell cycle processes. Furthermore, it provides a general frame for studying the impact of anticancer treatments in order to accurately detect drug responsive genes and to minimize misinterpretations derived from perturbations in cell cycle progression generated by these drugs.
Protocol
1. Cellular Synchronization, Release and Monitoring of Cell Cycle Progression
- Thymidine- and nocodazole-based (Thy-Noc) synchronization and release of U2OS cells from Mitosis
- Prepare required cell culture medium. U2OS cells are routinely grown in DMEM-Glutamine medium complemented with 10% (vol/vol) FBS (optional: 1% penicillin/streptomycin). Perform all the medium preparation and manipulation under sterile conditions and warm up complemented medium (from now on referred to as "complete medium") to 37 °C prior to use.
- Seed 2 x 10⁶ U2OS cells per 100 mm dish in 10 mL complete culture medium. In order to calculate the number of dishes needed, take into account that each 100 mm dish typically provides enough mitotic cells to re-plate approximately 5 wells of a 6-well plate (0.2 - 0.25 x 10⁶ cells/well) (see Figure 1B). Two wells per selected time point are required in the experiment (1 well for RNA extraction and 1 well for cell cycle monitoring). Additionally, a third well may be collected per time point for protein analysis.
NOTE: Plate cells in the evening (around 7 pm) so that subsequent steps can be carried out during working hours the following days. Include 2 additional wells of asynchronously growing cells to define FACS analysis compensation settings. - Let cells attach by incubating 100 mm dishes at 37 °C in a humidified atmosphere with 5% CO2 for 24 h.
- For the thymidine block, prepare a 200 mM thymidine stock solution by dissolving 145.2 mg thymidine powder in 3 mL H2O (or equivalent amounts) and sterilize the solution by filtration through a 0.2 µm pore size filter. Slight warming might help dissolve thymidine. Add 100 μL of the freshly prepared 200 mM stock to each 100 mm culture dish (final concentration 2 mM). Incubate cells with thymidine for 20 h at 37 °C in a humidified atmosphere with 5% CO2.
NOTE: Treat cells in the evening (around 7 pm), to have time to perform both thymidine release and nocodazole block the following day. - To release from the thymidine block, remove thymidine containing growth medium in the afternoon of the following day (3 pm); wash cells twice with pre-warmed 1x PBS and add 10 mL of complete medium to each 100 mm dish. Incubate cells for 5 h at 37 °C in a humidified atmosphere with 5% CO2.
- For mitotic cell arrest, add nocodazole to a final concentration of 50 ng/mL (8 pm). Prepare a stock solution by dissolving nocodazole powder in DMSO (e.g. 5 mg/mL) and store frozen at -20 °C. Incubate cells with nocodazole for no longer than 10 - 11 h at 37 °C in a humidified atmosphere with 5% CO2.
- Release from nocodazole-mediated arrest in early M phase (mitotic shake-off) and collection of samples at several time points (starting at 6-7 am).
- Detach rounded (mitotic) cells by shaking each plate and gently pipetting nocodazole-containing growth medium. Collect medium with detached cells from each 100 mm plate into 50 mL sterile tubes, centrifuge (300 x g, 5 min, room temperature (RT)) and wash cells twice by adding 1x PBS followed by centrifugation. Use of cold PBS or PBS plus nocodazole is recommended to avoid mitotic slippage (see Discussion section).
- Resuspend mitotic cells gathered from each 100 mm plate in 10 mL of complete medium. Save 2 mL for RNA extraction and 2 mL for FACS analysis for the 0 h time point (approximately 0.2-0.25 x 10⁶ cells per sample).
- Re-plate remaining mitotic cells for subsequent time points in 6-well plates (2 mL/well; 0.2-0.25 x 10⁶ cells/well).
NOTE: Remember that 2 wells are required per selected time point (1 for RNA and 1 for FACS analysis).
- Collect samples at selected time points. Every 1.5 to 3 h is recommended in order to obtain an adequate profile of the cell cycle progression.
- For RNA extraction, remove medium, rinse well with 2 mL pre-warm 1x PBS and add 1 mL of suitable RNA isolation reagent (e.g. TRIzol) in the well (perform this last step in a safety cabinet for chemicals). Pipette up and down to detach and lyse cells, transfer cell lysate to a 1.5 mL microcentrifuge tube, incubate 5 min at RT and store tube at -80 °C until further use.
- For FACS analysis, rinse well with 2 mL pre-warm 1x PBS, add pre-warmed Trypsin-EDTA solution (0.3 mL/well) to detach cells, block Trypsin-EDTA by adding 1 mL complete medium and collect each sample in a separate 15 mL tube.
- Centrifuge cells (300 x g, 5 min, RT), save cellular pellet and discard supernatant. In order to fix cells, resuspend cells in 1 mL of chilled 70% (v/v) ethanol in 1x PBS by gently vortexing tubes, and place them on ice for approximately 15 min prior to storing at 4 °C or to staining for further analysis by FACS (described in steps 1.4 - 1.5).
- HU-based synchronization and release of U2OS cells from G1/S boundary
- Prepare complete cell culture medium as described in step 1.1.
- Seed 0.25 x 10⁶ U2OS cells per well in 6 well plates (2 mL complete culture medium per well). In order to calculate the number of wells needed for the experiment, take into account that 2 wells will be required per selected time point (1 well for RNA extraction and 1 well for cell cycle monitoring) and that 2 additional wells of asynchronously growing cells are needed to define FACS analysis compensation settings.
- Let cells attach by incubating 6-well plates overnight (O/N) at 37 °C in a humidified atmosphere with 5% CO2.
- Remove complete medium from wells the following morning and add 2 mL of pre-warmed FBS-free DMEM-Glutamine medium per well. Incubate cells for an additional 24 h at 37 °C in a humidified atmosphere with 5% CO2.
NOTE: Perform this step in all wells except for 2 (those saved to define FACS settings). Serum withdrawal step can be omitted if efficient synchronization is achieved by simply incubating cells with HU. - G1/S cell cycle arrest with HU.
- Prepare fresh HU stock solution (500 mM) prior to each use. Add 2 mL H2O to 76.06 mg of HU powder and mix until thoroughly dissolved. Sterilize the solution by filtration through a 0.2 µm pore size filter. Mix 50 mL of complete medium with 400 μL of filter-sterilized HU stock solution for a final HU concentration of 4 mM.
- Remove medium from all wells except from the 2 wells needed for defining FACS settings and replace with a freshly prepared 4 mM HU-containing complete medium (2 mL/well).
- Incubate cells for 24 h in HU-containing medium at 37 °C in a humidified atmosphere with 5% CO2.
- Release of cells from HU-mediated arrest. Remove HU-containing medium from wells and rinse wells twice with pre-warmed 1x PBS (2 mL each time). Add 2 mL of complete medium per well. Collect 2 samples for the 0 h time point (1 for RNA extraction and 1 for cell cycle arrest verification by FACS) as well as 2 samples saved for FACS settings. Place remaining wells in the incubator.
- Collect samples every 1.5 to 3 h in order to obtain an adequate distribution of cell cycle progression. At each time point, perform sample processing (for RNA extraction and for FACS analysis) as described in 1.1.8.1-1.1.8.2.
- Treatment with DNA damaging agents
NOTE: Whenever the aim is to elucidate the effect of a compound (e.g. DNA damaging agents) in cell cycle events, any of the previously described synchronization methods can be combined with treatment of cells with the genotoxic agent. In order to select the synchronization method, it is important to consider the phase of the cell cycle that we would like to analyze. In general, Thy-Noc procedure may be suitable to study the effect of a compound in G1 phase or S phase entry while HU-mediated synchronization may be more suitable to study the impact in S to G2 phases or in the entry to mitosis.- Analysis of the effect of genotoxic agents in G1 phase or S phase entry
- Synchronize cells as described in 1.1.2. to 1.1.6.
- Release cells from nocodazole and re-plate them as described in 1.1.7. Incubate them at 37 °C in a humidified atmosphere with 5% CO2 for 3 h to let them attach prior to adding agent (required incubation period may vary depending on the cell line).
- Add agent and collect samples as previously described in 1.1.8.
- Analysis of the effect of genotoxic agents in S-G2 phases or M entry
- Synchronize cells as described in 1.2.2. to 1.2.5.
- Release cells from HU as described in 1.2.6. and add agent straightaway.
- Collect samples as previously described in 1.8.
- Analysis of the effect of genotoxic agents in G1 phase or S phase entry
- Monitoring of cell synchronization and progression through the cell cycle by propidium iodide (PI) staining and FACS analysis
NOTE: Samples collected at all time points together with those required to define FACS settings can be stored at 4 °C once they have been fixed (as mentioned in 1.1.8.2). Perform staining with PI solution followed by FACS analysis for all the samples of the experiment simultaneously. PI intercalates into the major groove of double-stranded DNA producing a highly fluorescent signal when excited at 535 nm with a broad emission peak around 600 nm. Since PI can also bind to double-stranded RNA, it is necessary to treat the cells with RNase for optimal DNA resolution.- Prepare freshly made PI staining solution. A PI stock solution can be prepared by dissolving PI powder in PBS (e.g. 5 mg/mL). Store the stock solution at 4 °C (in darkness). Staining solution is composed of PI (140 μM), sodium citrate (38 mM) and Triton X-100 (0.01% v/v).
- Warm up an appropriate surface (e.g. oven) to 37 °C.
- Centrifuge fixed cells (450 x g, 5 min, RT), decant supernatant (ethanol) and wash once with 1x PBS.
- Centrifuge cells again, remove PBS and add 300 μL of PI staining solution per sample (except to one of the samples for FACS settings; add PBS to this sample instead).
- Transfer cells to FACS Tubes (5 mL round-bottom polystyrene tubes).
- Add 1 μL of RNase A to each sample, mix and incubate samples for 30 min in darkness at 37 °C. Samples can be stored protected from light at 4 °C for a maximum of 2 - 3 days.
- Analyze DNA content in samples by flow cytometry. Define FACS analysis compensation settings with PI-stained asynchronous sample. Use blank sample (without PI staining solution) to check for autofluorescence. Basics of PI staining-mediated analysis of DNA content by flow cytometry has been previously described9.
- Determination of mitotic index by double phospho-H3 (Ser 10)/PI staining
NOTE: Cells undergoing mitosis can be easily detected by flow cytometry with antibodies specific for phospho-histone H3 in Serine 10 (pH3). A concomitant PI staining is useful to determine DNA content-based distribution of the cell population. 5 samples are required for the optimal configurations of FACS settings: blank, PI-only, pH3-only, secondary antibody-only and double staining.- Centrifuge fixed cells (450 x g, 5 min, 4 °C) and discard supernatant. The following steps are described to perform staining in 15 mL tubes.
- Wash cells by adding 1 mL PBS-T (PBS + 0.05% Tween-20) to the pellet and centrifuge (450 x g, 5 min, 4 °C). Remove supernatant.
- Add anti-pH3 antibody diluted (1:500) in 100-200 µL of PBS-T + 3% BSA, and incubate with rocking for 2 h at RT (or O/N at 4 °C).
- Add 2 mL PBS-T (PBS + 0.05% Tween-20) and centrifuge (450 x g, 5 min, 4 °C). Remove supernatant.
- Wash once more by adding 2 mL PBS-T to the pellet, centrifuge and discard supernatant.
- Add secondary antibody (anti-rabbit AlexaFluor 488 in the case of selected pH3 antibody) diluted (1:500) in 100-200 µL of PBS-T + 3% BSA and incubate with rocking for 1 h at RT (or O/N at 4 °C). Protect samples from light.
- Wash twice with PBS-T (2 mL) by centrifugation as described in step 1.5.4.
- Perform PI staining as described (steps 1.4.1 to 1.4.6).
2. Sample Collection and Processsing for Gene Expression Analysis
- Take 1.5 mL microcentrifuge samples in the RNA isolation reagent out of the freezer and let them thaw at RT inside a safety cabinet for chemicals.
- Add 400 µL of chloroform to each sample and shake vigorously (but do not vortex) until complete mixing. Incubate samples for 5 min at RT.
- Centrifuge tubes for 15 min (≥8,000 x g, 4 °C) in a benchtop microcentrifuge.
- Transfer the aqueous (upper) phase to a new 1.5 mL microcentrifuge tube and register the transferred volume (in order to simplify the procedure, it is recommended to collect equal volumes in all samples of the experiment).
- Add 1 volume of 100% ethanol slowly (drop by drop) to the aqueous phase while mixing. Do not centrifuge.
- Perform the next steps with the commercial RNA mini prep kit. Pipet up to 700 µL of each sample, including any precipitate that may have formed, into a spin column in a 2 mL collection tube (provided by the manufacturer).
- Close the lid and centrifuge (≥ 8,000 g, RT) for 15 s. Discard the flow-through. Repeat previous step with the remaining sample (if any).
- Follow manufactures´ instructions for RNA washing and elution (elute each sample in 30 - 40 µl nuclease-free H2O in order to achieve an appropriate RNA concentration for next step).
- Determine RNA concentration and purity of samples by absorbance measurements (a A260/280 ratio of 2.0-2.1 indicates good purity of the RNA sample). Store RNA samples at -80 °C until use for RT-qPCR analysis.
- For RNA conversion into cDNA and subsequent quantitative-PCR, take 1 µg RNA per sample and prepare retrotranscriptase reaction according to manufacturers' instructions. Obtained cDNA samples can be stored at 4 °C (for a couple of days) or at -20 °C (for longer periods of time).
NOTE: Sample preparation, primer design and other considerations for real time-PCR have been extensively described in the literature22,23.
Results
Schematic representation of Thy-Noc and HU-based protocols for cell synchronization.
Figure 1 summarizes the steps required for U2OS cell synchronization and subsequent sample collection in order to verify progression through the cell cycle and to perform gene expression analyses.
Phospho-H3 and PI staining are good evaluation parameters to select synchronization methods.
Cell synchronization procedures must be assessed and optimized for each cell line due to inherent heterogeneity of cultured cells. Synchronization in mitosis is typically achieved with Thy-Noc protocol, and enrichment of mitotic cells after treatment with nocodazole can be assessed with antibodies specific for phosphorylated histone H3 (pH3), a typical mitotic marker. Identification of pH3 positive cells allows discriminating between mitotic cells and those with a 4C-DNA content not undergoing mitosis (all of which are considered a "G2" population by PI staining). In U2OS cells Thy-Noc protocol lead to a significant enrichment of a population with 4C DNA content (Figure 2A, upper left graph, blue population by PI staining), and the relative fraction of mitotic cells within this population was routinely quite pure (approximately 91% compared to 2% in asynchronous cells). Release from nocodazole results in a synchronized progression of cells to the next G1 phase, as determined by the accumulation of a population with 2C DNA content (Figure 2A, upper right graph, green population by PI staining) and the near disappearance of pH3 positive mitotic cells (Figure 2A, lower right graph). Thus, pH3 staining results confirmed the suitability of Thy-Noc protocol for mitotic synchronization of U2OS cells.
Synchronization of U2OS cells in G1/S was tested with thymidine and hydroxyurea, two widely used synchronyzers. Enrichment in different phases of the cell cycle was determined by PI staining and FACS analysis and percentage of cells summarized in a table (Figure 2B). A 24 h exposure of U2OS cells to Thy (2mM) was inefficient in arresting cells in G1/S boundary (Figure 2B), whereas treatment with HU or with a double round of thymidine (DT) resulted in a satisfactory arrest. However, only HU-treated cells recovered completely from arrest and progressed adequately through the cell cycle. By contrast, DT block induced a permanent G1 arrest in a significant fraction of the cell population (13.3% of cells in G1 at 6 h time point with DT vs. 3.1% with HU-based protocol), which negatively affected cell synchrony. Thus, exposure to HU is recommended as an appropriate G1/S synchronization method for U2OS cells.
Thy-Noc- and HU-based protocols are complementary for cell synchronization.
As shown in Figure 3A (0 h time point), treatment by Thy-Noc protocol efficiently arrested U2OS cells in M-phase entry (population with 4C DNA content, shown in blue) and treatment by HU protocol arrested cells in G1/S boundary (population with 2C DNA content, shown in green/red). Upon removal of the drugs, cells entered into and progressed through the cell cycle in a synchronized fashion. Cells recovered from Thy-Noc treatment were first observed in early G1 phase (population in green) and subsequently transitioned through G1 and up to S phase in a uniform fashion. Cells recovered from HU treatment progressed synchronously through S (population in red) and G2/M. Progression through the next cell cycle was concomitant to the loss of synchronicity. Consequently, time points over 15 hours were not included in these analyses because of loss of synchronicity after this time point.
Western blot analysis of Cyclin E1 (a G1/S cyclin) and Cyclin B1 (a G2/M cyclin), two proteins whose levels are tightly regulated in the cell cycle, and of the mitotic marker pH3, confirmed the cell cycle phase of each time point analyzed by FACS (Figure 3B). As expected, cells in M phase (corresponding to 0 h time point of Thy-Noc-synchronized cells) and cells in G2 to M phase (9 h to 12 h time point of HU-synchronyzed cells) showed a dramatic accumulation of cyclin B1 and undetectable levels of cyclin E1. Furthermore, Cyclin B1 levels were low to undetectable in G1 phase (3 h upon release from nocodazole) and gradual accumulation was observed as cells progressed through S (after Thy-Noc release) and into G2 (after HU release). Strong pH3 labeling of cells at 0 h upon Thy-Noc synchronization confirmed the enrichment of cells arrested at mitosis at this time point. Slight increase on pH3 levels at 12 h after release from HU revealed that the majority of cells with 4C DNA content were still in G2 while the proportion of cells in mitosis was increased at 15 h time point. By contrast, the expression pattern of Cyclin E1 showed a progressive accumulation from early G1 to S-phase entry (Thy-Noc procedure) and gradual disappearance in G2/M phase (HU procedure).
Expression of genes that are differentially regulated in the cell cycle can be accurately analyzed with a combination of Thy-Noc- and HU-based synchronization.
As a proof-of-concept that cell cycle-regulated gene expression analysis is best assayed by a combination of two cell synchronization methods, mRNA expression of two E2F family members known to have different expression kinetics in the cell cycle (E2F1 and E2F7) were examined by reverse transcriptase quantitative PCR (RT-qPCR). To this end, Thy-Noc and HU synchronization protocols were used, as summarized in Figure 1, and cell cycle distribution was monitored by flow cytometry as shown in Figure 3A. Figure 4 shows E2F1 (upper two graphs) and E2F7 (lower two graphs) mRNA profiles through the cell cycle. The transcriptional regulation profile of E2F1 encoding gene was best observed with Thy-Noc procedure, whereby E2F1 expression started to gradually increase from early G1 phase to reach a peak at late G1 phase (9 h after Thy-Noc release; green background). Its levels decreased thereafter, concomitant with an entry into S and G2 phases (red and blue backgrounds). By contrast, E2F7 gene expression kinetics were best detected after HU-based synchronization (lower graph; red background), with a peak expression at 6 h from release (corresponding to S to G2 phase transition). Thy-Noc procedure, on the other hand, was suitable for observing induction of E2F7, but not its downregulation. Of note, extension of the analysis beyond 15 h time point reproduced E2F1 and E2F7 mRNA expression profiles of earlier time points, although with a diminished range of mRNA variation (data not shown). Altogether, these results confirm the importance of working with a properly synchronized cell population to assess not only gene expression kinetics but also the accurate amplitude of changes in the mRNA levels.
Cell synchronization provides a better understanding of the gene expression program impacted by anticancer therapy.
To analyze the effect of the antitumor drug mitomycin C (MMC) in cell cycle dynamics as well as in gene expression, U2OS cells were first synchronized with HU and subsequently treated with MMC. Exposure to this genotoxic agent activated a checkpoint in G2 phase that was evident after 15 h of exposure (Figure 5A, lower row, blue peak). By contrast, untreated cells progressed normally through G1 at this time point (Figure 5A, upper row, green peak). Long-term MMC treatment (36 h) revealed a permanent arrest of cells in G2 phase while cells with no MMC treatment exhibited a cell cycle distribution that was similar to that shown by the asynchronous cell population.
E2F1 and p21Cip1 (CDKN1A) were chosen for gene expression analysis in MMC-treated cells (Figure 5B), given their different cell cycle-dependent regulation. Expression of E2F1 is G1 phase-dependent, as described in Figure 4, whereas induction of p21Cip1 expression is coupled to cell cycle arrest/checkpoint activation24. As shown in Figure 5B (upper left graph), E2F1 gene expression kinetics were similar in the presence or absence of MMC, as cells progressed through G1/S and into S phase. Differences in E2F1 gene expression among MMC treated and untreated cells were observed after 15 h of exposure to MMC, whereby MMC-treated cells expressed lower E2F1 mRNA levels than control cells (Figure 5B, compare solid and dashed lines). However, despite the clear difference in expression, it cannot be concluded that MMC downregulates E2F1 expression, because cell cycle profiles of MMC treated and untreated cells are clearly different in these later time points, owing to a sustained G2 phase arrest imposed by MMC. In fact, low E2F1 mRNA levels after the 15 h time point in MMC-exposed cells probably reflect an effect of the drug in cell cycle dynamics, rather than an effect of MMC in E2F1 transcriptional regulation.
In contrast to E2F1, p21Cip1 is an MMC-responsive gene. Elevated levels of p21Cip1 were detected at HU-imposed G1/S arrest, indicating G1 checkpoint activation by HU (Figure 5B, 0 h time point) and its expression decreased thereafter in non-MMC treated cells, consistent with an unperturbed cell cycle progression after release from arrest. By contrast, MMC treatment led to elevated p21Cip1 mRNA levels (Figure 5B, upper right graph, solid line) while cells were accumulating in G2 phase (9 h of MMC exposure). Despite the fact that cell cycle profiles were similar at the 9 h time point in control and MMC treated cells, gene expression analysis shows a fundamental difference. MMC exposed cells displayed an activated G2 checkpoint, evidenced by induction of p21Cip1 expression, whereas untreated cells were undergoing an unperturbed transition through G2, with low p21Cip1 levels.
Data obtained by flow cytometry analysis (Figure 5A) and data resulting from RT-qPCR (Figure 5B, upper graphs) were combined in a single graph for each of the selected genes (Figure 4B, lower graphs). mRNA expression levels where shown as relative height of the bars while the cell cycle distribution of cells for each sample was illustrated with the proportion of colors: green for G1 phase (2C DNA content), blue for G2 phase (4C DNA content) and red for S phase (intermediate DNA content). This combined method of graphical representation may be helpful for interpreting cell cycle distribution and gene expression analyses.
In summary, gene expression analysis coupled to a culture synchronization method allowed the identification of a genotoxic agent-responsive gene (p21Cip1) and led to propose that changes observed in E2F1 expression between cells treated and untreated with the agent were indirect, and possibly related to differences in cell cycle distribution of cells.

Figure 1: Overview of Two Complementary Cell Synchronization Protocols: Thymidine-Nocodazole and Hydroxyurea. (A) Graphical representation of the mammalian cell cycle indicating the points at which cell cycle arrest is achieved by cell synchronization methods. Thy-Noc-based procedure blocks cells in early mitosis (M) while HU blocks cells at the G1/S boundary. (B) Schematic representation of Thy-Noc protocol of cell synchronization. Shown are the steps typically used for gene expression analysis and cell cycle monitoring in U2OS cells. (C) Schematic representation of HU-based protocol of cell synchronization. Shown are the steps typically used for gene expression analysis and cell cycle monitoring in U2OS cells. A shorter synchronization procedure omitting serum starvation can also be applied if optimal synchronization is already achieved by a 24 h exposure to HU. Please click here to view a larger version of this figure.

Figure 2: Assessment of Suitable Synchronization Methods. (A) Asynchronous and Thy-Noc synchronized U2OS cell cultures were subjected to pH3 staining in order to assess the fraction of mitotic cells in each case. Simultaneous PI staining allowed monitoring of the DNA content of cells. In the asynchronous population only a minimal fraction of cells with 4C DNA content (in blue) were positive for the mitosis marker. By contrast, Thy-Noc protocol efficiently accumulated cells in mitosis (positive for the pH3 staining) and allowed proper progression to the next G1 phase (in green) upon removal of nocodazole (3 h time point). Percentage of cells in each phase is summarized in the table and labeled with colors according to those employed in the PI histograms: green for 2C DNA content cells (G1), blue for cells with 4C DNA content (including G2 and M cells and named as G2 in the histograms in order to simplify the figure, and red for cells with intermediate DNA content (S). (B) Thymidine and HU were assessed for their cell cycle synchronization efficiency in U2OS cells. Cells were treated with thymidine (one or two rounds), or with HU for 24 h, and cell synchronization was examined by PI staining and FACS analysis. Summit was used for FACS data analysis. Please click here to view a larger version of this figure.
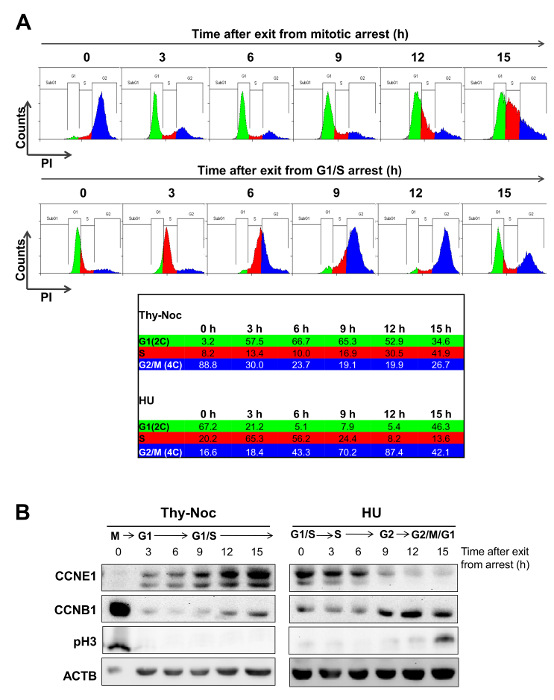
Figure 3: Outlining the Temporal Frame for Uniform Progression of Cells after Thy-Noc- and HU-mediated Synchronization. (A) U2OS cells were synchronized in M phase by Thy-Noc protocol (upper row) or in G1/S transition by HU protocol (lower row). Cell cycle progression was monitored by PI staining and FACS analysis of the DNA content of cells every 3 h after the release from chemicals. Summit was used for FACS data analysis. Cells released from Thy-Noc-mediated arrest entered synchronously in early G1 phase after 3 h, and progressed uniformly up to S phase at subsequent time points. Cells released from HU-mediated arrest transitioned synchronously through S and G2 phases. Cells collected 15 h after release represented the limits for cell synchronization, as progression to next phase was only achieved by a fraction of the population. (B) Cell synchronization was monitored by Western blot analysis by collecting protein samples every 3 h and up to 15 h following release. Expression kinetics of Cyclin E1 (CCNE1), a cyclin predominantly accumulated through the S phase, cyclin B1 (CCNB1), mainly present from G2 to M phase and pH3, a marker for mitotic cells, corroborated cell cycle distribution profiles observed by flow cytometry. Actin B (ACTB) was used as an endogenous loading control because its levels are not cell cycle-dependent. (As modified from Mitxelena et al.8). Please click here to view a larger version of this figure.

Figure 4: Study of Cell Cycle Phase-dependent Transcription of E2F family Members by Complementary Cell Synchronization Methods. U2OS cells were arrested in G2/M by Thy-Noc protocol or in G1/S by HU treatment, and samples were collected for RNA extraction and FACS analysis every 3 h up to 15 h upon release from arrest. Gene expression analysis by RT-qPCR revealed an E2F1 expression profile circumscribed mainly to G1 (upper left graph) while E2F7 gene expression profile was shifted to S phase, with a gradual downregulation through G2 phase (lower right graph). TBP was used as endogenous non-cell cycle-regulated gene to calculate relative changes in mRNA levels and results were represented as the mean values and standard deviation (SD). Progression through cell cycle was determined by PI staining and FACS analysis of the DNA content of cells. Cell cycle phases were represented as background colors in graphs: black (arrest at early mitosis), green (G1 phase), red (S phase) and blue (G2 phase). Please click here to view a larger version of this figure.
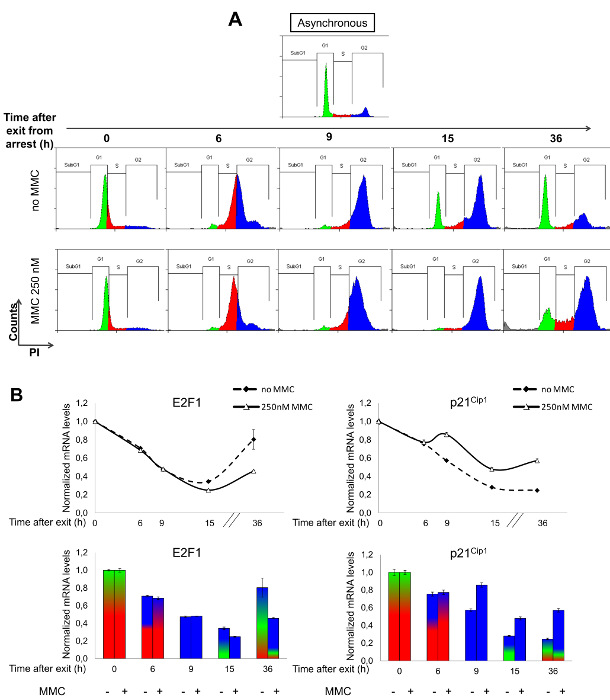
Figure 5: Impact of MMC on Gene Expression and Cell Cycle Progression. U2OS cells were treated with HU for 24 h, and MMC (250 nM) was added immediately after release from HU-mediated G1/S arrest. Samples for FACS analysis and gene expression analysis were collected at indicated time points. (A) Progression through the cell cycle was determined by PI staining and FACS analysis of DNA content by Summit software. MMC induced a moderate delay in the progression through S phase (red population) and a permanent arrest in G2 phase (blue population), as shown by the absence of cells in G1 (green population) after 15 h of treatment (lower row) compared to non-treated (upper row) cells. (B) E2F1 and p21Cip1 gene expression analysis in MMC treated or untreated cells was performed at the mRNA level by RT-qPCR. Oxa1L was used as an endogenous non-MMC-responsive gene and results were represented as mean values and SD. Upper graphs represent relative mRNA levels of selected genes after release from HU and addition of MMC. Lower graphs combine data obtained by FACS analysis and RT-qPCR. Please click here to view a larger version of this figure.
Discussion
Analysis of fine-tune regulated genes involved in transient and specific roles in the cell cycle requires a uniform cell population. Many researchers routinely use long-established tumor cell lines for these purposes, and a variety of methods have been developed to obtain synchronous (or partially synchronous) cell populations, with the aim to accumulate as many cells as possible in defined cell cycle phases. Moreover, strong efforts have been undertaken to improve and optimize well-established synchronization approaches. Nevertheless, all synchronization protocols have drawbacks, which can be attributable to heterogeneity of cell cultures, to suboptimal efficiency of the synchronization procedures, or to secondary effects that chemical synchronizers have in cell function, among others. These limitations must be taken into account when applying cell synchronization protocols. Researchers need to identify the most suitable synchronization methods for their specific cell type or experiment. Even cultivating different cell lines in exactly the same way, resulting synchronization rates may differ due to several reasons. On the one hand, length of the cell cycle may vary depending on the selected cell line; on the other hand, the same inhibitor may have contrasting effects on different cell lines due to particular characteristics of each cell line25. Furthermore, selected inhibitor concentration and exposure time must always be adjusted to each cell line in order to avoid or minimize non-desirable side-toxicity26. Even after optimization of all these aspects, 100% accumulation of cells in a given cell cycle phase is never achieved, and asynchrony increases gradually after removal of the chemical27. Thus, it is important to understand that synchronization methods obtain at best partial cell population enrichments in a particular time frame.
In this work two synchronization procedures (Thy-Noc and HU) have been optimized for their use in U2OS cells, both of which are extensively used for cell synchronization assays28,29,30. For arresting cells in M phase, a combination of thymidine and nocodazole worked efficiently in U2OS cells. Given the cytotoxic nature of nocodazole, it was important to determine the exposure time and dose of this inhibitor in order to obtain not only a highly synchronized cell population but also optimal cell survival. Prior exposure to thymidine (or theoretically any other similar compound such as hydroxyurea) led to an enrichment of the cell population in G1 and S phases, thereby decreasing the required nocodazole exposure time. For arresting cells in G1/S, several possibilities were considered, including double thymidine block, a method that is very efficient in synchronization of several cell-lines31,32. However, thymidine was discarded given its disappointing results in U2OS. One round of thymidine treatment only arrested a fraction of cells, whereas two rounds of thymidine treatment efficiently blocked the majority of cells in G1/S, but a G1 population was maintained after release from thymidine and cell cycle progression did not proceed uniformly. By contrast, hydroxyurea treatment provided good G1/S blocking results and uniform progression of cells through S and into G2.
Cell cycle phase distribution should be examined whenever performing cell synchronization experiments (e.g. by propidium iodide staining or pH3 labeling followed by FACS analysis, or by immunoblotting of cell cycle phase-specific proteins)16,33,34, in order to better interpret gene expression results. An incorrect synchronization efficiency or slight inter-experimental differences in the progression through the cell cycle may lead to wrong conclusions. For example, nocodazole treatment is known to cause failure of mitotic checkpoint function under certain conditions. This gives rise to a population of cells with 4C DNA content but negative for mitotic markers34 that "slips" mitotic division and returns to interphase with a 4C content35. The emergence of this subset of cells, which can be detected by immunostaining with anti-phospho-H3 antibodies (see Figure 2A) may be minimized by the use of cold PBS for the nocodazole washing steps. Another effect associated with the use of chemical inhibitors that impacts cell synchrony is checkpoint activation associated with exposure to these compounds36,37, a mechanism by which the cell actively arrests progression through the cell cycle until it can ensure that processes previous to that precise point (e.g. correct DNA replication, spindle assembly), are resolved 38. For a synchronization method to be adequate, the arrest must be not only efficient but also completely reversible. Thus, after release of cell cycle inhibitors it is important to analyze whether the effects of the inhibitor have been reverted, for example by analyzing expression of checkpoint markers, such as p21CIP. Figure 5B shows that hydroxyurea-synchronized U2OS cells efficiently resolved the checkpoint, because p21CIP levels were reduced to basal expression after release.
In U2OS cells, the enrichment percentages upon cell cycle arrest fall within the range reported by other studies on cell synchronization29,30,39: around 85% of cells with 4C DNA content (PI staining) and approximately 90% of those in mitosis (pH3 positive labeling) upon thymidine-nocodazole treatment, and around 80-90% of G1/S cells after hydroxyurea treatment. Release from cell cycle arrest typically drives proper progression through the next one or two phases in a uniform manner, although synchronization is invariably lost after several hours and cells are unable to complete an entire cell division cycle in a synchronized manner. Therefore, in order to get a full picture of all the phases of the cell cycle, the protocol proposed in this work makes use of two synchronization methods from different parts of the cell cycle. As shown in Figure 3A, each individual protocol did not ensure synchronicity over an entire cell cycle. Thy-Noc-based synchronization provided an appropriate frame for processes occurring in G1 to S phases, while cells released from HU were suitable for the analysis of events taking place during S and G2/M. The complementarities of the selected two procedures were demonstrated by the analysis of two members of the E2F transcription factor family (Figure 4), supporting the idea that combination of two methods that synchronize in different phases of the cell cycle is a powerful approach to accurately establish cell cycle-regulated gene expression patterns and to better understand their physiological role.
A compelling application of cell synchronization procedures focuses on evaluating the impact of potential therapeutic agents. The effect of pharmaceutical compounds, such as those with antitumor activity is often studied in asynchronous cell populations. Under these settings it is possible to determine the implication of the selected drug in the induction of several processes such as cell death, cell cycle arrest or senescence7,40. However, selection of asynchronous cell settings for identification of precise molecular events regulating such processes may lead to incomplete or partially wrong conclusions. This point, which is often overlooked, has been illustrated in the present work by analyzing the effect of the chemotherapeutic drug MMC on E2F1 and p21Cip1 gene expression (Figure 5). Overall, combination of cell synchronization and treatment with genotoxic agents provides a suitable context in which to study the expression of genes that are responsive to the genotoxic agent and to discriminate from those affected by cell cycle perturbations imposed by the agent.
Disclosures
The authors have nothing to disclose.
Acknowledgements
We thank members of the Zubiaga and the Altmeyer laboratories for helpful discussions and for technical support. This work was supported by grants from the Spanish Ministry (SAF2015-67562-R, MINECO/FEDER, UE), the Basque Government (IT634-13 and KK-2015/89), and the University of the Basque Country UPV/EHU (UFI11/20).
Materials
| Name | Company | Catalog Number | Comments |
|---|---|---|---|
| DMEM, high glucose, GutaMAX supplement | Thermo Fisher Scientific | 61965-059 | |
| FBS, qualified, E.U.-approved, South America origin | Thermo Fisher Scientific | 10270-106 | |
| Penicillin-Streptomycin (10,000 U/mL) | Thermo Fisher Scientific | 15140-122 | |
| 0.25% Trypsin-EDTA (1x), phenol red | Thermo Fisher Scientific | 25200-072 | |
| Thymidine | SIGMA | T1895-5G | Freshly prepared. Slight warming might help dissolve thymidine. |
| Nocodazole | SIGMA | M-1404 | Stock solution in DMSO stored at -20 ºC in small aliquots |
| Hydroxyurea | SIGMA | H8627 | Freshly prepared |
| Mitomycin C from Streptomyces caespitosus | SIGMA | M4287 | 1.5 mM stock solution in sterile H2O protected from light and stored at 4 ºC |
| Dimethyl sulfoxide | SIGMA | D2650 | |
| Propidium iodide | SIGMA | P4170 | Stock solution in sterile PBS at 5 mg/ml, stored at 4 º C protected from light. |
| PBS pH 7.6 | Home made | ||
| Ethanol | PANREAC | A3678,2500 | |
| Chloroform | SIGMA | C2432 | |
| Sodium Citrate | PANREAC | 131655 | |
| Triton X-100 | SIGMA | T8787 | |
| RNAse A | Thermo Fisher Scientific | EN0531 | |
| TRIzol Reagent | LifeTechnologies | 15596018 | |
| RNeasy Mini kit | QIAGEN | 74106 | |
| High-Capacity cDNA Reverse Transcription Kit | Thermo Fisher Scientific | 4368814 | |
| Anti-Cyclin E1 antibody | Cell Signaling | 4129 | 1:1000 dilution in 5% milk, o/n, 4 ºC |
| Anti-Cyclin B1 antibody | Cell Signaling | 4135 | 1:1000 dilution in 5% milk, o/n, 4 ºC |
| Anti-β-actin | SIGMA | A-5441 | 1:3000 dilution in 5 % milk, 1 hr, RT |
| Anti-pH3 (Ser 10) antiboty | Millipore | 06-570 | Specified in the protocol |
| Secondary anti-rabbit AlexaFluor 488 antibody | Invitrogen | R37116 | Specified in the protocol |
| Secondary anti-mouse-HRP antibody | Santa Cruz Biotechnology | sc-3697 | 1:3000 dilution in 5 % milk, 1 hr, RT |
| Forward E2F1 antibody (human) TGACATCACCAACGTCCTTGA | Biolegio | Designed by PrimerQuest tool (https://eu.idtdna.com/site) | |
| Reverse E2F1 antibody (human) CTGTGCGAGGTCCTGGGTC | Biolegio | Designed by PrimerQuest tool (https://eu.idtdna.com/site) | |
| Forward E2F7 antibody (human) GGAAAGGCAACAGCAAACTCT | Biolegio | Designed by PrimerQuest tool (https://eu.idtdna.com/site) | |
| Reverse E2F7 antibody (human) TGGGAGAGCACCAAGAGTAGAAGA | Biolegio | Designed by PrimerQuest tool (https://eu.idtdna.com/site) | |
| Forward p21Cip1 antibody (human) AGCAGAGGAAGACCATGTGGAC | Biolegio | Designed by PrimerQuest tool (https://eu.idtdna.com/site) | |
| Reverse p21Cip1 antibody (human) TTTCGACCCTGAGAGTCTCCAG | Biolegio | Designed by PrimerQuest tool (https://eu.idtdna.com/site) | |
| Forward TBP antibody (human) reference gene | Biolegio | Designed by PrimerQuest tool (https://eu.idtdna.com/site) | |
| Reverse TBP antibody (human) | Biolegio | Designed by PrimerQuest tool (https://eu.idtdna.com/site) | |
| Forward Oxa1L antibody (human) reference gene CACTTGCCAGAGATCCAGAAG | Biolegio | Designed by PrimerQuest tool (https://eu.idtdna.com/site) | |
| Reverse Oxa1L antibody (human) CACAGGGAGAATGAGAGGTTTATAG | Biolegio | Designed by PrimerQuest tool (https://eu.idtdna.com/site) | |
| Power SYBRGreen PCR Master Mix | Thermo Fisher Scientific | 4368702 | |
| FACS Tubes | Sarstedt | 551578 | |
| MicroAmp Optical 96-Well Reaction Plate | Thermo Fisher Scientific | N8010560 | |
| Corning 100 mm TC-Treated Culture Dish | Corning | ||
| Corning Costar cell culture plates 6 well | Corning | 3506 | |
| Refrigerated Bench-Top Microcentrifuge | Eppendorf | 5415 R | |
| Refrigerated Bench-Top Centrifuge Jouan CR3.12 | Jouan | 743205604 | |
| NanoDrop Lite Spectrophotometer | Thermo Scientific | ND-LITE-PR | |
| BD FACSCalibur Flow Cytometer | BD Bioscience | ||
| QuantStudio 3 Real-Time PCR System | Thermo Fisher Scientific | A28567 |
References
- Beato, M., Sánchez-Aguilera, A., Piris, M. A. Cell cycle deregulation in B-cell lymphomas. Blood. 101 (4), 1220-1235 (2003).
- Chen, H. Z., Tsai, S. Y., Leone, G. Emerging roles of E2Fs in cancer: an exit from cell cycle control. Nat Rev Cancer. 9 (11), 785-797 (2009).
- Cho, R. J., et al. Transcriptional regulation and function during the human cell cycle. Nat Genet. 27 (1), 48-54 (2001).
- Peña-Diaz, J., et al. Transcription profiling during the cell cycle shows that a subset of Polycomb-targeted genes is upregulated during DNA replication. Nucleic Acids Res. 41 (5), 2846-2856 (2013).
- Grant, G. D., et al. Identification of cell cycle-regulated genes periodically expressed in U2OS cells and their regulation by FOXM1 and E2F transcription factors. Mol Biol Cell. 24 (23), 3634-3650 (2013).
- Minderman, H., et al. In vitro and in vivo irinotecan-induced changes in expression profiles of cell cycle and apoptosis-associated genes in acute myeloid leukemia cells. Mol Cancer Ther. 4 (6), 885-900 (2005).
- McKenna, E., Traganos, F., Zhao, H., Darzynkiewicz, Z. Persistent DNA damage caused by low levels of mitomycin C induces irreversible cell senescence. Cell Cycle. 11 (16), 3132-3140 (2012).
- Infante, A., et al. E2F2 represses cell cycle regulators to maintain quiescence. Cell Cycle. 7 (24), 3915-3927 (2008).
- Cecchini, M. J., Amiri, M., Dick, F. A. Analysis of cell cycle position in mammalian cells. J Vis Exp. (59), (2012).
- Schorl, C., Sedivy, J. M. Analysis of cell cycle phases and progression in cultured mammalian cells. Methods. 41 (2), 143-150 (2007).
- Lalande, M. A reversible arrest point in the late G1 phase of the mammalian cell cycle. Exp Cell Res. 186 (2), 332-339 (1990).
- Park, S. Y., et al. Mimosine arrests the cell cycle prior to the onset of DNA replication by preventing the binding of human Ctf4/And-1 to chromatin via Hif-1α activation in HeLa cells. Cell Cycle. 11 (4), 761-766 (2012).
- Ikegami, S., et al. Aphidicolin prevents mitotic cell division by interfering with the activity of DNA polymerase-alpha. Nature. 275 (5679), 458-460 (1978).
- Baranovskiy, A. G., et al. Structural basis for inhibition of DNA replication by aphidicolin. Nucleic Acids Res. 42 (22), 14013-14021 (2014).
- Adams, R. L., Lindsay, J. G. Hydroxyurea reversal of inhibition and use as a cell-synchronizing agent. J Biol Chem. 242 (6), 1314-1317 (1967).
- Mitxelena, J., Apraiz, A., Vallejo-Rodríguez, J., Malumbres, M., Zubiaga, A. M. E2F7 regulates transcription and maturation of multiple microRNAs to restrain cell proliferation. Nucleic Acids Res. , (2016).
- Bootsma, D., Budke, L., Vos, O. Studies on synchronous division of tissue culture cells initiated by excess thymidinE. Exp Cell Res. 33, 301-309 (1964).
- Galgano, P. J., Schildkraut, C. L. G1/S Phase Synchronization using Double Thymidine Synchronization. CSH Protoc. (2), (2006).
- Edwin Taylor, W. Kinetics of inhibition and the binding of h3-colchicine. J Cell Biol. 25, 145-160 (1965).
- Zieve, G. W., Turnbull, D., Mullins, J. M., McIntosh, J. R. Production of large numbers of mitotic mammalian cells by use of the reversible microtubule inhibitor nocodazole. Nocodazole accumulated mitotic cells. Exp Cell Res. 126 (2), 397-405 (1980).
- Matsui, Y., Nakayama, Y., Okamoto, M., Fukumoto, Y., Yamaguchi, N. Enrichment of cell populations in metaphase, anaphase, and telophase by synchronization using nocodazole and blebbistatin: a novel method suitable for examining dynamic changes in proteins during mitotic progression. Eur J Cell Biol. 91 (5), 413-419 (2012).
- Nolan, T., Hands, R. E., Bustin, S. A. Quantification of mRNA using real-time RT-PCR. Nat Protoc. 1 (3), 1559-1582 (2006).
- Thornton, B., Basu, C. Real-time PCR (qPCR) primer design using free online software. Biochem Mol Biol Educ. 39 (2), 145-154 (2011).
- Abbas, T., Dutta, A. p21 in cancer: intricate networks and multiple activities. Nat Rev Cancer. 9 (6), 400-414 (2009).
- Kung, A. L., Sherwood, S. W., Schimke, R. T. Cell line-specific differences in the control of cell cycle progression in the absence of mitosis. Proc Natl Acad Sci U S A. 87 (24), 9553-9557 (1990).
- Borel, F., Lacroix, F. B., Margolis, R. L. Prolonged arrest of mammalian cells at the G1/S boundary results in permanent S phase stasis. J Cell Sci. 115 (Pt. 14, 2829-2838 (2002).
- Knehr, M., et al. A critical appraisal of synchronization methods applied to achieve maximal enrichment of HeLa cells in specific cell cycle phases). Exp Cell Res. 217 (2), 546-553 (1995).
- Zhu, W., Giangrande, P. H., Nevins, J. R. E2Fs link the control of G1/S and G2/M transcription. EMBO J. 23 (23), 4615-4626 (2004).
- Whitcomb, E. A., Dudek, E. J., Liu, Q., Taylor, A. Novel control of S phase of the cell cycle by ubiquitin-conjugating enzyme H7. Mol Biol Cell. 20 (1), 1-9 (2009).
- Bruinsma, W., Macurek, L., Freire, R., Lindqvist, A., Medema, R. H. Bora and Aurora-A continue to activate Plk1 in mitosis. J Cell Sci. 127, 801-811 (2014).
- Thomas, D. B., Lingwood, C. A. A model of cell cycle control: effects of thymidine on synchronous cell cultures. Cell. 5 (1), 37-42 (1975).
- Whitfield, M. L., et al. Identification of genes periodically expressed in the human cell cycle and their expression in tumors. Mol Biol Cell. 13 (6), 1977-2000 (2002).
- Lim, S., Cdks Kaldis, P. cyclins and CKIs: roles beyond cell cycle regulation. Development. 140 (15), 3079-3093 (2013).
- Tapia, C., et al. Two mitosis-specific antibodies, MPM-2 and phospho-histone H3 (Ser28), allow rapid and precise determination of mitotic activity. Am J Surg Pathol. 30 (1), 83-89 (2006).
- Andreassen, P. R., Martineau, S. N., Margolis, R. L. Chemical induction of mitotic checkpoint override in mammalian cells results in aneuploidy following a transient tetraploid state. Mutat Res. 372 (2), 181-194 (1996).
- Wei, F., Xie, Y., He, L., Tao, L., Tang, D. ERK1 and ERK2 kinases activate hydroxyurea-induced S-phase checkpoint in MCF7 cells by mediating ATR activation. Cell Signal. 23 (1), 259-268 (2011).
- Kubota, S., et al. Activation of the prereplication complex is blocked by mimosine through reactive oxygen species-activated ataxia telangiectasia mutated (ATM) protein without DNA damage. J Biol Chem. 289 (9), 5730-5746 (2014).
- Hartwell, L. H., Weinert, T. A. Checkpoints: controls that ensure the order of cell cycle events. Science. 246 (4930), 629-634 (1989).
- St-Denis, N. A., Derksen, D. R., Litchfield, D. W. Evidence for regulation of mitotic progression through temporal phosphorylation and dephosphorylation of CK2alpha. Mol Cell Biol. 29 (8), 2068-2081 (2009).
- Min, A., et al. RAD51C-deficient cancer cells are highly sensitive to the PARP inhibitor olaparib. Mol Cancer Ther. 12 (6), 865-877 (2013).
Reprints and Permissions
