

Summary
Immunolabeling methods to analyze distinct populations of microtubules in the developing zebrafish brain are described here, which are broadly applicable to other tissues. The first protocol outlines an optimized method for immunolabeling stable and dynamic microtubules. The second protocol provides a method to image and quantify nascent microtubules specifically.
Abstract
Microtubules (MTs) are dynamic and fragile structures that are challenging to image in vivo, particularly in vertebrate embryos. Immunolabeling methods are described here to analyze distinct populations of MTs in the developing neural tube of the zebrafish embryo. While the focus is on neural tissue, this methodology is broadly applicable to other tissues. The procedures are optimized for early to mid-somitogenesis-stage embryos (1 somite to 12 somites), however they can be adapted to a range of other stages with relatively minor adjustments. The first protocol provides a method to assess the spatial distribution of stable and dynamic MTs and perform a quantitative analysis of these populations with image-processing software. This approach complements existing tools to image microtubule dynamics and distribution in real-time, using transgenic lines or transient expression of tagged constructs. Indeed, such tools are very useful, however they do not readily distinguish between dynamic and stable MTs. The ability to image and analyze these distinct microtubule populations has important implications for understanding mechanisms underlying cell polarization and morphogenesis. The second protocol outlines a technique to analyze nascent MTs specifically. This is accomplished by capturing the de novo growth properties of MTs over time, following microtubule depolymerization with the drug nocodazole and a recovery period after drug washout. This technique has not yet been applied to the study of MTs in zebrafish embryos, but is a valuable assay for investigating the in vivo function of proteins implicated in microtubule assembly.
Introduction
Microtubules (MTs) are polymers of α- and β-tubulin that assemble into linear protofilaments, several of which combine to form a hollow tube1,2. MTs are polarized structures, with fast-growing plus ends and slow-growing minus ends that are anchored at the centrosome or other microtubule-organizing center (MTOC)3. De novo MT formation is initiated by nucleation at the γ-tubulin ring complex (γ-TURC), which provides a template for MT assembly4. In any given cell, two populations of MTs can be distinguished that turn over at different rates. Dynamic MTs explore their cellular environment by switching between phases of growth and shrinkage in a process known as dynamic instability5. Unlike dynamic MTs, stable MTs are non-growing and have a longer half-life than dynamic MTs6.
Decades of research in cell biology has provided a sophisticated array of tools to study MT structure and function and resulted in a large body of knowledge on these cytoskeletal elements. For instance, MTs play a central role in the establishment and maintenance of cell polarity, which is attributable not only to their intrinsic polarity, but also to the differential subcellular distribution of stable versus dynamic MTs7,8. In contrast, far less is understood about MT architecture and function in more complex three-dimensional (3-D) environments, such as the vertebrate embryo, in part due to the challenge of imaging the MT cytoskeleton at high resolution. Despite this limitation, the recent generation of GFP-expressing transgenic lines that label MTs or transient expression of fluorescently-tagged MT markers has increased our understanding of the dynamic changes that MTs undergo and their cellular and developmental role in the zebrafish embryo. The entire MT network can be imaged in transgenic lines in which tubulin is either directly labeled9 or tubulin polymers are indirectly labeled using MT-associated proteins Doublecortin-like-kinase (Dclk) or Ensconsin (EMTB)10,11. Other lines (and constructs) have been generated that enable assessment of MT intrinsic polarity by specifically labeling MT plus ends or centrosome-anchored minus ends11,12,13,14. The power of these tools lies in the ability to study MT dynamics in live, developing organisms. Such studies have revealed, for example, the spatial and dynamic distribution of MTs in specific cell populations, the orientation of mitotic spindles in tissues undergoing morphogenesis (an indicator of the plane of cell division), the polarity of the MT polymer as it relates to processes such as cell elongation and migration, and MT growth rate determined by comet speed9,13,15. The limitation of these tools is that they do not readily discriminate between stable and dynamic MT populations.
Drawing from the rich cell biology literature, immunolabeling methods to image stable and dynamic MTs in the zebrafish embryo are described here, which are complementary to the use of transgenic lines. The widespread use of such immunolabeling methods in the zebrafish has been somewhat hampered by the difficulty in preserving MT integrity during the fixation procedure. Protocol 1 outlines an optimized method for immunolabeling total, dynamic, and stable MTs in cross sections of the developing zebrafish hindbrain. Furthermore, a straightforward method using commercially available software is described to quantify these MT populations. Stable MTs are distinguished from dynamic MTs based on several post-translational modifications of α-tubulin, such as acetylation and detyrosination, which accumulate on stable MTs over time16,17. In the zebrafish embryo, acetylation occurs on ciliary and axonal MTs but not on stable interphase MTs18, limiting the usefulness of this marker to a subset of stabilized MTs. In contrast, detyrosination appears to occur on all stable MTs in the zebrafish embryo18. This post-translational modification exposes the carboxy-terminal glutamic acid of α-tubulin (detyrosinated tubulin)18 and can be detected using anti-Glu-tubulin19. Although detyrosination occurs preferentially on stable MTs, experimental evidence indicates that this post-translational modification is a result of, rather than a cause of, MT stability16. The reciprocal MT population, composed of dynamic MTs, is distinguished using an antibody, anti-Tyr-tubulin, that specifically recognizes the tyrosinated form of α-tubulin19. Following immunolabeling with these markers and confocal imaging, the quantitative analysis of MTs (length, number, and relative abundance) can be performed in defined regions of the developing neural tube. A streamlined method is provided here for performing this analysis using 3-D image-processing software. This method can be applied to address questions regarding morphogenesis and the establishment or maturation of cell polarity20. Indeed, the elaboration of polarized arrays of stable MTs accompanies many developmental events, including photoreceptor morphogenesis21, epithelialization of cells in the developing neural tube18 and axon formation8.
Protocol 2 describes an in vivo adaptation of a cell biology assay to analyze MTs during their assembly phase (nucleation/anchorage and growth)22,23. Nascent MTs are nucleated at the centrosome and subsequently anchored to subdistal appendages of the mother centriole23. A method to analyze nascent MT regrowth following depolymerization is described. This protocol provides details on the nocodazole treatment to depolymerize MTs, the drug washout procedure and the post-treatment recovery period. MT re-growth is monitored at regular intervals post washout by immunolabeling with markers for total MTs (anti β-tubulin) alongside markers for the centrosome (anti γ-tubulin) and nucleus (4',6-diamidino-2-phenylindole (DAPI)), according to the general procedures described in Protocol 1. The MT depolymerization step of this protocol is essential as it enables assessment of de novo MT growth rather than extension of preexisting MTs. This technique is therefore distinct from other published procedures to measure MT growth rates (in absence of depolymerization) by using a plus tip marker such as end binding protein 3 fused to green fluorescent protein (EB3-GFP), as shown in Tran et al., 201211. Furthermore, this assay is particularly useful for analyzing embryos defective in de novo MT assembly, such as the previously reported NEDD1 mutants in which recruitment of γ-tubulin to the centrosome is impaired, resulting in incomplete neural tube formation and neuronal defects24.
Subscription Required. Please recommend JoVE to your librarian.
Protocol
Ethics Statement: The procedures described below follow the University of Maryland Baltimore County animal care guidelines.
1. Analysis of Stable and Dynamic MTs Using Immunolabeling (Protocol 1)
- Manual dechorionation of embryos prior to fixation
- Obtain freshly spawned embryos by pouring off excess system water and then collecting remaining embryos into a plastic Petri dish (refer to Table of Materials).
- Remove any debris from the system water and transfer embryos to a new dish filled with embryo medium (refer to Table of Materials) to ensure that the embryos develop in a clean environment.
- Allow the embryos to develop to the desired stage in a temperature-controlled incubator at 28.5 °C.
- Place embryos younger than 24 h post-fertilization (hpf) in a glass dish prior to dechorionation.
NOTE: Dechorionate embryos prior to fixation to maximize rapid penetration of the fixative and preserve MT integrity. Use embryo medium instead of system water to provide the additional Ca2+ required during dechorionation. - Manually remove the chorions from embryos while in Petri dish, using fine forceps under a dissecting microscope.
- Pinch a small area in the round, transparent chorion that encircles the embryo with a pair of forceps and gently pull forceps apart to create a rupture in the membrane.
- Enlarge the opening by delicately prying on the ruptured chorion using forceps. Be careful not to touch the embryo with the forceps as it could rupture.
- Fixation of staged embryos
- Transfer staged, dechorionated embryos to 1.5 mL centrifuge tubes. Remove as much embryo medium as possible using a glass Pasteur pipette.
NOTE: Perform fixation and drug treatments on young (mid-somitogenesis) embryos, prior to the formation of the neural centers mediating pain sensation, which require no additonal procedure to alleviate pain during euthanasia. Developmental stages are as defined in Kimmel et al., 199525. The 4-5 and 11-12 somite stages were used to obtain images for Figures 2 and 3. - Prepare 4% paraformaldehyde (PFA)/MT assembly buffer (MAB) fixative (refer to Table of Materials) by combining 1 mL 8% PFA per 1 mL 2X MAB and adding 2 µL 100% Triton X-100 per 1 mL of total volume.
CAUTION: Wear gloves while handling solutions containing PFA and Triton X-100, which are skin irritants. - Fix embryos in 1 mL 4% PFA/MAB fixative for 5 min at 28.5 °C. Aspirate the fixative with a pipette, replace it with 1 mL fresh fixative, and incubate for 3 h at room temperature (RT) on a rocker.
NOTE: Samples must be fixed quickly at their biological temperature (28.5 °C for zebrafish) to prevent temperature-dependent MT depolymerization.
- Transfer staged, dechorionated embryos to 1.5 mL centrifuge tubes. Remove as much embryo medium as possible using a glass Pasteur pipette.
- Aspirate fixative and add 1 mL 1x Tris-buffered saline with NP40 (TBS-NP40) buffer. Gently agitate at RT on a rocker three times for 5 min each. Store embryos at 4 °C in 1 mL fresh 1X TBS-NP40 for no more than 7 days.
CAUTION: Wear gloves when handling solutions containing NP-40, a skin irritant. - Sectioning embryos for immunolabeling
- Heat RT 4% low melting point (LMP) agarose embedding medium in a closed container until the solution becomes clear using a hot plate set to 50 °C positioned close to a dissecting microscope. Keep the container closed between samples and heated throughout the embedding process (steps 1.4.4-1.4.6).
- Transfer embryos from the 1.5 mL centrifuge tubes to a Petri dish using a glass pipette and fill it with 1X TBS-NP40.
- Remove the large yolk cells from somitogenesis stage embryos (4-5 and 11-12 somites) in the Petri dish using fine forceps under the magnification of a dissecting microscope26. Hold the embryo by the tail bud with one pair of forceps and peel away the yolk cells with the other pair in order to preserve the hindbrain tissue. Transfer the de-yolked embryos to an area of the Petri dish free of yolk debris.
NOTE: Embed embryos in the agarose-filled mold individually to prevent premature hardening of the LMP agarose. - Fill one 12 mm x 5 mm x 3 mm well of the sectioning mold with 200 µL melted LMP agarose using a micropipette. Perform the steps 1.4.5.-1.4.6. quickly (within 20 s of filling the mold) to embed embryo before the LMP agarose cools to RT and solidifies.
- Use fine forceps to transfer a de-yolked embryo by the tailbud from the Petri dish to the agarose-filled mold toward its tapered end under a dissecting microscope.
- Use fine forceps to orient the embryo into the mold such that the vibratome cuts in the desired plane. Create transverse sections by orienting the embryo such that the hindbrain tissue runs parallel to the length of the mold with its dorsal surface facing the edge and its anterior surface facing the tapered region end. Repeat steps 1.4.4-1.4.6 for the remaining embryos.
- Allow the agarose embedding to solidify for 5 min at RT.
- Generate 40 µm sections of the tallest axis of the agarose embedded embryos (steps 1.4.1-1.4.7) using a vibratome with the sectioning dish filled with 1x TBS-NP40. Transfer sections of interest to a 24-well plate in 500 µL 1x TBS-NP40 using fine forceps. Place the sections of only one embryo per well.
NOTE: Refer to reference18 for more details. Ensure that sections remain hydrated at all times in at least 250 µL of buffer and rock at low speed (10-25 rpm) for remaining steps to prevent separation from agarose embedding. Detergents present in the blocking and wash solutions should reduce the surface tension of the liquid medium and allow submersion of the sections. Check that sections remain in the wells during and after all manipulations. Use caution to prevent accidentally discarding sections during washes.
- Remove the buffer and add 500 µL of blocking solution. Rock for at least 1 h at RT.
NOTE: Use a blocking solution that contains 5% sera from the host species of each secondary antibody to be used (refer to Table of Materials). - Incubate in 300 µL primary antibodies diluted in blocking buffer for 36-72 h at 4 °C on a rocker. Wash twice in 600 µL 1x TBS-NP40 on a rocker for 30 min each, at RT.
NOTE: Double-label sections by incubating in primary antibodies against total MTs (anti β-tubulin, or anti α-tubulin) and stable MTs (anti-Glu-tubulin) or dynamic MTs (anti-Tyr tubulin). Select primary antibodies that have been raised in different host species when double labeling for total and post-translationally modified α-tubulin populations. Refer to Table of Materials for antibody dilutions. - Incubate in 300 µL of fluorophore-conjugated secondary antibodies diluted in blocking buffer on a rocker for 16-24 h, at 4 °C in the dark. Wash twice in 600 µL 1x TBS-NP40 on a rocker for 30 min each, at RT.
NOTE: Wrap the multi-well dish containing secondary antibody in foil from this point onwards and after each manipulation to prevent quenching. Select secondary antibodies that react with the host immunoglobulin of the primary antibody. Choose secondary antibody fluorophores that have separate, non-overlapping emission spectra. Refer to Table of Materials for antibody dilutions. - Incubate the embryos in 500 µL of DAPI solution on a rocker for 30 min, at RT. Wash three times in TBS-NP40 rocking at RT for 5 min each.
NOTE: Nuclear labeling provides cellular context for the MT quantification performed in step 1.12. - Place a drop of mounting medium with anti-fade agent on the center of a dust-free slide. Use fine forceps to transfer sections to the mounting medium droplet. Place a dust-free coverslip on top of the sample. Store slides in a dry, dark, and cool place, wrapped in foil, until imaging is performed.
NOTE: Circling the sections on the back of the slide using a fine-tipped permanent marker prior to imaging will help to identify sections when using the microscope. - Confocal Imaging
- Mount sections on an inverted laser scanning confocal microscope by affixing the slide to the stage with the coverslip facing the objective. Determine the appropriate optics (objective, laser, and channel settings such as gain and offset) on a control slide and keep them consistent between samples27. Avoid oversaturating the pixels to prevent data loss.
- Capture Z-stacks confocal images using channel settings for the selected secondary antibody fluorophores and save the image files27. Acquire Z-stacks for each section.
NOTE: Replicate the parameters used to acquire the images in Figures 2 and 3 by using the following acquisition settings: mode = XYZ; objective magnification = 63X oil immersion lens; objective numerical aperture = 1.4; Z-step = 0.1 µm; Z-depth = 16.23 µm. Use the following channel settings: DAPI excitation with 20% UV-range laser, emission filter range = 430-480 nm, photomultiplier (PMT) gain = 525 V, and PMT offset = -1.72%; 448 nm fluorophore (refer to Table of Materials) excitation with 20% 488 nm laser, emission filter range = 493-573 nm, PMT gain = 689 V, and PMT offset = -0.2%; 594 nm fluorophore excitation with 32% 594 nm laser, emission filter range = 608-706 nm, PMT gain = 768 V, and PMT offset = -6.8%. - Save raw data files with unique, descriptive file names and create a copy for editing in image analysis software.
- Compilation of Z-stacks for displaying maximum projections
- Open the data file copy using public domain 3-D image analysis software (e.g., ImageJ). Check that each channel appears as an individual image sequence (Z-stacks).
- Split image channels by using the following menu sequence : “Images/Color/Split channels”.
- Create a merged image by overlaying the channels of interest by using the following menu sequence: "Images/Color/Merge channels." Select the 594 nm, 488 nm, and DAPI channels to be false colored red, green, and blue, respectively. Check "Create composite" and select "OK"28.
NOTE: Omit the DAPI channel to better convey detail specific to MTs in a maximum projection as in Figure 2 and 3, by only selecting false colors for the other two channels. - Examine the merged Z-stack and make note of the beginning and ending positions of the inner best Z-planes for all visible channels. Dismiss the outer Z-planes that typically have suboptimal signal due to the uneven surfaces of the section. Refer to reference29 for details.
- Visualize the merged Z-stack as a single 2-D image by performing a maximum intensity projection of the Z-stack using the following 3-D image analysis menu sequence: "Images/Stack/Z-project." Enter the starting and ending positions of the inner best Z-planes from step 1.11.3 as the "Start slice" and "Stop slice," respectively. Select "Max intensity" as the projection type and click "OK". Refer to reference28 for more details.
- Analyzing MT labeling
- Open the commercial 3-D image analysis software. Select "Create Library" and provide a descriptive name for the image library. Click "Create." Drag raw image files generated from the confocal microscope into the library. Larger files require more time to transfer.
- Select a file to analyze. Choose "Extended Focus" from the "view" menu to display the channel-merged image in the main window.
- Adjust the thresholding by dragging the slider tool for each channel to the left or right until the background signal is reduced and the true signal is robust. Observe that each channel shows a true signal for the molecule labeled (e.g., DAPI channel showing oblong or mitotic nuclei but not auto-fluorescence from the cytoplasm or agarose).
- Select the "Freehand Region of Interest (ROI)" tool and outline the region of interest to be analyzed. Select the "Actions" tab followed by "Crop to Selection" to crop the image. Save the cropped image file under a new name. Click the "Measurements" tab to create the protocol for filtering specific objects relevant to the 3-D analysis.
- Drag "Find Objects" to the protocol window. Rename the first protocol "DAPI." Select the DAPI channel in the dropdown menu. Drag the following settings to the DAPI protocol and place them below "Find Objects" in the following order (Table 1): "Fill Holes in Objects"; "Separate Touching Objects"; "Exclude Objects by Size"; "Exclude Not Touching ROIs".
NOTE: The goal of the settings in Table 1 are to first set a threshold that discards signals whose distribution and size are inconsistent with the size of objects being analyzed. For example, eliminate a signal not large enough to be a nucleus when counting nuclei. - Perform the sequence (step 1.12.9) to assemble the remaining filters for β-tubulin and other markers using the settings in Table 1.
- Select "Measure" at the bottom of each protocol. Choose "Intensity and Volume Measurement" and "Skeletal Length" for all tubulin labeling, but only the former for the DAPI signal.
- Draw an ROI around the region to be measured. Observe the measurements under the "Summary" tab after the software processes the region. Copy the data and save them to a workable spreadsheet, as in Table 2. Create a back-up copy of the spreadsheet for later analysis.
- Select measurements of interest (for example, length of MT bundle, number of MT bundles/nucleus, as revealed with different markers) in the spreadsheet and analyze to determine the averages for each group.
NOTE: The average MT bundle length = the sum of the 'mean skeletal length for β-tubulin' for each embryo divided by the total number of embryos. Refer to row 20 of Table 2. Format the spreadsheet so that variables and experimental groups are easily graphed.
2. De Novo MT Assembly Assay (Protocol 2)
- Construct and test the multi-well flow-through apparatus (Figure 1) 2 days prior to the experiment.
NOTE: The apparatus enables simultaneous washout of multiple experimental groups following nocodazole treatment using supplies from Table of Materials. Silicone sealer requires at least 24 h of drying time before it poses no toxicity risk to the embryos.- Split a 50 mL centrifuge tube in half lengthwise, using a jig or band saw.
- Cut 7 semi-circles, with a radius of 3 cm, out of 70 µm nylon mesh and trim them to fit tightly into one half of the split centrifuge tube. Glue the semi-circles into the centrifuge tube parallel to the 10 mL gradation markings using aquarium-safe silicon sealer. Allow the device to dry for 2 days and rinse by soaking in a beaker of water for 2-3 h.
- Line the top (threaded) end of the cut centrifuge tube with modeling clay such that the height of the liquid retained in the flow-through device has a depth of ¼ inch (Figure 1, views 2 and 3).
- Prepare the washout apparatus by removing the plunger from a 50-mL syringe and inserting 12 inches of fine tubing into the tip. Push the tubing in as far as it will go and seal around the joint using modeling clay.
- Pre-wet the mesh using embryo medium to allow the liquid to run through the entire flow-through device. Angle the device on ice so that liquid pools in all compartments but still empties out the front where the clay rim is located. Using a ring stand, suspend the washout apparatus above the flow-through device on ice (Figure 1).
- Chill 200 mL of embryo medium on ice and pour enough into the washout apparatus to ensure that all air bubbles are cleared and that the flow rate is approximately 7 mL/min. Adjust the flow rate by changing the height of the syringe.
- Enzymatically dechorionate embryos
- Make a working solution of non-specific protease by diluting 1 mL of 10 mg/mL non-specific protease stock in 20 mL embryo medium.
- Perform chemical dechorionation on embryos 1 h prior to the timepoint when they are expected to reach the desired developmental stage. Digest chorions by removing embryo medium from 100 mm Petri dishes containing staged embryos and adding 20 mL of non-specific protease working solution.
- Incubate embryos at 37 °C for 5 min.
NOTE: Do not exceed 5 min or use a higher concentration of non-specific protease solution, as this will result in the embryos falling apart once treated with nocodazole. - Quickly pipette out non-specific protease and refill dishes with approximately 25 mL embryo medium. Repeat once.
- Using a 1-mL glass pipette, transfer embryos younger than 24 hpf to glass dishes to protect them from damage.
- Complete dechorionation by manually removing chorions using a pair of fine forceps, as described in step 1.1.5.
- Place glass Petri dishes containing dechorionated embryos in a 28.5 °C incubator for a minimum of 30 min until they reach the desired developmental stage.
- Depolymerize the existing MTs
- Prepare a working solution of 5 µg/mL nocodazole by combining 50 µL 1 mg/mL stock nocodazole with 10 mL ice cold embryo medium.
CAUTION: Use gloves when handling nocodazole, a skin irritant. - Exchange the embryo medium of the nocodazole treatment group with 10 mL cold nocodazole working solution. Place Petri dishes on ice for an appropriate time for the developmental stage (for example, 1 h for 4-5 somite embryos). Set aside untreated control embryos in a Petri dish on ice to be fixed alongside washout samples in step 2.3.4.1.
- Transfer embryos using a fire polished 1-mL glass pipette to the flow-through apparatus, using separate compartments for each experimental group. Start the nocodazole washout by pouring ice cold embryo medium into the top of the 50 mL syringe.
NOTE: Use at least 30 embryos per experimental group. Experimental groups could consist of control embryos or a variety of morpholino or RNA-injected embryos. The washout will require a total of about 150 mL of embryo medium to be added every 8-10 min. Washout the nocodazole while continuing to inhibit MT growth with ice. Keeping the embryos on ice is essential for the success of this assay because MTs are unstable at cold temperatures and cold delays the development in early embryos. - Allow MTs to regrow after 20 min of washout at RT by transferring embryos to glass Petri dishes containing warm (28.5 °C) embryo medium using a fire polished 1 mL glass pipette. As soon as the embryos are transferred, start a timer.
- Fix the control and washout embryos at 1 min, 5 min and 10 min by pipetting approximately 10 embryos into a 1.5 mL centrifuge tube filled with 1 mL 4% PFA/MAB fix (28.5 °C) and following the directions in step 1.2.3.
- Prepare a working solution of 5 µg/mL nocodazole by combining 50 µL 1 mg/mL stock nocodazole with 10 mL ice cold embryo medium.
- Prepare samples for immunolabeling as described in sections 1.3-1.5.
- Immunolabel floating sections and image embryos as described in sections 1.6-1.10 with the following changes to primary antibody specifications: use 1:500 rabbit anti-γ-tubulin and 1:200 mouse anti-β-tubulin.
- Process and analyze images using 3-D image analysis software, as described in step 1.12.
Subscription Required. Please recommend JoVE to your librarian.
Representative Results
Analysis of stable and dynamic MTs using immunolabeling
In Protocol 1, the distribution of MT sub-populations during early (neural keel) and late (neural rod) stages of neural tube development is revealed, using Glu-tubulin and Tyr-tubulin as markers for stable and dynamic MTs, respectively. Dynamic MTs predominate in the hindbrain at the neural keel stage (4-5 somites) (Figure 2A-D). As the keel develops into the neural rod (11-12 somites), a stage of enhanced epithelialization, qualitatively fewer MTs are immunoreactive with the anti-Tyr-tubulin antibody (Figure 2E-H), especially in the ventral rod. In contrast, Glu-tubulin is scattered and punctate throughout the neural keel (Figure 3A-D), but is enriched in the ventral neural rod along MT tracts (Figure 3E-H). Arrowheads point to specific MT bundles or structures where labeling is increased.
Although both anti-Glu-tubulin and anti-Tyr-tubulin antibodies were produced in the same host species (preventing a double labeling experiment), these results indicate that stable and dynamic MT markers rarely overlap in the zebrafish hindbrain. Firstly, the ventral neural rod has more stable (Figure 3F) than dynamic (Figure 2F) MTs. The trend is reversed in the dorsal neural rod, consistent with a model of zebrafish neurulation in which the dorsal tissue remains dynamic until the neural tube is formed20. Secondly, while mitotic spindles are fully labeled with the Tyr-tubulin antibody in the neural keel (Figure 2D, arrowheads), only the base of the spindle, coincident with the centrosome, is labeled with the stability marker Glu-tubulin (Figure 3D, arrowheads). β-tubulin immunofluorescence, common to both assays, informs the experimenter of the distribution of all MTs and provides a basis to dismiss non-specific labeling.
Measuring objects using 3-D image analysis software results in a large amount of data that can be organized into a convenient table (Table 2). To make length, count, and area measurements, we are using only a subset of the data that is available to analyze. One of the components of the data that we do not further analyze is the number of objects identified. This number is used as an internal quality control, as the number should not vary widely between like sections, and the ratio of nuclei to MTs should stay similar in a single treatment condition. An outlier is an indicator that either the analysis needs to be rerun with adjusted filters or that the image is too poorly labeled to analyze. Thus, all outlier images should be reanalyzed with adjusted settings. The outlier section should be examined for signs of poor labeling or physical damage that might result in unusual object counts. Once the analysis is finished and quality controlled, useful information can be recovered from the raw data such as average length of total MTs and stable MTs or the ratio of stable MTs to total MTs (Table 3). In addition to these measurements, many other metrics can be obtained using the 3-D image analysis software that can be used to draw inferences about MTs or their relation to other cellular structures (nucleus, centrosome, etc.).
De novo MT assembly assay
The nocodazole treatment depolymerizes MTs resulting in diffuse labeling (Figure 4A, 4D, and 4G). As the MTs regrow, they extend from the centrosome (Figure 4B, 4E, and 4H), however, this may not be obvious in a single plane due to their non-planar trajectories (Figure 4C, 4F, and 4I). Nevertheless, some image analysis software are capable of measuring lengths in 3-D, enabling an assessment of MT growth after the nocodazole washout (Table 4). An important observation that can be obtained from the dataset in Table 4 is that the mean length of MTs appears to increase over time after the nocodazole washout in all regions of the neural tube analyzed. As mentioned above, other types of metrics obtained from 3-D image analysis software can provide cellular context to interpret the MT data (for example, ratio of MTs per nucleus).
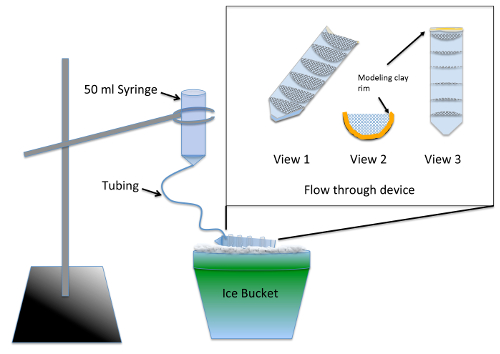
Figure 1: Illustration of washout apparatus for de novo MT assembly assay. The inset is a close-up of the flow-through device made from mesh glued into a 50-mL centrifuge tube cut lengthwise. The mesh compartmentalizes the flow-through device such that multiple experimental groups can be processed simultaneously. During use, embryo medium is added to the syringe and slowly flows through the tubing to fill the flow-through device, providing a constant rinse to all experimental groups. Please click here to view a larger version of this figure.

Figure 2: Use of immunolabeling to image dynamic MTs. Dechorionated embryos were fixed at appropriate stages (4-5 in A-D and 12-13 somites in E-H), transversely sectioned through the hindbrain, and immunolabeled with antibodies against β-tubulin (green in A and E) to mark all MTs and tyrosinated α-tubulin (red in B and F) to reveal dynamic MT populations. Highly dynamic MTs can be seen in the merged images (C, G) and their higher magnifications (D, H) as areas where yellow label is visible (arrowheads in D, H). Scale bars = 25 µm (A-C and E-G) and 10 µm (D and H). Please click here to view a larger version of this figure.

Figure 3: Use of immunolabeling to image stable MTs. Dechorionated embryos were fixed, sectioned through the hindbrain, and immunolabeled at appropriate stages (4-5 somites in A-D and 12-13 somites in E-H). Stable MTs are labeled with antibodies against the detyrosinated form of α-tubulin (Glu-tubulin) (red in B and F) while total MTs were visualized with a general β-tubulin antibody (green in A and E). Red and yellow signals in merged images (C, G) and their higher magnifications (D, H) represent areas of high MT stability (arrowheads in D, H). Scale bars = 25 µm (A-C and E-G) and 10 µm (D and H). Please click here to view a larger version of this figure.

Figure 4: Use of immunolabeling to image nascent MTs. Dechorionated embryos were fixed at 4-5 somites and transversely sectioned through the hindbrain. Sections were immunolabeled with β-tubulin (D, E, and F) to mark growing MTs and γ-tubulin (A, B, and C) to mark the nucleation point/centrosome. A dorsal region of the neural tube is boxed in (A, D; B, E and C-F) and shown at higher magnification (G, H, I, respectively) to reveal nuclei (DAPI, blue), centrioles (γ-tubulin, red) and total MTs (β-tubulin, green). White arrowheads: colocalization of MTs and centrioles; yellow arrowheads: the second centriole of a cell is visible. Scale bars = 25 µm (A-F) and 10 µm (G-I). Please click here to view a larger version of this figure.

Table 1: Default settings for filtering objects in 3-D image analysis software.

Table 2: Representative raw data set obtained using 3-D image analysis software to analyze stable MTs. Each column represents measurements from a single section. Min: smallest measurement; Max: largest measurement; SD: standard deviation; SE: standard error.

Table 3: Examples of datasets that can be obtained from 3-D image analysis software to quantify stable MTs. Select measurements of the mean length of total (β-tubulin) and stable (Glu-tubulin) MTs calculated by taking the average of the mean skeletal length for the relevant label from all samples (refer to Table 2) and the ratio of stable to total MTs (Glu-tubulin streaks per β-tubulin streaks) calculated by taking the average β-tubulin count divided by the average Glu-tubulin count.

Table 4: Examples of datasets that can be obtained from 3-D image analysis software to analyze de novo MT assembly. Representative results from the de novo MT assembly experiment, comparing datasets obtained for three recovery time points (1, 5 and 10 min) after nocodazole washout. For each time point, measurements obtained for nuclear count, centrioles (γ-tubulin puncta), number of total MTs (β-tubulin streaks), are shown for selected regions of the imaged analyzed (cross section of the developing neural tube).
Subscription Required. Please recommend JoVE to your librarian.
Discussion
There are currently many methods for imaging MT dynamics in early zebrafish development, ranging from live imaging of tagged molecules to immunolabeling of fixed tissue11,12,13,14. Although MTs in a single cell can exist in either dynamic or stable states, epithelialization is a process in which MTs are progressively stabilized over time. Using markers for stable and dynamic MTs offers a way to visualize this phenomenon. The method presented here leverages the power of 3-D imaging software to quantify the transition from dynamic to stable MT populations in a cross section of embryonic zebrafish tissue. In Protocol 2, the method is used to label a distinct population of nascent MTs and follow their nucleation and growth overtime.
MTs are notoriously difficult to image in their native state due to their propensity to depolymerize. Thus, the key component of this method is rapid fixation of MTs throughout the entire embryo. This is achieved by starting the fixation at physiological temperatures and using a buffer that both stabilizes the MTs and increases the permeability of the embryo. The fixation time is also important as curtailed fixation fails to arrest MTs while over-fixation can mask epitopes, interfering with antibody binding. The suggested fixation time of 3-4 h works with embryos that are in mid-gastrulation up to 24 h post-fertilization. Embryos towards the younger end of the time scale should be fixed for closer to 3 h while older embryos may need the entire 4 h. Even with proper fixation, the MTs will depolymerize with time so sectioning and immunolabeling must occur within one week of fixing.
Once the tissue is properly fixed, problems can arise with immunolabeling. The most common problem encountered has been poor penetration through the center of the tissue, particularly, if too many sections are incubated in the same well. Increasing the concentration of the primary antibody and incubation time for primary and secondary antibodies, combined with increasing the detergents to improve permeabilization of the embryos will ameliorate most of the immunolabeling problems. If the antibody labeling fails due to fixation issues or immunolabeling problems, it is possible to determine the cause by examining the antibody labeling pattern. Poor fixation will result in intense labeling in the membrane and diffuse labeling in the cytoplasm, while over-fixation will result in weak labeling that retains MT architecture. Poor penetration of the antibody, however, will appear as areas in the center of the tissue without labeling.
The ability to analyze MT images in a meaningful way is dependent on high quality imaging. To capture MT length in 3-D, the minimum Z-step size possible for the objective and numerical aperture should be used. Images shown here were captured with a 63X oil emersion objective with 1.4 numerical aperture producing the following: pixel = 240 nm, Z-step = 0.1 µm, Z-stack size = 16.252 µm. Because the width of a single MT is 25 nm, roughly 10 times below the limit of resolution for a light microscope, this metric cannot be accurately measured using this technique. Instead, only MT lengths equal to or greater than the minimum pixel size attainable in all three dimensions can be measured. Line and/or frame averaging can enhance the MT signal definition. MT analysis should be reserved for high quality sections. While tissue with poor fixation cannot be imaged and analyzed, mild overfixation can be counterbalanced by carefully increasing the laser intensity and gain to detect the weak signal while maintaining a good dynamic range. Poor antibody penetration, while not optimal, can be corrected by limiting image acquisition to well-labeled regions, resulting in imaging a thinner section (5-10 µm). High background from labeling can be compensated for by adjusting the filter settings. However, if any of these adjustments are done, it is necessary to verify that the filters threshold acceptably on each plane of the Z-stack.
3-D image analysis software allows the experimenter to quantify MT length, area, angle, abundance, and other metrics in the 3-D space of fixed tissue sections. The method described here provides directions for obtaining such data using commercially available software. However, the filtering modules may be adapted to public domain software enhanced with relevant plugins and/or macros, making analysis available to all. Prior to analysis, raw images must be thresholded to avoid including background and non-specific signals in the quantification. Once analysis is completed and data are transferred to a workable spreadsheet, many inferences can be made from the data set. One of the calculations made here was Glu-tubulin streaks per β-tubulin streaks, or the ratio of stable MTs to total MTs where 1 represents that the entire MT cytoskeleton was stabilized in an ROI. If the experimenter wishes to complement their quantitative data, generating a polished tagged image file format (TIFF) image with scale bars is effortless with 3-D image analysis software.
This assay allows the functional analysis of proteins implicated in MT assembly, in vivo. If immunolabeling is performed on alternating serial sections, this protocol could be used to study dynamic and stable MTs in the same embryo. In the future, modifications such as increased detergents or altered embedding angles will allow the use of these methods for older embryos and a wider range of anatomical questions.
Subscription Required. Please recommend JoVE to your librarian.
Disclosures
The authors have nothing to disclose.
Acknowledgments
The confocal microscope was purchased with funds from the U.S. National Science Foundation (NSF), grant #DBI-0722569. The research was supported by the U.S. National Institutes of Health/National Institute of General Medical Sciences (NIH/NIGMS) grant #GM085290 and U.S. Department of Defense (DOD) grant #W81XWH-16-1-0466 awarded to R.M. Brewster. E. Vital was supported by a grant to UMBC from the Howard Hughes Medical Institute through the Pre-college and Undergraduate Science Education Program, grant #52008090. S.P. Brown was supported by a U.S. Department of Education GAANN Fellowship, a Meyerhoff Graduate Fellowship funded by NIH/NIGMS grant #GM055036, and a Research Assistantship funded by the U.S. DOD grant #W81XWH-16-1-0466.
Materials
| Name | Company | Catalog Number | Comments |
| Agarose | Used to treat petridishes. Prepare 1% agarose by heating a solution of 1 gram agarose per 100 ml 1X embryo medium in a microwave until polymerized. |
||
| Kpipes | Sigma | P7643 | |
| NaCl | Sigma | S7653 | |
| Tris-HCl | Sigma | T3253-500G | |
| KCl | Sigma | P9333-500G | |
| CaCl2·2H2O | Sigma | C5080 | |
| NP-40 | American Bioanalyticals | AB01424 | |
| EGTA | Sigma | E3889-25G | |
| MgCl2 | Sigma | M2670-500G | |
| Bovine serum albumin (BSA) | Fisher | BP1605 | |
| Triton-x | American Bioanalyticals | AB02025 | |
| Anti-Fade mounting medium | Invitrogen | P10144 | |
| Mouse anti-β-tubulin | Developmental studies Hybridoma Bank | E7 | 1/200 |
| Rabbit anti-γ-tubulin | Genetex | GTX113286 | 1/500 |
| Rabbit anti-α-tubulin | Genetex | GTX108784 | 1/1000* |
| Rabbit anti-detyrosinated-tubulin | Millipore | AB3201 | 1/200-1/1000* Titrate antibody with first use of new lot. |
| Rabbit anti-tyrosinated-tubulin | Millipore | ABT171 | 1/500 |
| Mouse anti-centrin | Millipore | 04-1624 | 1/1000 |
| Goat 488 anti-rabbit | Thermofisher | A11008 | 1/500 |
| Goat 594 anti-rabbit | Thermofisher | A11012 | 1/500 |
| Goat 594 anti-mouse | Thermofisher | A11005 | 1/500 |
| Goat 488 anti-mouse | Thermofisher | A11001 | 1/500 |
| Vibratome | Vibratome | 1500 | |
| Forceps | World Precision Instruments | 555227F | |
| 100 mm petri dish | Cell treat | 229693 | |
| 35 mm petri dish | Cell treat | 229638 | |
| 50 ml falcon tube | Fisher | 14-432-22 | |
| Woven nylon mesh 70 um | Amazon.com | B0043D1SZG | |
| Micropipette | Gilson | F123602 | |
| Glass pipette | Fisher | NC-999363-9 | |
| Aquarium sealant | Amazon.com, by MarineLand | Silicone Sealer 1 oz (Tube) | |
| Ring stand | Fisher | 14-675BO | |
| Microbore PTFE Tubing, 0.022"ID | Cole-Parmer | WU-06417-21 | |
| Modeling clay | Amazon.com | Sargent Art 22-4000 | Any wax or oil based non-toxic modeling clay will suffice |
| Clamp | Fisher | 02-215-466 | |
| 60ml syringe | Fisher | 14-820-11 | |
| Embryo medium (E3) | 34.8 g NaCl 1.6 g KCl 5.8 g CaCl2·2H2O 9.78 g MgCl2·6H2O To prepare a 60X stock, dissolve the ingredients in H2O, to a final volume of 2 L. Adjust the pH to 7.2 with NaOH. Autoclave. To prepare 1X medium, dilute 16.5 mL of the 60X stock to 1 L. |
||
| Blocking Solution | 50 ml TBS-NP-40 2.5 ml normal goat serum 1 g BSA 625 µl Triton-X |
||
| TBS-NP-40 (pH 7.6) | 155 mM NaCl 10 mM Tris HCl 0.1% NP-40 |
||
| 2x MAB (pH6.4) | 160 mM KPIPES 10 mM EGTA 2 mM MgCl2 |
||
| Commercial 3-D Image processing Software | PerkinElmer | Volocity (V 6.2) | |
| Dry block heater | VWR | 12621-108 | Used as a hot plate to melt agarose in Protocol 1. |
| Dissecting Microscope | Leica | MZ12 | |
| Confocal Microscope | Leica | SP5 | |
| Flat embedding mold | emsdiasum.com | BEEM 70904-01 | |
| Public domain image processing software | NIH | ImageJ (V 1.5) | |
| * Success varies by lot number | |||
References
- Akhmanova, A., Steinmetz, M. O. Tracking the ends: a dynamic protein network controls the fate of microtubule tips. Nat Rev Mol Cell Biol. 9 (4), 309-322 (2008).
- Conde, C., Cáceres, A. Microtubule assembly, organization and dynamics in axons and dendrites. Nat Rev Neurosci. 10 (5), 319-332 (2009).
- Kaverina, I., Straube, A. Regulation of cell migration by dynamic microtubules. Semin Cell Dev Biol. 22 (9), 968-974 (2011).
- Kollman, J. M., Merdes, A., Mourey, L., Agard, D. A. Microtubule nucleation by γ-tubulin complexes. Nat Rev Mol Cell Biol. 12 (11), 709-721 (2011).
- Howard, J., Hyman, A. A. Growth, fluctuation and switching at microtubule plus ends. Nat Rev Mol Cell Biol. 10 (8), 569-574 (2009).
- Schulze, E., Kirschner, M. Dynamic and stable populations of microtubules in cells. J Cell Biol. 104 (2), 277-288 (1987).
- Gundersen, G. G., Kalnoski, M. H., Bulinski, J. C. Distinct populations of microtubules: Tyrosinated and nontyrosinated alpha tubulin are distributed differently in vivo. Cell. 38 (3), 779-789 (1984).
- Li, R., Gundersen, G. G. Beyond polymer polarity: how the cytoskeleton builds a polarized cell. Nat Rev Mol Cell Biol. 9 (11), 860-873 (2008).
- Asakawa, K., Kawakami, K. A transgenic zebrafish for monitoring in vivo microtubule structures. Dev Dyn Off Publ Am Assoc Anat. 239 (10), 2695-2699 (2010).
- Wühr, M., Tan, E. S., Parker, S. K., Detrich, H. W., Mitchison, T. J. A model for cleavage plane determination in early amphibian and fish embryos. Curr Biol CB. 20 (22), 2040-2045 (2010).
- Tran, L. D., Hino, H., et al. Dynamic microtubules at the vegetal cortex predict the embryonic axis in zebrafish. Development. 139 (19), 3644-3652 (2012).
- Butler, R., Wood, J. D., Landers, J. A., Cunliffe, V. T. Genetic and chemical modulation of spastin-dependent axon outgrowth in zebrafish embryos indicates a role for impaired microtubule dynamics in hereditary spastic paraplegia. Dis Model Mech. 3 (11-12), 743-751 (2010).
- Yoo, S. K., Lam, P. -Y., Eichelberg, M. R., Zasadil, L., Bement, W. M., Huttenlocher, A. The role of microtubules in neutrophil polarity and migration in live zebrafish. J Cell Sci. 125 (23), 5702-5710 (2012).
- Andersen, E. F., Halloran, M. C. Centrosome movements in vivo correlate with specific neurite formation downstream of LIM homeodomain transcription factor activity. Development. 139 (19), 3590-3599 (2012).
- Lee, S. -J. Dynamic regulation of the microtubule and actin cytoskeleton in zebrafish epiboly. Biochem Biophys Res Commun. 452 (1), 1-7 (2014).
- Bulinski, J. C., Gundersen, G. G. Stabilization and post-translational modification of microtubules during cellular morphogenesis. BioEssays. 13 (6), 285-293 (1991).
- Magiera, M. M., Janke, C. Chapter 16 - Investigating Tubulin Posttranslational Modifications with Specific Antibodies. Methods Cell Biol. 115, 247-267 (2013).
- Hong, E., Jayachandran, P., Brewster, R. The polarity protein Pard3 is required for centrosome positioning during neurulation. Dev Biol. 341 (2), 335-345 (2010).
- Westermann, S., Weber, K. Post-translational modifications regulate microtubule function. Nat Rev Mol Cell Biol. 4 (12), 938-948 (2003).
- Jayachandran, P., Olmo, V. N., et al. Microtubule-associated protein 1b is required for shaping the neural tube. Neural Develop. 11, 1 (2016).
- Nam, S. -C. Role of Tau, a microtubule associated protein, in Drosophila photoreceptor morphogenesis. Genes N Y N 2000. 54 (11), 553-561 (2016).
- Abal, M., Piel, M., Bouckson-Castaing, V., Mogensen, M., Sibarita, J. -B., Bornens, M. Microtubule release from the centrosome in migrating cells. J Cell Biol. 159 (5), 731-737 (2002).
- Delgehyr, N., Sillibourne, J., Bornens, M. Microtubule nucleation and anchoring at the centrosome are independent processes linked by ninein function. J Cell Sci. 118 (8), 1565-1575 (2005).
- Manning, J. A., Lewis, M., Koblar, S. A., Kumar, S. An essential function for the centrosomal protein NEDD1 in zebrafish development. Cell Death Differ. 17 (8), 1302-1314 (2010).
- Kimmel, C. B., Ballard, W. W., Kimmel, S. R., Ullmann, B., Schilling, T. F. Stages of embryonic development of the zebrafish. Dev Dyn Off Publ Am Assoc Anat. 203 (3), 253-310 (1995).
- Beck, A. P., Watt, R. M., Bonner, J. Dissection and Lateral Mounting of Zebrafish Embryos: Analysis of Spinal Cord Development. JoVE J Vis Exp. (84), e50703 (2014).
- FÖldes-Papp, Z., Demel, U., Tilz, G. P. Laser scanning confocal fluorescence microscopy: an overview. Int Immunopharmacol. 3 (13-14), 1715-1729 (2003).
- Ferreira, T., Rasband, W. S. ImageJ User Guide - IJ 1.46. , Available from: https://imagej.nih.gov/ij/docs/guide/ (2010).
- Z-functions - ImageJ. , Available from: https://imagej.net/Z-functions (2017).
