A protocol is presented for X-ray crystallography using protein microcrystals. Two examples analyzing in vivo-grown microcrystals after purification or in cellulo are compared.
Method Article
Microcrystallography of Protein Crystals and In Cellulo Diffraction
* These authors contributed equally
Opens in a new tab
In This Article
Summary
Loading...
$$\rightleftharpoonup{xx}$$
$$\longleftharp{xx}$$,
$$\longrightharp{xx}$$,
Abstract
Loading...
$$\rightleftharpoonup{xx}$$
$$\longleftharp{xx}$$,
$$\longrightharp{xx}$$,
The advent of high-quality microfocus beamlines at many synchrotron facilities has permitted the routine analysis of crystals smaller than 10 µm in their largest dimension, which used to represent a challenge. We present two alternative workflows for the structure determination of protein microcrystals by X-ray crystallography with a particular focus on crystals grown in vivo. The microcrystals are either extracted from cells by sonication and purified by differential centrifugation, or analyzed in cellulo after cell sorting by flow cytometry of crystal-containing cells. Optionally, purified crystals or crystal-containing cells are soaked in heavy atom solutions for experimental phasing. These samples are then prepared for diffraction experiments in a similar way by application onto a micromesh support and flash cooling in liquid nitrogen. We briefly describe and compare serial diffraction experiments of isolated microcrystals and crystal-containing cells using a microfocus synchrotron beamline to produce datasets suitable for phasing, model building and refinement.
These workflows are exemplified with crystals of the Bombyx mori cypovirus 1 (BmCPV1) polyhedrin produced by infection of insect cells with a recombinant baculovirus. In this case study, in cellulo analysis is more efficient than analysis of purified crystals and yields a structure in ~8 days from expression to refinement.
Introduction
Loading...
$$\rightleftharpoonup{xx}$$
$$\longleftharp{xx}$$,
$$\longrightharp{xx}$$,
The use of X-ray crystallography for the determination of high-resolution structures of biological macromolecules has experienced a steady progression over the last two decades. The growing uptake of X-ray crystallography by non-expert researchers exemplifies the democratization of this approach in many fields of life sciences1.
Historically, crystals with dimensions below ~10 µm have been considered as challenging, if not unusable, for structure determination. The increasing availability of dedicated microfocus beamlinesat synchrotron radiation sources worldwide and technological advances, such as the development of tools to manipulate microcrystals, have removed much of these barriers that stymied the wide use of X-ray microcrystallography. Advances in serial X-ray microcrystallography2,3 and micro electron diffraction4 have shown that the use of micro- and nanocrystals for structure determination is not only feasible but also sometimes preferable to the use of large crystals5,6,7.
These advances were first applied to the study of peptides8 and natural crystals produced by insect viruses9,10. They are now used for a diverse range of biological macromolecules including the most difficult systems such as membrane proteins and large complexes11. To facilitate the analysis of these microcrystals, they have been analyzed in meso, particularly membrane proteins12 and in microfluidics chips13.
The availability of these novel microcrystallography methodologies has raised the possibility of using in vivo crystallization as a new route for structural biology14,15,16 offering an alternative to classical in vitro crystallogenesis. Unfortunately, even when in vivo crystals can be produced, several obstacles remain such as the degradation or loss of ligands during the purification from cells, difficulty in the manipulation and visualization of the crystals at the synchrotron beamline and tedious X-ray diffraction experiments. As an alternative crystals have also been analyzed directly within the cell without any purification step17,18,19. A comparative analysis suggests that such in cellulo approaches may be more efficient than the analysis of purified crystals and yield data of higher resolution20.
This protocol is intended to assist researchers new to protein microcrystallography. It provides methodologies focusing on sample preparation and manipulation for X-ray diffraction experiments at a synchrotron beamline. Two options are proposed using isolated crystals for classical microcrystallography or crystal-containing cells sorted by flow cytometry for in cellulo analysis (Figure 1).
Access restricted. Please log in or start a trial to view this content.
Protocol
Loading...
$$\rightleftharpoonup{xx}$$
$$\longleftharp{xx}$$,
$$\longrightharp{xx}$$,
Note: In vivo crystallization has been reported in many organisms including in bacteria, yeast, plants, insects and mammals (reviewed in reference 21). Crystallization of recombinant proteins has also been achieved in the laboratory using transient transfection of mammalian cells and baculovirus infection of insect cells. The following protocol has been developed using the Bombyx mori cypovirus 1 (BmCPV1) polyhedrin gene cloned in a recombinant baculovirus under the baculovirus polyhedrin promoter, generated as per instructions in reference 22. Thus, although this protocol may be adapted to other cell types (e.g. mammalian cells), we describe here the procedures for insect cells. The protocol assumes that over-expression of the protein of interest has already been achieved. Methods for the production of a recombinant baculovirus and its use for expression of the protein of interest are available in references 23,24,25,26,27.
1. Identification of Crystal-containing Cells
- If cells are grown in monolayer, directly inspect them in the flask. If cells are grown in liquid culture, use the following protocol.
- Using a sterile serological pipette, transfer 500 µL of cells into a microcentrifuge tube. Take care to ensure that the sterility of the main culture is maintained; handle the cells in a Class II biosafety cabinet and follow standard aseptic techniques.
- Pipet 5 µL of cells from the microcentrifuge tube onto a glass slide.
- Carefully place a glass coverslip onto the liquid, avoiding the formation of air bubbles. If the slide cannot be visualized within 15 min, seal the coverslip with vacuum grease to avoid evaporation.
- Image the flask or slide with an inverted microscope. If available, use phase contrast and/or differential interference contrast microscopy (DIC). Both techniques enhance the contrast in transparent samples and emphasize lines and edges, thus facilitating the identification of in vivo crystals.
- Carefully examine the cells. Start at 200X magnification and zoom in at maximal magnification when detecting a potential crystal. The presence of crystals may be suggested indirectly by changes in the cell morphology (Figure 2). Look for sharp edges and changes in refractivity (if using phase contrast or DIC). Known in vivo crystals adopt different shapes including rods, stacks of needles, cubes, pyramids and polyhedra (see Figure 2 and Table 1 for some examples).
Note: The proportion of cells containing crystals will be different in each case and can even vary between preparations but in general one should not expect to find crystals in all cells. Similarly, the number of crystals per cell is also variable (see Table 1), and more than one crystal may be found in one cell. These factors need to be optimized where possible by adjusting the multiplicity of infection, altering the length of expression and varying the protein construct. On one hand, conditions of protein expression and cell growth that maximize the number of crystal-containing cells will improve productivity (e.g. higher multiplicity of infection and late harvesting of cell culture). On the other hand, conditions where cells contain a single crystal facilitate data collection (e.g. low multiplicity of infection). Given the enrichment brought by flow sorting described in step 2.2, we recommend aiming for larger crystals (e.g. a single crystal per cell) even if the proportion of crystal-containing cells is low. - If crystals are identified, record their position (when imaging monolayer in a flask), and estimate the percentage of crystal-containing cells. If available, use a microscope equipped with a camera capable of tracking changes at a single cell level.
- For cells in suspension, determine the degree of cell viability following the protocol detailed in reference 28. For cells cultured in a monolayer, estimate by visual inspection the approximate degree of confluence and amount of detached cells.
- Monitor the crystal growth, cell growth and viability twice a day.
- Harvest the cells as soon as crystal growth appears to stop. For remarkably robust crystals like viral polyhedra, extended incubation times (>4 days) increase the number of large crystals. However, for typical protein crystals, we recommend to harvest cells when viability drops below 80% to prevent damage caused by cell lysis.
- Remove the flask from the incubator and proceed to step 2.2 as soon as possible. Keep the cells on ice during the following steps, unless specified otherwise.
2. Sample Purification
Note: We describe two methods of analysis of the in vivo crystals from purified crystals and in cellulo, respectively.
- Purification of crystals
Note: Unless there is evidence that the crystals of interest are sensitive to low temperature, work on ice and use ice-cold buffers to avoid crystal degradation.- Pipet 50 mL of infected Sf9 cells in a 50 mL conical centrifuge tube. This represents ~4 x 10⁸ cells in a typical experiment.
- Pellet cells at 450 x g for 10 min at 4 °C.
- Discard the supernatant and resuspend the pellet in 40 mL of chilled phosphate buffered saline (PBS), pH 7.4.
Note: PBS is proposed as a starting point for purification as a standard isotonic buffer with the aim of mimicking the cellular environment where the in vivo crystals grew. It has been used for most in vivo crystals grown in cell culture to date9,14,29. Alternatively, DMEM media has also been successfully used in the purification of in vivo crystals from mammalian cells 19. If crystals visibly suffer from their transfer in PBS or present poor diffraction, this parameter should be investigated as a potential source of degradation. - Sonicate the resuspended pellet for 30 s at 10 mA using a sonicator equipped with a 19-mm probe. To avoid heating the sample, place it in a beaker filled with ice while sonicating. Chemical or mechanical cell disruption may be used as alternatives if crystals appear to be damaged by sonication as assessed in step 2.1.7.
- Centrifuge at 450 x g for 10 min at 4 °C. After centrifugation, 2 layers are apparent: an upper layer of cellular debris, which is pale brown, and a lower pellet of polyhedrin crystals, which is white and chalky.
- Discard the supernatant and remove the upper layer by cautious pipetting. Resupend the lower pellet in 40 mL of chilled PBS.
- Assess the quality of the samples by imaging with a light microscope.
- Pipet 5 µL of cells or purified crystals onto a glass slide. This can be done at room temperature.
- Carefully place a glass coverslip onto the liquid, avoiding the formation of air bubbles.
- Image the slide with an inverted microscope at 200X magnification. Image the sample within 15 min of its preparation on the slide. If the slide cannot be visualized within 15 min, seal the coverslip with vacuum grease to avoid evaporation.
NOTE: In the case of polyhedra, crystals will appear as refringent cubes of ~1 - 10 µm per side. Check the integrity of the crystals looking for signs of loss of sharpness (e.g. round edges), cracks or dissolution. Also monitor the presence of cell debris that will appear as clumps and objects of irregular size and shape.
- Repeat steps 2.1.5 to 2.1.7, halving the volume of PBS used to resuspend the pellet at each cycle until the crystals appear free of debris. Resuspend the final pellet in 1 mL of chilled PBS and transfer the crystals to a microcentrifuge tube. Store the purified crystals at 4 °C.
- Estimate the concentration of crystals by using a hemocytometer as described by the manufacturer. Count crystals as if counting cells.
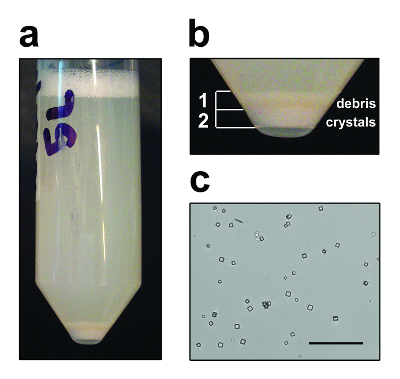
Figure 3: Purified In Vivo Microcrystals. Representative purification of crystals of the BmCPV1 polyhedrin from Sf9 insect cells showing (a) pelleted cell debris and crystals after sonication, and (b) close-up on the debris and crystal layers. Debris layer can be carefully resuspended in the supernatant and discarded for faster crystal purification. (c) Optical microscopy image of purified polyhedra. Scale bar = 50 µm. Please click here to view a larger version of this figure.
- Isolation of crystal-containing cells by flow-cytometry
Note: To facilitate the definition of gates in flow cytometry, it is recommended to grow a control culture in parallel to the one expressing the protein of interest. This can be done by infecting a flask of Sf9 cells with a non-relevant recombinant baculovirus, or by preparing mock-infected cells. Sorting and imaging of samples is usually done at room temperature.
CAUTION: Propidium iodide is a suspected carcinogen and should be handled with care.- Pipet 4 mL of infected Sf9 cells - representing ~3 x 10⁷ cells – in a tube adapted to flow-cytometry analysis. Also, prepare a second tube with an equivalent number of Sf9 cells infected with a non-recombinant baculovirus.
- Add propidium iodide (PI) to both samples at a final concentration of 1 µg/mL just prior to flow cytometric evaluation. This step is necessary to identify dead cells, cell clumps and debris that may alter or mask cell distribution on the forward- and side-scattering plot. Prepare PI stocks of 1 mg/mL in water and store at 4 °C protected from light.
- Apply cells to a standard flow cytometer capable of cell sorting according to forward- (FSC) and side-scattering (SSC). Analyze at least 20,000 events of the control (i.e. non-crystal containing) sample. After discarding dead cells, cell clumps and debris from the analysis, generate the FSC to SSC plot.
- Analyze at least 20,000 events of the crystal-containing sample. Compare the FSC to SSC plot with the mock one. Look for the appearance of a distinct population corresponding to crystal-containing cells. Typically, cells with intracellular crystals will have a higher SSC due to an increased in morphological complexity. The FSC may also increase if crystal growth causes an increase in the volume of the cell. Define the gates of the flow sorter to isolate cell populations corresponding to the areas of the scatter plot that differ from the mock plot. Image the sorted samples by light microscopy as described in step 1 to confirm which population is associated with crystal-containing cells.
- Using the gates defined in step 2.2.4, sort crystal-containing cells in PBS, or in any other isotonic buffer. Record the number of crystal-containing cells sorted as well as the final volume to facilitate subsequent steps. Store the sorted cells on ice or at 4 °C.
Note: In an hour, >300,000 polyhedra-containing cells are sorted on a cell sorter with a 100 mm nozzle (138 kPa with a frequency of 39 kHz). This amount of cells is enough to prepare >1,000 meshes. - Following the protocol detailed in step 2.1.7, image the cells with a light microscope to confirm the enrichment in crystal-containing cells. Sample preparation for data collection should be done as soon as possible after cell sorting since crystals may degrade over time or be released due to cell lysis.
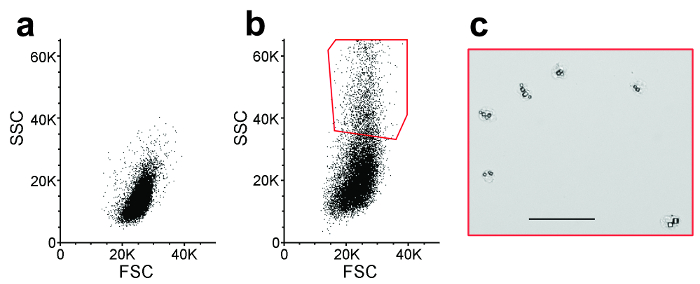
Figure 4: Cell-sorting. Representative flow cytometry scatter plots from (a) non-infected cells (mock), which do not contain crystals, and (b) Sf9 cells infected by a recombinant baculovirus over-expressing for the BmCPV1 polyhedrin. Differences in the scattering pattern between the two populations allowed gating of the crystal-containing cell population (red gate, high SSC values). Each plot represents 20,000 sorting events. SSC: side light scattering; FSC: forward light scattering. (c) Optical microscopy image of a representative population of the sorted cells, showing the presence of intracellular crystals. Scale = 50 µm. Please click here to view a larger version of this figure.
3. Sample Preparation for Data Collection
Note: If cells or crystals are to be derivatized for experimental phasing follow protocol detailed in section 3.1. Otherwise, go directly to sections 3.2 for purified crystals or 3.3 for in cellulo analysis.
- Derivatization of purified or in cellulo microcrystals
CAUTION: Consult all relevant material safety data sheets (MSDS) before use. Most of the chemicals used for experimental phasing are acutely toxic. Use all appropriate safety practices including the use of a chemical fume hood and personal protective equipment. Dispose of waste products in accordance with your institution policy.
Note: The nature of heavy atoms, their concentration and incubation time are given on an indicative basis for crystals of the BmCPV1 polyhedrin. These parameters must be determined experimentally for each new target. Subsequent staining with trypan blue in step 3.3.2 can be omitted if cells are readily colored by the chemical compound used for phasing.- Prepare saturated solutions of the desired heavy atoms (or solutions of other chemicals used for experimental phasing). Typically, volumes lower than 100 µL will be required for each heavy atom. Remove undissolved salts and debris by centrifugation at maximum speed in a microcentrifuge for 5 min at room temperature.
- Prepare aliquots of ~50,000 crystals or sorted cells per heavy atom compound. If PBS is not compatible with the chemical used for derivatization (i.e. precipitate forms and the solution becomes cloudy), pellet the crystals at 4,000 x g for 3 min at room temperature in a microcentrifuge, or the cells at 150 x g for 3 min, remove the supernatant and gently resuspend the crystals or cells in 20 µL of a suitable buffer. Repeat pelleting and resuspension to ensure that no traces of PBS remain. Adjust the final volume to 20 µL for all aliquots.
- Add 20 µL of heavy atom solution or other chemical compound of choice to the crystals or cells. The optimal concentration of heavy atom will depend on a combination of cellular parameters (permeability, off-target proteins …) and the nature of the crystal of the protein of interest. As a starting point, test 3 different concentrations: full saturation, 1/10e, 1/100e.
- Keep the samples at 4 °C for up to 3 days. Crystals of the polyhedrin are very resistant and dense and require long soaks to incorporate the heavy atoms; for other types of crystals the incubation period and concentration of heavy atoms should be determined experimentally. Too short incubation times will not allow the incorporation of proper amounts of the heavy atom, while long incubation times can affect the integrity of the crystals, hence lowering their diffraction quality or even dissolving them. As a starting point, try 3 different incubation times for each heavy atom solution (e.g. 1 min, 1 h and overnight).Successful derivatization is assessed by analysis of diffraction data as briefly described in section 5 and references therein.
- Wash away the excess of heavy atom solution by pelleting the crystals at 4,000 x g for 3 min at room temperature in a microcentrifuge, or the cells at 150 x g for 3 min, removing the supernatant and gently resuspending the crystals or cells in 10 µL of buffer.
- Preparation of micromesh support with purified microcrystals
CAUTION: Use of liquid nitrogen is associated with hazards such as asphyxiation, cold burns, fire in oxygen-enriched atmosphere and explosion. Please consult the risk management and safe work practices of your institution.- Based on the crystal concentration calculated in step 2.1.9, adjust the concentration to 107 crystals/mL by diluting the sample; or by pelleting the crystals at 4,000 x g for 3 min at room temperature in a microcentrifuge, adjusting the final volume by removing supernatant, and gently resuspending the crystals.
- If samples are meant to be frozen in advance, cool down the dry shipper or dewar with liquid nitrogen. Prepare the vials or pucks, as appropriate, and cool them down with liquid nitrogen.
- Resuspend the crystal pellet and apply a 0.5 µL droplet of crystals onto a micromesh by pipetting. Use 700 µm meshes with 25-µm square holes as a starting point. The area of the mesh is not critical but a larger area provides more crystals per mesh and leads to slower evaporation during preparation. The size of holes may need to be optimized to match the size of crystals larger than 25 µm. If required for systematic studies, indexed meshes are available to facilitate a methodical grid scan during data collection.
- Remove most of the excess liquid by blotting with a paper wick. The crystals should be spread evenly on the mesh, without touching each other. Repeat step 3.1.1. for optimization of sample concentration. Proceed quickly and do not remove too much of the liquid. In the absence of cryoprotectant, the liquid evaporates rapidly with the risk of salt crystal formation and/or loss of the film.
- Add cryoprotectant: pipet 0.5 µL of a solution of 50% ethylene glycol in water onto the mesh (the composition of the cryobuffer is to be adapted to the sample; suggestions for optimization of cryoprotectant can be found in reference30). Remove the excess liquid by blotting with a paper wick. By contrast with the previous step, here the remaining film of solvent should be as thin as possible to reduce parallax effects that complicate the process of alignment between the crystal, the beam path and the goniometer; and to minimize background caused by scattering of X-rays by liquid in the beam path.
- Immediately flash-cool the micromesh in liquid nitrogen and transfer to a vial or robot puck, then to a dry shipper or dewar for storage.
- Preparation of micromesh with crystal-containing cells
CAUTION: Use of liquid nitrogen is associated with hazards such as asphyxiation, cold burns, fire in oxygen-enriched atmosphere and explosion. Please consult the risk management and safe work practices of your institution.- Transfer the sorted cells to a 1.5 mL microcentrifuge tube. Based on the cell counts recorded by the cell sorter, adjust the concentration to 107 cells/mL by diluting the sample with PBS; or by pelleting the cells at 150 x g for 3 min at room temperature in a microcentrifuge, adjusting the final volume by removing supernatant, and gently resuspending the cells.
- Mix the cells with an equal volume of trypan blue solution (0.4% w/v) to a final concentration of 0.2 % w/v.
- If samples are meant to be frozen in advance, cool the dry shipper or dewar down with liquid nitrogen. Prepare the vials or pucks, as appropriate, and also cool them down with liquid nitrogen.
- Gently resuspend the cells and pipet 0.5 µL of sorted cells onto a micromesh.
- Remove the excess liquid by blotting with a paper wick. The cells should be spread evenly on the mesh, without touching each other. If not using cryoprotectant (step 3.3.6), the remaining film of solvent should be as thin as possible to reduce parallax effects that complicate the process of alignment between the crystal, the beam path and the goniometer; and to minimize background caused by scattering of X-rays by liquid in the beam path.
- Optionally, add cryoprotectant to the cells: pipet 0.5 µL of 50% ethylene glycol, 50% PBS solution onto the mesh. The composition of the cryobuffer is to be adapted to the sample; suggestions for optimization of cryoprotectant can be found in reference30. Remove the excess liquid by blotting with a paper wick, leaving only a thin film of solvent.
Note: Omission of the cryoprotection step did not alter the quality of X-ray diffraction when crystals of the polyhedrin were analyzed in cellulo, while this step was required for purified crystals20. This only applies to the incubation of the cells with cryoprotectant solution; the sample should still be analyzed at 100K to minimize the effects of radiation damage on the crystals. - Immediately flash-cool the micromesh in liquid nitrogen and transfer to a vial or robot puck, then to a dry shipper or storage dewar, as appropriate.
4. Data Collection
Note: Parameters used for data collection are given as a guide and should be optimized for each crystal type and synchrotron beamline.
- Collect data on a microfocus crystallography beamline (cf. reference 7 for a list of microfocus beamlines and their characteristics). If available, use a collimated beam that matches the size of the crystals.
- For experimental phasing by the Single-wavelength Anomalous Dispersion method (SAD), collect at an energy maximizing the anomalous signal of the heavy atom of choice. For phasing using the Multiple Isomorphous Replacement method, (MIR), collect above the energy of a suitable absorption edge for the heavy atom of choice (available at http://skuld.bmsc.washington.edu/scatter/AS_periodic.html).
- After loading the mesh onto the goniometer, start by centering the micromesh with the beam path using the face-on (convex side) and side-on orientations. Then, with the micromesh face-on, fine-tune the alignment by aligning the center of a particular horizontal lane of the micromesh (for instance, start with the central one). Then collect data along this horizontal lane with only minor readjustments to the alignment. If available, use centering based on rastering at low-dose X-ray diffraction for fine-tuning the alignment (consult the local contact at the synchrotron beamline).
Note: As a limited amount of data can be collected on microcrystals due to radiation damage (typically, 10 to 30 images with 1 ° oscillation), in theory the crystal only needs to be aligned with the beam path for 10-30 °. However, it is critical that the alignment is accurate as the crystal can easily by missed by the microbeam (generally collimated to a diameter of ~10 µm or smaller). - Collect diffraction data until diffraction is lost due to radiation damage. For crystals of the polyhedrin, exposure time of 10 sec is typically used for a 1° oscillation for a flux of approximately 3.6 x 10¹¹ photons/s at 13 keV with a CCD detector (total dose <30 MGy). Optimize these settings depending on the beamline and nature of the crystal used. In particular, low dose and fine slicing are recommended for pixel X-ray detectors.
Note: If using the in cellulo strategy, the cells stained with trypan blue will appear as blue dots against the support background, making them easier to align to the beam. If the collimated microbeam has approximately the same size as the cells (~10 µm), all crystals contained in a cell will be illuminated simultaneously. For cells containing multiple microcrystals, this leads to the observation of multiple diffraction patterns, which can be difficult to process. However, diffraction from one of the crystals often tends to dominate the diffraction pattern and is preferentially indexed during data processing. For beamlines with an X-ray beam significantly smaller that the cell, rastering at very low X-ray flux (>95% attenuation) should be used to center on a single crystal before data collection. - Proceed to the next crystal in lane.
- Once all the crystals of the lane have been tested, proceed to the next lane and repeat the alignment procedure. Proceed until sufficient data has been collected or all crystals have been tested.
- Make sure that the lanes that have been processed are clearly identified so that crystals are not missed or shot twice (if necessary, draw a sketch). Typically, trypan blue turns yellow after the cell has been irradiated, which may be used as a marker.
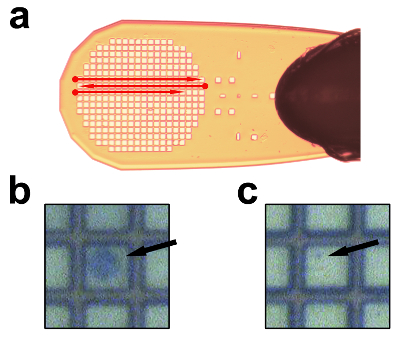
Figure 5: Data Collection Strategy from Samples on Micromesh Support. (a) Strategy of data collection per lane; alignment is done at the beginning of each lane (dots) and data is collected along the lane. (b) Close-up of a trypan blue-stained, crystal-containing cell on a mesh, as seen on the microcrystallography beamline screen. (c) Close-up of a purified polyhedra on a mesh, as seen on the microcrystallography beamline screen. The mesh squares are 25 µm x 25 µm. Please click here to view a larger version of this figure.
5. Data Processing
NOTE: Here, we only mention briefly the steps of data processing that are specific to serial microcrystallography, where data from multiple crystals are merged. Many excellent articles are available describing data processing in depth31,32,33,34,35,36 and structure determination is beyond the scope of this protocol.
- Select the crystal with the best diffraction resolution and quality as a reference.
- Individually process each crystal using standard crystallography packages such as HKL-200031, Mosflm32, or XDS33. To ensure that radiation damage does not deteriorate the quality of the dataset, carefully select the last image with acceptable radiation damage. Cut-off criteria indicating excessive radiation damage are specific of each crystal type, processing practice and the purpose of the experiment. For phasing of the BmCPV1 polyhedrin crystals, data was discarded once the signal-to-noise /<σ(I)> per image dropped below 2 or the Rsym exceeded 50% as reported by HKL-200031.
- For each crystal, define the resolution limit and number of frames and reprocess with the correct parameters to avoid integrating data with little or no signal.
- Scale and merge data from the best crystals to the reference crystal(s) using standard packages such as Scalepack in HKL-200031, SCALA in CCP434,35 or XSCALE in XDS33. Add the data from the different crystals progressively while monitoring the global quality of the dataset, ideally until the dataset reaches an acceptable completeness (>95%). Reject crystals that present a poor isomorphism with the best/reference crystal as detected by differences in unit cell parameters and poor Rmerge/chi-square per image. If too many good quality datasets do not scale with the reference crystal(s), use a program like BLEND36 that carries hierarchical clustering to define the best combination of datasets to merge.
Note: In some space groups, alternate indexing options need to be tested to match the reference crystal. - Proceed to experimental phasing, molecular replacement or refinement using standard crystallography packages.
Access restricted. Please log in or start a trial to view this content.
Results
Loading...
$$\rightleftharpoonup{xx}$$
$$\longleftharp{xx}$$,
$$\longrightharp{xx}$$,
An overview of both alternative methods for structure determination using in vivo microcrystals is presented (Figure 1). Polyhedra can easily be purified by sonication and centrifugation. Due to their density, they form a layer at the bottom of the tube underneath a layer of debris that can be removed by pipetting (Figure 3a and 3b). The sample is then subjected to several rounds of sonication and washes...
Access restricted. Please log in or start a trial to view this content.
Discussion
Loading...
$$\rightleftharpoonup{xx}$$
$$\longleftharp{xx}$$,
$$\longrightharp{xx}$$,
This protocol provides two approaches to analyze microcrystals with the aim of facilitating the analysis of very small crystals that would have been overlooked in the past.
Critical steps for microcrystal purification
The presented protocol has been optimized using Bombyx mori CPV1 polyhedrin expressed in Sf9 cells as a model system. However, in vivo microcrystals display a great variability in mechanical resistance. For instance, cathepsin B needle-lik...
Access restricted. Please log in or start a trial to view this content.
Disclosures
Loading...
$$\rightleftharpoonup{xx}$$
$$\longleftharp{xx}$$,
$$\longrightharp{xx}$$,
The authors have nothing to disclose.
Acknowledgements
Loading...
$$\rightleftharpoonup{xx}$$
$$\longleftharp{xx}$$,
$$\longrightharp{xx}$$,
The authors would like to acknowledge Chan-Sien Lay for providing pictures of purified microcrystals, Daniel Eriksson and Tom Caradoc-Davies for support at the MX2 beamline of the Australian Synchrotron, and Kathryn Flanagan and Andrew Fryga from the FlowCore facility at Monash University for their invaluable assistance.
Access restricted. Please log in or start a trial to view this content.
Materials
| Name | Company | Catalog Number | Comments |
|---|---|---|---|
| Sf9 cells | Life Technologies | ||
| SF900-SFM insect medium | Life Technologies | ||
| 1 L cell culture flask | Thermofisher Scientific | ||
| Shaking incubator for insect cell culture | Eppendorf | ||
| 50 mL conical tubes | Falcon | ||
| Centrifuge with swing buckets for 50 mL tubes | Eppendorf | ||
| Sonicator equiped with a 19 mm probe | MSE Soniprep 150 | ||
| Glass slides | Hampton Research | ||
| Hemacytometer | Sigma-Aldrich | ||
| Propidium iodide | Thermofisher Scientific | ||
| BD Influx cell sorter | BD Biosciences | ||
| Hampton Heavy atom screens | Hampton Research | ||
| Microcentrifuge | Eppendorf | ||
| Micromesh | Mitigen | 700/25 meshes offer a larger surface. Indexed meshes can be purchased for systematic studies. | |
| Paper wick | Mitigen | The size of the paper wick can be varied for optimal flow. This will largely depend on the nature of the crystals and cryoprotectant used. | |
| Ethylene glycol | Sigma-Aldrich | ||
| Trypan blue | Life Technologies | ||
| MX2 microfocus beamline | Australian Synchrotron | A list of available microfocus beamlines can be found in Boudes et al. (2014) Reflections on the Many Facets of Protein Microcrystallography. Australian Journal of Chemistry 67 (12), 1793–1806, doi:10.1071/CH14455. |
References
Loading...
$$\rightleftharpoonup{xx}$$
$$\longleftharp{xx}$$,
$$\longrightharp{xx}$$,
- Tari, L. W. The utility of structural biology in drug discovery. Methods Mol Bio (Clifton, N.J). 841, 1-27 (2012).
- Gati, C., et al. Serial crystallography on in vivo grown microcrystals using synchrotron radiation. IUCrJ. 1 (2), 0(2014).
- Redecke, L., et al. Natively inhibited Trypanosoma brucei cathepsin B structure determined by using an X-ray laser. Science. 339 (2013), 227-230 (2013).
- Shi, D., Nannenga, B. L., Iadanza, M. G., Gonen, T. Three-dimensional electron crystallography of protein microcrystals. eLife. 2 (0), e01345(2013).
- Evans, G., Axford, D., Waterman, D., Owen, R. L. Macromolecular microcrystallography. Crystallog. Rev. 17 (2), 105-142 (2011).
- Smith, J. L., Fischetti, R. F., Yamamoto, M. Micro-crystallography comes of age. Curr Opin Struct Biol. 22 (5), 602-612 (2012).
- Boudes, M., Garriga, D., Coulibaly, F. Reflections on the Many Facets of Protein Microcrystallography. Aust J Chem. 67 (12), 1793-1806 (2014).
- Nelson, R., et al. Structure of the cross-beta spine of amyloid-like fibrils. Nature. 435 (7043), 773-778 (2005).
- Coulibaly, F., et al. The molecular organization of cypovirus polyhedra. Nature. 446 (7131), 97-101 (2007).
- Coulibaly, F., et al. The atomic structure of baculovirus polyhedra reveals the independent emergence of infectious crystals in DNA and RNA viruses. Proc Natl Acad Sci U S A. 106 (52), 22205-22210 (2009).
- Johansson, L. C., et al. Structure of a photosynthetic reaction centre determined by serial femtosecond crystallography. Nat Comm. 4, (2013).
- Li, D., Boland, C., Aragao, D., Walsh, K., Caffrey, M. Harvesting and Cryo-cooling Crystals of Membrane Proteins Grown in Lipidic Mesophases for Structure Determination by Macromolecular Crystallography. J Vis Exp. (67), (2012).
- Roedig, P., et al. A micro-patterned silicon chip as sample holder for macromolecular crystallography experiments with minimal background scattering. Sci Rep. 5, 10451(2015).
- Koopmann, R., et al. In vivo protein crystallization opens new routes in structural biology. Nature Methods. 9 (3), 259-262 (2012).
- Gallat, F. -X., et al. In vivo crystallography at X-ray free-electron lasers: the next generation of structural biology. Phil Trans R Soc B. 369 (1647), 20130497(2014).
- Duszenko, M., et al. In vivo protein crystallization in combination with highly brilliant radiation sources offers novel opportunities for the structural analysis of post-translationally modified eukaryotic proteins. Acta Cryst. F. 71 (8), 929-937 (2015).
- Axford, D., Ji, X., Stuart, D. I., Sutton, G. In cellulo structure determination of a novel cypovirus polyhedrin. Acta Cryst D. 70 (5), 1435-1441 (2014).
- Sawaya, M. R., et al. Protein crystal structure obtained at 2.9 Å resolution from injecting bacterial cells into an X-ray free-electron laser beam. Proc Natl Acad Sci U S A. 111 (35), 12769-12774 (2014).
- Tsutsui, H., et al. A Diffraction-Quality Protein Crystal Processed as an Autophagic Cargo. Mol Cell. 58 (1), 186-193 (2015).
- Boudes, M., Garriga, D., Fryga, A., Caradoc-Davies, T., Coulibaly, F. A pipeline for structure determination of in vivo-grown crystals using in cellulo diffraction. Acta Cryst D. 72, 576-585 (2016).
- Doye, J. P. K., Poon, W. C. K. Protein crystallization in vivo. Curr Opin Colloid Interface Sci. 11 (1), 40-46 (2006).
- Mori, H., et al. Expression of Bombyx mori cytoplasmic polyhedrosis virus polyhedrin in insect cells by using a baculovirus expression vector, and its assembly into polyhedra. J Gen Virol. 74, Pt 1 99-102 (1993).
- Arevalo, M. T., Wong, T. M., Ross, T. M. Expression and Purification of Virus-like Particles for Vaccination. J Vis Exp. (112), (2016).
- Yates, L. A., Gilbert, R. J. C. Efficient Production and Purification of Recombinant Murine Kindlin-3 from Insect Cells for Biophysical Studies. J Vis Exp. (85), (2014).
- Berger, I., et al. The MultiBac Protein Complex Production Platform at the EMBL. J Vis Exp. (77), (2013).
- Margine, I., Palese, P., Krammer, F. Expression of Functional Recombinant Hemagglutinin and Neuraminidase Proteins from the Novel H7N9 Influenza Virus Using the Baculovirus Expression System. J Vis Exp. (81), (2013).
- Khurana, A., Kronenberg, M. A Method For Production of Recombinant mCD1d Protein in Insect Cells. J Vis Exp. (10), (2007).
- Ricardo, R., Phelan, K. Counting and Determining the Viability of Cultured Cells. J Vis Exp. (16), (2008).
- Baskaran, Y., et al. An in cellulo-derived structure of PAK4 in complex with its inhibitor Inka1. Nat Comm. 6, 1-11 (2015).
- Armour, B. L., et al. Multi-target Parallel Processing Approach for Gene-to-structure Determination of the Influenza Polymerase PB2 Subunit. J Vis Exp. (76), (2013).
- Otwinowski, Z., Minor, W. Processing of X-ray diffraction data collected in oscillation mode. Methods Enzymol. 276, 307-326 (1997).
- Battye, T. G. G., Kontogiannis, L., Johnson, O., Powell, H. R., Leslie, A. G. W. iMOSFLM: a new graphical interface for diffraction-image processing with MOSFLM. Acta Cryst D. 67, Pt 4 271-281 (2011).
- Kabsch, W. XDS. Acta Cryst D. 66, Pt 2 125-132 (2010).
- French, S., Wilson, K. On the treatment of negative intensity observations. Acta Cryst.A. 34, 517-525 (1978).
- Winn, M. D., et al. Overview of the CCP4 suite and current developments. Acta Cryst D. 67, Pt 4 235-242 (2011).
- Foadi, J., et al. Clustering procedures for the optimal selection of data sets from multiple crystals in macromolecular crystallography. Acta Cryst D. 69 (8), 1617-1632 (2013).
- Rey, F. A. Virology: holed up in a natural crystal. Nature. 446 (7131), 35-37 (2007).
- Schönherr, R., et al. Real-time investigation of dynamic protein crystallization in living cells. Struct Dyn. 2 (4), 041712(2015).
- Hasegawa, H., et al. In vivo crystallization of human IgG in the endoplasmic reticulum of engineered Chinese hamster ovary (CHO) cells. J Biol Chem. 286 (22), 19917-19931 (2011).
- Ishchenko, A., Cherezov, V., Liu, W. Preparation and Delivery of Protein Microcrystals in Lipidic Cubic Phase for Serial Femtosecond Crystallography. J Vis Exp. (115), e54463(2016).
- Zander, U., et al. MeshAndCollect: an automated multi-crystal data-collection workflow for synchrotron macromolecular crystallography beamlines. Acta Cryst. D. 71, 2328-2343 (2015).
- Fan, G. Y., et al. In vivo calcineurin crystals formed using the baculovirus expression system. Micros Res Tech. 34 (1), 77-86 (1996).
- Nass, K. Investigation of protein structure determination using X-ray free-electron lasers. , Hamburg University. PhD dissertation (2013).
Access restricted. Please log in or start a trial to view this content.
Reprints and Permissions
Request permission to reuse the text or figures of this JoVE article
Request Permission