This protocol describes the implementation of an asymmetric-detection time-stretch optical microscopy system for single-cell imaging in ultrafast microfluidic flow and its applications in imaging flow cytometry.
A subscription to JoVE is required to view this content. Sign in or start your free trial.
Method Article
Microfluidic Imaging Flow Cytometry by Asymmetric-detection Time-stretch Optical Microscopy (ATOM)
In This Article
Summary
Abstract
Scaling the number of measurable parameters, which allows for multidimensional data analysis and thus higher-confidence statistical results, has been the main trend in the advanced development of flow cytometry. Notably, adding high-resolution imaging capabilities allows for the complex morphological analysis of cellular/sub-cellular structures. This is not possible with standard flow cytometers. However, it is valuable for advancing our knowledge of cellular functions and can benefit life science research, clinical diagnostics, and environmental monitoring. Incorporating imaging capabilities into flow cytometry compromises the assay throughput, primarily due to the limitations on speed and sensitivity in the camera technologies. To overcome this speed or throughput challenge facing imaging flow cytometry while preserving the image quality, asymmetric-detection time-stretch optical microscopy (ATOM) has been demonstrated to enable high-contrast, single-cell imaging with sub-cellular resolution, at an imaging throughput as high as 100,000 cells/s. Based on the imaging concept of conventional time-stretch imaging, which relies on all-optical image encoding and retrieval through the use of ultrafast broadband laser pulses, ATOM further advances imaging performance by enhancing the image contrast of unlabeled/unstained cells. This is achieved by accessing the phase-gradient information of the cells, which is spectrally encoded into single-shot broadband pulses. Hence, ATOM is particularly advantageous in high-throughput measurements of single-cell morphology and texture – information indicative of cell types, states, and even functions. Ultimately, this could become a powerful imaging flow cytometry platform for the biophysical phenotyping of cells, complementing the current state-of-the-art biochemical-marker-based cellular assay. This work describes a protocol to establish the key modules of an ATOM system (from optical frontend to data processing and visualization backend), as well as the workflow of imaging flow cytometry based on ATOM, using human cells and micro-algae as the examples.
Introduction
Optical imaging presents a powerful tool and cell-based assay to (almost) non-invasively visualize the detailed spatial distribution of many cellular/subcellular components, thus uncovering a multitude of morphological, biophysical, and biomolecular signatures of cells. However, this ability to extract high-content information from single cells has generally been compromised when an enormous and heterogeneous population of cells had to be investigated. This marks a common trade-off in cell-based assays between measurement throughput and content. A notable example is that adding imaging capability to flow cytometry has resulted in a down-scaling of throughput by at least 1-2 orders of magnitude compared to that of the classical non-imaging flow cytometers. Although it could offer complex morphological single-cell analysis that is not possible with standard flow cytometers1, imaging flow cytometry generally lacks sufficient throughput to identify cellular heterogeneity with high statistical confidence. This is necessary for new discoveries in biology and for gaining an understanding of the pathogenesis of diseases. The key technical challenge lies in the inherent speed limit imposed by the common optical imaging strategies: laser-beam scanning, (e.g., by galvanometric mirrors), and/or image sensors (e.g., charge-coupled device (CCD) and complementary metal-oxide semiconductor (CMOS)). The laser scanning speed is intrinsically restricted by the mechanical inertia of the scanning mirrors, whereas the frame rate of CCD or CMOS is limited by the fundamental trade-off between imaging speed and sensitivity (i.e., increasing the frame rate leads to reduced signal detection sensitivity, and vice versa).
Based on an all-optical, ultrafast image-encoding mechanism, optical time-stretch imaging has been demonstrated as an attractive platform for high-throughput imaging flow cytometers, without need of the conventional image sensors or mechanical laser scanning2,3. Detailed descriptions of the working principle of time-stretch imaging can be found in references4,5,6,7. In brief, it consists of two interchangeable mapping steps: (i) spectral encoding (wavelength-space mapping), in which the spatial coordinates of the imaged specimen are mapped to different wavelengths across the spectrum of the light-pulsed beam8,9, and (ii) a dispersive Fourier transformation (wavelength-time mapping)9, in which the wavelength components of individual laser pulses are transformed (stretched) via group velocity dispersion (GVD) into temporal (wavelength-swept) waveforms (Figure 1). An important feature of time-stretch imaging is optical amplification, which plays a critical role in combatting the loss of sensitivity due to ultrafast photodetection and GVD loss, thus enhancing the image signal-to-noise ratio (SNR) without being contaminated by the photodetector noise9. Since each laser pulse encodes a line-scan of the imaged specimen, which is orthogonal to the unidirectional flow of the cells, an effective line-scan rate is determined by the laser repetition rate, which is typically beyond 10 MHz. This ultrafast operation enables blur-free, single-cell image capture at a throughput of 10,000-100,000 cells/s (i.e., 10-100 times higher than conventional imaging flow cytometry). As a result, time-stretch imaging could find unique applications in high-throughput, single-cell, image-based screening, especially when there is a need for identifying unknown heterogeneity or rare/aberrant cells within a sizable population (thousands to millions of cells), such as rare cancer cell screening10 or micro-algae classification11.
Time-stretch imaging predominantly relies on bright-field (BF) image capture, from which the image contrast is generated through light scattering and absorption from the cells2,3,9,10,11. Such label-free, single-cell imaging capabilities could bypass the detrimental effects associated with the fluorescent labels, such as cytotoxicity and photobleaching, and yet provide valuable information for single-cell analysis based on the cellular and sub-cellular texture and morphology. These label-free parameters are proven to be effective for the deep image classification of cells, especially when an enormous cell population is available11,12. However, in many occasions, BF imaging fails to provide sufficient contrast to reveal the detailed morphology of the label-free transparent cells. Different label-free, phase-contrast, time-stretch imaging modalities have been developed for enhancing the imaging contrast at ultrafast frame rates13,14,15. Among these techniques, asymmetric-detection time-stretch optical microscopy (ATOM) was developed to reveal the phase-gradient (differential-interference-contrast-(DIC)-like) contrast based on a concept similar to Schlieren photography, enabling the label-free, high-contrast imaging of single cells at an ultrahigh microfluidic speed (up to 10 m/s)16. This effect can be readily generated through oblique detection or illumination by partially blocking the image-encoded beam path or tilting the beam before photodetection. Another advantage of ATOM is its ability to simultaneously acquire two phase-gradient contrasts along opposite orientations. Intensity subtraction and summation of two opposite-contrast images yield the differential phase-gradient contrast and the absorption contrast, respectively, from the same line-scan. This work presents a detailed protocol describing the implementation of ATOM, including the establishment of the optical setup, the sample preparation, and the data acquisition and visualization. Specifically, this work demonstrates the ATOM operation with single-cell imaging of human blood cells, cancer cells, and phytoplankton (microalgae). This highlights the applicability of ATOM to imaging flow cytometry, not only in the biomedical arena, but also in marine and biofuel research17,18.
Access restricted. Please log in or start a trial to view this content.
Protocol
1. Sample Preparation
- Sample preparation (adherent cells; MCF-7 cells)
- Take out the cell culture dish from the incubator and drain the culture medium.
- Rinse the cells on a dish with 1x phosphate-buffered saline (PBS) to remove excessive culture medium.
- Add 3 mL of a solution of 0.25% trypsin to the culture dish (diameter of 100 mm) and put it in a 37 °C, 5% CO2 incubator for 4 min.
NOTE: The trypsin dissolves the adhesive protein of the cells so that they will detach from the culture dish. - Check to see if all the cells have detached from the culture dish using a light microscope (10X objective). If not, gently shake the cell culture dish.
- Add 4 mL of the standard culture medium (formulated with 89% Dulbecco's Modified Eagle Medium (DMEM), 10% fetal bovine serum (FBS), and 1% penicillin-streptomycin (PS)) to stop the action of the trypsin.
- Transfer the whole mixture (cells in trypsin solution and culture medium) to a centrifuge tube and centrifuge for 5 min at 200 x g.
- Remove all the fluid and re-suspend the cells in 1 mL of 1x PBS (pH value: 7.4, pre-heated to 37 °C).
- Sample preparation (cultured micro-algae)
- Transfer the cultured micro-algae and the culture medium (e.g., sea water, agar, or fresh water) to new glass culture tubes (~15 mL) in a volume ratio (micro-algae to culture medium) of 1:5 to establish a new sub-culture medium.
- Place the glass culture tubes in a dust-proof chamber under constant illumination by artificial lighting from fluorescent bulbs according to a light/dark (LD) cycle (usually LD 16:8) for 72 - 120 h before the experiment.
- Transfer the sub-cultured samples to a centrifuge tube and mix well.
2. ATOM System Setup
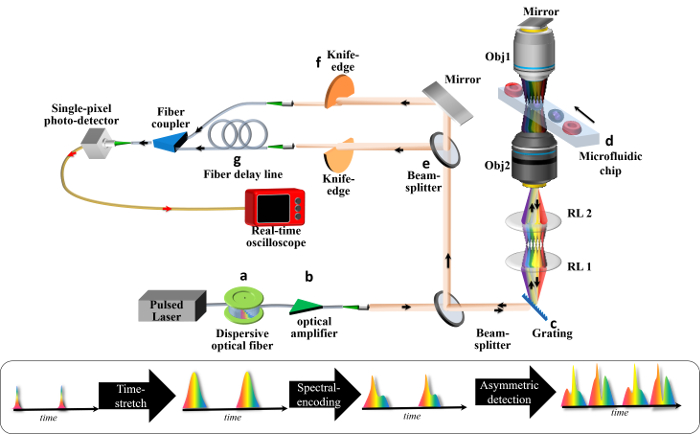
Figure 1: Schematic of an ATOM System. A broadband pulsed laser is employed to deliver ultrafast pulses to (a) a time-stretch module and (b) an in-line optical amplifier module. The time-stretch module generates a train of temporal waveforms, each of which is the replica of the wavelength spectrum of the laser source, (i.e., wavelength-to-time mapping). The amplifier module is used to for pulse-stretching (dispersive) loss compensation. The stretched pulse is then (c) spatially dispersed by a diffraction grating, forming a 1D spectral shower illumination in which individual wavelength components are relayed by a relay lens pair and focused by the objective lens onto different positions on the flowing cell inside the (d) microfluidic chip. This is the process of spectral-encoding. The spectrally encoded light will again pass the cell through another objective lens and a mirror, returning to the diffraction grating and recombining as a spatially undispersed pulsed beam. This image-encoded pulsed beam is then (e) split into two paths, such that both beams are partially blocked with (f) the knife edge, but from opposite directions, before being coupled into the fibers. These two beams represent the two (opposite) encoded phase-gradient contrasts of the final image. For the simultaneous detection of both signal contrasts, one of the signals undergoes (g) a time-delay line, such that the two signals are multiplexed (interleaved) in time. A high-speed photodetector and real-time oscilloscope are used for data acquisition. Please click here to view a larger version of this figure.
- Time stretch module
- Employ a broadband femtosecond (fs) or picosecond (ps) pulsed laser source with a recommended center wavelength in the near infrared (NIR) range, 800-1,500 nm.
NOTE: The typical required pulse width can range from sub-100 fs to a few ps. Detailed requirements of the pulsed laser sources can be seen in References 4 and 5. Important metrics are highlighted in Table 1.- Ensure that the laser source has a high repetition rate, which should be in the megahertz regime (e.g., tens of MHz) to ensure ultrafast imaging in ATOM. Also, set the peak output laser power well below the damage power threshold of the fiber cavity, approximately 1 kW.
- Ensure good shot-to-shot temporal and spectral stability of the pulsed laser source.
NOTE: Typical tolerance in the spectral amplitude fluctuation should be kept within 1.2%19,20,21, as achieved by the fiber mode-locked laser in this setup.
NOTE: The optical bandwidth of the laser source is expected to be 10-100 nm, which is essential to guarantee sufficient imaging field-of-view (FOV) in single-cell imaging21.
- Through a fiber collimator, couple the laser pulsed beam to a single-mode dispersive optical fiber, in which the pulses are stretched via group velocity dispersion (GVD) (Figure 1a).
NOTE: This is the process after which the spectrum of each pulse is mapped onto time as a wavelength-swept waveform (i.e., wavelength-to-time mapping).
NOTE: The total required GVD should be sufficient to ensure that the overall ATOM image resolution is not affected by the wavelength-to-time mapping process (See the Discussion). Typically, in the NIR range, the GVD should be well beyond 0.1 ns/nm. For instance, a single-mode fiber employed in this current setup provides a total GVD of 0.38 ns/nm around the wavelength of 1,060 nm (a total fiber length of 10 km).
- Employ a broadband femtosecond (fs) or picosecond (ps) pulsed laser source with a recommended center wavelength in the near infrared (NIR) range, 800-1,500 nm.
- Spectral-encoding module
- Construct an optical microscope system to perform the spectrally encoded imaging of the cells flowing along the microfluidic channel, as illustrated in Figure 1.
NOTE: The key components of this optical microscope include: (1) a diffraction grating, a telescopic relay-lens module (RL1 and RL2 in Figure 1), and two objective lenses (Obj1 and Obj2 in Figure 1).- First, illuminate the time-stretched and collimated beam onto a diffraction grating (transmission-type grating is employed in this setup) to generate a spectral shower (Figure 1c).
NOTE: The power of the diffracted beam (i.e., diffraction efficiency) can be maximized by adjusting the grating orientation closed to the Littrow configuration. - Configure the two relay lenses (RL1 and RL2) in a 4-f imaging system (i.e., place the diffraction grating on the focal plane of RL1 and separate RL1 and RL2 by a distance equal to the sum of their focal lengths. The spectral shower will then be imaged onto the back focal plane of the objective lens Obj1).
- Carefully align the spectral shower to fill the back aperture of the Obj1, such that the spectral shower can be projected and focused onto the image plane of the microscope.
NOTE: Here, the NA of the objective lens (Obj1 in Figure 1) is 0.75. - Place another objective lens (Obj2 in Figure 1) with a similar NA and a plane mirror at the back aperture of this objective lens (Obj2), such that the spectral shower beam can be aligned to double-pass the image plane and return to the diffraction grating.
- Adjust the pair of objective lenses (Obj1 and Obj2) such that their focal planes overlap with each other. Check to see if the spectral shower double-passes the image plane at the same location and returns to the grating following the same path. If not, perform further alignment and tuning of the optical system.
NOTE: The returned light should pass through an additional beam-splitter, such that the light can be transmitted to an asymmetric detection module. - Adjust the optical amplifier gain at a suitable level, such that the resultant signal can be detected by the photodetector with a good SNR, which is typically at >10 dB.
- Place and adjust the position of the microfluidic chip on the sample platform and make sure that the spectral shower, and thus the imaging area, is placed across the microfluidic channel (Figure 1d).
NOTE: The spectral shower is illuminated orthogonally to the flow direction of fluidics inside the microfluidic chip, such that the flowing motion automatically performs two-dimensional (2D) scans.
- First, illuminate the time-stretched and collimated beam onto a diffraction grating (transmission-type grating is employed in this setup) to generate a spectral shower (Figure 1c).
- Construct an optical microscope system to perform the spectrally encoded imaging of the cells flowing along the microfluidic channel, as illustrated in Figure 1.
- Asymmetric detection module
- Place an additional beam-splitter to separate the imaged-encoded beam into two (Figure 1e).
NOTE: Each beam replica is partially blocked by a knife edge. - Measure and record the optical power of the beam before the beam block. Then, manually position the knife edges (mounted on a linear translation stage) such that they roughly block half of the beam (by visual inspection). Afterward, use the optical power meter to monitor the beam power while fine-tuning the position of the knife edges by translating them across the beam.
NOTE: It is suggested that the optimal position is where the power is decreased by ~50% of the original value (i.e., the unblocked case). This is the condition that provides the best combination of image signal strength and image contrast enhancement. - Repeat step 2.3.2 for another beam replica. Note that the orientation of the partial beam block for one beam should be opposite with respect to the other beam (Figure 1f).
- Couple the two partially-blocked beams into two separate, single-mode fiber arms through two-fiber collimators.
NOTE: One of the arms has an extra length of fiber, serving as a fiber-based delay-line, to introduce a time-delay with respect to the other replica (without the delay-line) (Figure 1g). Both are directed to a single fiber by a fiber coupler before photodetection. The time-delay should be long enough to temporally separate the two replicas and short enough to avoid temporal overlap with the next waveform (i.e., the two replicas are always time-interleaved and time-multiplexed in a single fiber prior to detection (Figure 2a)). - Capture and digitize the detected optical signals with the real-time oscilloscope. Note that the bandwidth and thus the sampling rate of the oscilloscope should be sufficiently high to ensure that they do not influence the final image resolution (See the Discussion).
NOTE: Here, with the GVD of 0.38 ns/nm, a backend acquisition bandwidth and sampling rate of >20 GHz and >40 GSa/s, respectively, are required.
- Place an additional beam-splitter to separate the imaged-encoded beam into two (Figure 1e).
3. Experimental Procedures
- Specimen loading
- Perform cell counting under a conventional phase contrast microscope in a standard hemocytometer.
- Adjust the cell density by diluting with 1x PBS (with spring water for micro-algae) and mix well with a pipette.
NOTE: The suggested concentration is from 105 to 106 cells/mL. - Mount the microfluidic chip onto the sample platform of the optical imaging system.
NOTE: The microfluidic chip is primarily made of polydimethylsiloxane (PDMS) and is fabricated using the standard replica molding method. The microfluidic channel is designed with an asymmetric curved channel to generate the inertial flow focusing effect, such that the cells can flow in single file in the imaging section (with a dimension of 80 µm x 80 µm (height x width)) at high speed. - Transfer the density-adjusted cell solution to a 10 mL syringe.
- Connect the syringe to the inlet of the microfluidic chip and a centrifugal tube to the outlet of the microfluidic chip for disposal collection.
- Mount the syringe onto a syringe pump and set a suitable flow rate to give desirable throughput and to avoid imposing excessive shear force between the cells and the channel.
NOTE: The linear speed of the samples should be within 0.5 and 10 m/s. Note that before the actual image recording, it is often necessary to further fine-tune the system, in terms of maximizing the image signal strength and optimizing the image focusing by repeating steps 2.2.1.4-2.2.1.6.
4. Data Acquisition
- Set a suitable number of data points to be saved for each experiment. The number of data points to be saved depends on the size and flow rate of the samples.
NOTE: Typically, it is set to 8-16 million sample points under a sampling rate of 80 GSa/s. - Acquire and save the data in a batch mode using the oscilloscope.
5. Backend Processing
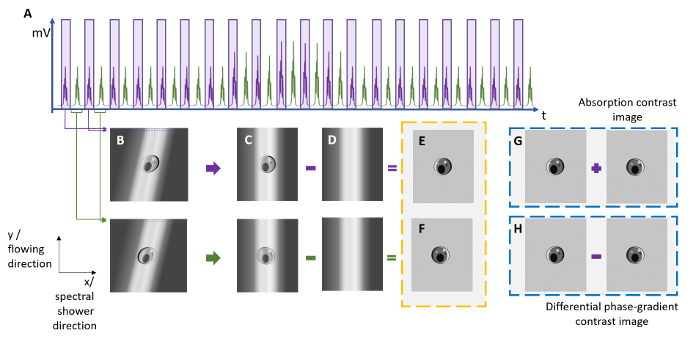
Figure 2: Reconstruction of ATOM Images from the Line-scan Time Trace. To reconstruct the ATOM images with the absorption contrast and differential (enhanced) phase-gradient contrast, two sets of time-stretched pulses (see the purple and green pulses) are extracted from (a) the time-multiplexed temporal waveform trace and are then digitally segmented and stacked to form (b) two 2D images showing the two opposite phase-gradient contrasts. Note that a shearing operation is needed to form (c) the distortion-free images by compensating for the sub-index shift due to the round-off error in the laser repetition rate estimation. By subtracting the (d) raw line-scan from the spectral intensity envelope of the laser source, the background of the images can be removed. (g) An absorption contrast image can be obtained by a pixel-by-pixel intensity summation of images (e) and (f), whereas (h) a differential phase-gradient contrast image can be obtained from the subtraction of images (e) and (f). Please click here to view a larger version of this figure.
- Transfer the data from the oscilloscope to the computers for offline image reconstruction.
NOTE: Here, the data are stored in a portable hard disk and transferred manually between the oscilloscope and the processing computers. The capacity of the hard disk should be more than 500 GB for each experiment.- Use the key image reconstruction routine to digitally stack the line-scans to form a 2D image (Figure 2).
NOTE: The custom program (in MATLAB) then produces two asymmetric detection images by separating the two time-multiplexed data sets (purple and green waveforms in Figure 2).- Obtain a differential phase-gradient contrast image by subtracting the intensities of the two asymmetric detection images; an absorption contrast image can be obtained by adding the two asymmetric detection images. See selected images of MCF-7 and micro-algae in Figure 3. Note that the background profiles of individual images should first be eliminated, and their intensities should be normalized, prior to the image summation and subtraction operations.
- Generate a library of parameters derived from the images, such as cell volume, circularity, and absorption density, etc. for further analysis.
- Use the key image reconstruction routine to digitally stack the line-scans to form a 2D image (Figure 2).
- Input the library of data into the data visualization platform (Figure 4).
- Load the library of parameters and the corresponding reconstructed images to the visualization interface platform.
- Set the axes to be the parameters of interest.
NOTE: The parameters are problem-specific and are defined by the user. They are derived from the ATOM images by the MATLAB program. Here, the optical absorption density of the cell, cell area, cell volume, and cell circularity are available for selection. - Select the dataset to be displayed, such that every cell image can be visualized as a different data point on the scatter plot.
- Move the mouse cursor to each point, such that the corresponding image and other parameters are shown in a floating sub-window.
NOTE: The axes can be changed between the linear and logarithmic scales in an interactive manner. - Perform further analysis of any subset of the dataset by manually gating on the scatter plot.
NOTE: The histogram in every parameter of the gated subset can be plotted against those of the entire library. The separate histograms are displayed in another floating sub-window.
Access restricted. Please log in or start a trial to view this content.
Results
This work illustrates two single-cell imaging demonstrations by ATOM: one with mammalian cells (human peripheral blood mononuclear cells (PBMC) and breast cancer cells (MCF-7)) and another with phytoplanktons (Scenedesmus and Chlamydomonas). The first experiment was motivated by the growing interest in liquid biopsy for the detection, enumeration, and characterization of circulating tumor cells (CTCs) in the blood23. The ability to...
Access restricted. Please log in or start a trial to view this content.
Discussion
There are several technical details that require special attention during the ATOM system setup. First, it is essential to note that asymmetric/oblique spectrally-encoded illumination could introduce residual phase-gradient components (i.e., the shadowing effect) in the absorption contrast and influence the enhancement of phase-gradient contrast in ATOM. Therefore, this effect of oblique illumination should be minimized. Second, it should be emphasized that the time-multiplexing or time-interleaving schemeinvolv...
Access restricted. Please log in or start a trial to view this content.
Disclosures
The authors have nothing to disclose.
Acknowledgements
We thank Mr. P. Yeung for preparing the MCF-7 for us. This work was partially supported by grants from the Research Grant Council of the Hong Kong Special Administration Region, China (Project no. 17259316, 17207715, 17207714, 17205215, and HKU 720112E), the Innovation and Technology Support Programme (ITS/090/14), and the University Development Fund of HKU.
Access restricted. Please log in or start a trial to view this content.
Materials
| Name | Company | Catalog Number | Comments |
|---|---|---|---|
| Nikon Plan Fluorite Physiology Objectives 40X | Nikon | MRF07420 | Objective lens (Obj2) |
| Olympus Plan Fluorite Objective, 0.75 NA, 0.51 mm WD, 40X | Olympus | RMS40X-PF | Objective lens (Obj1) |
| N-BK7 Plano-Convex Lenses | Thorlabs | LA1145-C | For relaying spectral shower |
| FC/APC Fiber Collimation Package | Thorlabs | F220APC-1064 | For outputing and collecting laser pulses |
| Pellicle beamsplitter | Thorlabs | BP145B3 | For making beam replica |
| Protected silver mirror | Thorlabs | PF10-03-P01 | For reflecting light |
| 800-1650nm 12GHz single mode DC-coupled NIR Photoreceiver | Newport | 1544-B | For converting light into electrical signal |
| Infiniium High-Performance Oscilloscope | Agilent | DSOX91604A | To save the light-converted electrical signals |
| HI1060 optical fiber | Corning | HI1060 | Optical fiber for time-stretch |
| YTTERBIUM DOPED FIBER AMPLIFIER | Keopsys | KPS-STD-BT-YFA-37-BO-SM-111-FA-FA | Optical in-line amplifier |
| Holographic grating | Wasatch Photonics | 020305-6 | Grating |
| Infuse/Withdraw Syringe Pumps | Harvard Apparatus | PHD 2000 | Syringe pump for sample loading in micro-fluidic channels |
References
- Lau, A. K. S., Wong, T. T. W., Shum, H. C., Wong, K. K. Y., Tsia, K. K. Imaging Flow Cytometry: Methods and Protocols. Barteneva, N. S., Vorobjev, I. A. , Springer New York. New York, NY. 23-45 (2016).
- Goda, K., Tsia, K. K., Jalali, B. Serial time-encoded amplified imaging for real-time observation of fast dynamic phenomena. Nature. 458 (7242), 1145-1149 (2009).
- Goda, K., Jalali, B. Dispersive Fourier transformation for fast continuous single-shot measurements. Nat Photon. 7 (2), 102-112 (2013).
- Lau, A. K., Shum, H. C., Wong, K. K., Tsia, K. K. Optofluidic time-stretch imaging - an emerging tool for high-throughput imaging flow cytometry. Lab Chip. 16 (10), 1743-1756 (2016).
- Lau, A. K. S., Tang, A. H. L., Xu, J., Wong, X. W., Y, K. K., Tsia, K. K. Optical Time Stretch for High-Speed and High-Throughput Imaging - From Single-Cell to Tissue-Wide Scales. IEEE J. Sel. Top. in Quant. Electron. 22 (4), (2016).
- Lei, C., Guo, B., Cheng, Z., Goda, K. Optical time-stretch imaging: Principles and applications. Appl Phys Rev. 3 (1), 011102(2016).
- Lei, C., Guo, B., Cheng, Z., Goda, K. Optical time-stretch imaging: Principles and applications. Applied Physics Reviews. 3 (011102), (2016).
- Goda, K., et al. High-throughput single-microparticle imaging flow analyzer. Proc Natl Acad Sci U S A. 109 (29), 11630-11635 (2012).
- Goda, K., Solli, D. R., Tsia, K. K., Jalali, B. Theory of amplified dispersive Fourier transformation. Physical Review A. 80 (4), 043821(2009).
- Goda, K., et al. High-throughput single-microparticle imaging flow analyzer. Proc Natl Acad Sci U S A. 109 (29), 11630-11635 (2012).
- Lai, Q. T. K., et al. High-throughput time-stretch imaging flow cytometry for multi-class classification of phytoplankton. Opt. Express. 24 (25), 28170-28184 (2016).
- Chen, C. L., et al. Deep Learning in Label-free Cell Classification. Sci Rep. 6, 21471(2016).
- Fard, A. M., et al. Nomarski serial time-encoded amplified microscopy for high-speed contrast-enhanced imaging of transparent media. Biomed Opt Express. 2 (12), 3387-3392 (2011).
- Lau, A. K., et al. Interferometric time-stretch microscopy for ultrafast quantitative cellular and tissue imaging at 1 mum. J Biomed Opt. 19 (7), 76001(2014).
- Mahjoubfar, A., Chen, C., Niazi, K. R., Rabizadeh, S., Jalali, B. Label-free high-throughput cell screening in flow. Biomed Opt Express. 4 (9), 1618-1625 (2013).
- Wong, T. T., et al. Asymmetric-detection time-stretch optical microscopy (ATOM) for ultrafast high-contrast cellular imaging in flow. Sci Rep. 4, 3656(2014).
- Mata, T. M., Martins, A. A., Caetano, N. S. Microalgae for biodiesel production and other applications: A review. Renew Sustainable Energy Rev. 14 (1), 217-232 (2010).
- Irigoien, X., Huisman, J., Harris, R. P. Global biodiversity patterns of marine phytoplankton and zooplankton. Nature. 429 (6994), 863-867 (2004).
- Wei, X., et al. Coherent Laser Source for High Frame-Rate Optical Time-Stretch Microscopy at 1.0 µm. IEEE J. Sel. Top. Quantum Electron. 20 (5), 384-389 (2014).
- Wei, X., et al. Breathing laser as an inertia-free swept source for high-quality ultrafast optical bioimaging. Opt. Lett. 39 (23), 6593-6596 (2014).
- Xu, Y., Wei, X., Ren, Z., Wong, K. K. Y., Tsia, K. K. Ultrafast measurements of optical spectral coherence by single-shot time-stretch interferometry. Sci Rep. 6, 27937(2016).
- Tsia, K. K., Goda, K., Capewell, D., Jalali, B. Performance of serial time-encoded amplified microscope. Opt. Express. 18 (10), 10016-10028 (2010).
- Alix-Panabières, C., Pantel, K. Challenges in circulating tumour cell research. Nat Rev Cancer. 14 (9), 623-631 (2014).
- Kling, J. Beyond counting tumor cells. Nat Biotech. 30 (7), 578-580 (2012).
- Hodgkinson, C. L., et al. Tumorigenicity and genetic profiling of circulating tumor cells in small-cell lung cancer. Nat Med. 20 (8), 897-903 (2014).
- Ozkumur, E., et al. Inertial focusing for tumor antigen-dependent and -independent sorting of rare circulating tumor cells. Sci Transl Med. 5 (179), (2013).
- Hou, H. W., et al. Isolation and retrieval of circulating tumor cells using centrifugal forces. Scientific Reports. 3, 1259(2013).
- Karabacak, N. M., et al. marker-free isolation of circulating tumor cells from blood samples. Nat. Protocols. 9 (3), 694-710 (2014).
- Krebs, M. G., et al. Molecular analysis of circulating tumour cells-biology and biomarkers. Nat Rev Clin Oncol. 11 (3), 129-144 (2014).
- Wu, J., et al. Ultrafast Laser-Scanning Time-Stretch Imaging at Visible Wavelengths. Light Sci Appl. , (2016).
Access restricted. Please log in or start a trial to view this content.
Reprints and Permissions
