The power input in stirred bioreactors can be measured through the torque that acts on the impeller shaft during rotation. This manuscript describes how an air bearing can be used to effectively reduce friction losses observed in mechanical seals and improve the accuracy of power input measurements in small-scale vessels.
Method Article
Power Input Measurements in Stirred Bioreactors at Laboratory Scale
Opens in a new tab
In This Article
Summary
Loading...
$$\rightleftharpoonup{xx}$$
$$\longleftharp{xx}$$,
$$\longrightharp{xx}$$,
Abstract
Loading...
$$\rightleftharpoonup{xx}$$
$$\longleftharp{xx}$$,
$$\longrightharp{xx}$$,
The power input in stirred bioreactors is an important scaling-up parameter and can be measured through the torque that acts on the impeller shaft during rotation. However, the experimental determination of the power input in small-scale vessels is still challenging due to relatively high friction losses inside typically used bushings, bearings and/or shaft seals and the accuracy of commercially available torque meters. Thus, only limited data for small-scale bioreactors, in particular single-use systems, is available in the literature, making comparisons among different single-use systems and their conventional counterparts difficult.
This manuscript provides a protocol on how to measure power inputs in benchtop scale bioreactors over a wide range of turbulence conditions, which can be described by the dimensionless Reynolds number (Re). The aforementioned friction losses are effectively reduced by the use of an air bearing. The procedure on how to set up, conduct and evaluate a torque-based power input measurement, with special focus on cell culture typical agitation conditions with low to moderate turbulence (100 < Re < 2·104), is described in detail. The power input of several multi-use and single-use bioreactors is provided by the dimensionless power number (also called Newton number, P0), which is determined to be in the range of P0 ≈ 0.3 and P0 ≈ 4.5 for the maximum Reynolds numbers in the different bioreactors.
Introduction
Loading...
$$\rightleftharpoonup{xx}$$
$$\longleftharp{xx}$$,
$$\longrightharp{xx}$$,
Power input is a key engineering parameter for the characterization and scaling-up of bioreactors because it relates to many unit operations, such as homogenization1,2,3, gas-liquid dispersion2,4,5, heat transfer6 and solid suspension7. Power input is associated also with shear stress, which can particularly affect growth and product formation in shear sensitive cell cultures8,9,10,11.
The most common techniques for the measurement of the power input in stirred bioreactors are based on electrical power draw12,13,14, calorimetry12,15 (i.e. stationary heat balance or dynamic heating through the agitation) or the torque upon the agitator. The latter can be experimentally determined by dynamometers, torque meters or strain gauges, which have been applied for a variety of agitators, including single or multi-stage Rushton turbines1,16,17,18,19,20,21,22,23,24,25, pitched blade impellers19,20,23,26,27, InterMig19,21 and Scaba impellers28,29. A detailed review is provided by Ascanio et al. (2004)30.
From the torque (T), the power input (P) can be estimated from Eq. 1, where N is the rotational speed of the agitator.
 (1)
(1)
In order to account for losses occurring in the agitation (in bearings, seals and the motor itself), the effective torque (Teff) should be determined as the difference between the value measured in the empty vessel (TD) and in the liquid (TL). Finally, the dimensionless power number (P0, also known as Newton number), which is defined by Eq. 2 where ρL denotes the liquid density and d represents the impeller diameter, can be used to compare different agitators.
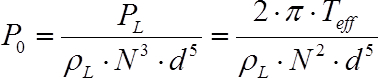 (2)
(2)
It is well-known that the power number is a function of the Reynolds number (i.e. the turbulence) and becomes constant under fully turbulent conditions. The impeller Reynolds number is defined by Eq. 3, where ηL is the liquid viscosity.
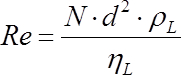 (3)
(3)
Nevertheless, power input measurements in small scale bioreactors are still challenging due to the relatively high friction losses inside mechanical bearings of the impeller shafts and the limited accuracy of most commercially available torque meters. Consequently, only a few reports about power input measurements in benchtop scale bioreactors have been published17,18,22,24,31,32. There is also a lack of data about the power input in single-use bioreactors, which are delivered by the manufacturers preassembled, sterilized and ready-to-use33,34. In contrast to their reusable counterparts, most single-use bioreactors are agitated by specially designed impellers, making comparisons difficult.
In order to close this gap, a reliable method for power input measurements with special focus on laboratory scale stirrers has been developed recently35. The torque values measured in the empty vessels, which were caused by the friction losses, were effectively reduced by the use of an air bearing. Consequently, a wide range of operational conditions with low to moderate turbulence (100 < Re < 2·104) could be investigated and the power input of several multi-use and single-use bioreactors has been provided.
The present study provides a detailed measurement protocol of the previously developed method and describes how to set up, conduct and evaluate a torque-based power input measurement in laboratory scale bioreactors. Special focus is on commercially available single- and multi-use systems. An automated measurement procedure is used to reduce the experimental effort.
Protocol
Loading...
$$\rightleftharpoonup{xx}$$
$$\longleftharp{xx}$$,
$$\longrightharp{xx}$$,
1. Preparation of sucrose solutions
NOTE: The sucrose solutions are used as cheap, Newtonian model media with elevated viscosity and density for reduced turbulence conditions (see Table 1).
- Fill a Duran glass bottle with water and sucrose of different concentrations (20 - 60 %w/w).
- Mix the content with a magnetic stirrer until the sucrose has completely dissolved.
- For sucrose concentrations in excess of 40 %w/w, add the sucrose intermittently and heat the glass bottle slightly (~ 50 °C). Let the sucrose solution cool down to room temperature before use.
2. Preparation of a measurement recipe and the data logging
- After starting the software, initiate the communication with the control unit by selecting the correct serial COM port from the dropdown menu and clicking the Connect button.
Note: The Connect button will change the colour to green and the LED below the dropdown menu will switch on, once the communication with the control unit is initiated. - Set up the data file path inside the bioreactor control unit software in order to store the data on the operator PC.
- Open the Settings tab page and hit the folder symbol next to the Data file location text field.
- In the file dialog window, browse to the desire folder, type a file name into the File name text field and click the OK button.
Note: The data log file path and name are displayed in the text box and the DAQ start button is enabled, once a valid file path is defined.
- Set up a routine inside the recipe manager of the bioreactor control unit software in order to automate the measurement procedure.
- Open the Recipe tab page and type the desired input values for the recipe phase elapsed time (min) and the corresponding impeller speed (rpm) into the text field boxes. The profile is automatically displayed in the chart.
Note: For example, the agitator speed is increased stepwise by 20 rpm from 100 rpm to 300 rpm, and each value is maintained for 4 minutes in order to guarantee a stable torque signal (see discussion below). The minimum and maximum speeds as well as the amount of the increase can be adjusted for different agitators and vessels.
Note: Select the speed range carefully with respect to the torque sensor resolution, the nominal torque and vortex formation. The latter often occurs in unbaffled bioreactors agitated at higher speeds and can cause damage to the torque meter. - Click the Save button, browse to the desired file path and type a file name in the text field. Hit the OK button to save the file.
- Open the Recipe tab page and type the desired input values for the recipe phase elapsed time (min) and the corresponding impeller speed (rpm) into the text field boxes. The profile is automatically displayed in the chart.
3. Installation of the torque sensor
NOTE: The experimental setup is shown schematically in Figure 1.
- Install the torque transducer in a specially designed holder that incorporates the air bearing (see Figure 1) using screws to fix the sensor into place. The air bearing used in this study has a porous carbon bushing material with an inner diameter of 13 mm.
- Mount the brushless servo agitator motor onto the top of the holder. Fix the torque transducer to the vertical holder mounting using four screws.
- Connect the motor shaft to the drive shaft of the torque transducer using a metal bellow coupling that can compensate small axial misalignments of the shafts and tighten the coupling using screws. Connect the agitator shaft to the measurement shaft of the torque transducer using another metal bellow coupling.
NOTE: In this study, specifically designed impeller shafts with a diameter of 13 mm (tolerance: - 0.0076 mm) and with lengths of between 270 mm and 520 mm were used for the different vessels investigated.
- Mount the sensor holder onto the bioreactor head plate and install the impellers on the agitator shaft with the desired off-bottom clearance. Mount baffles and additional installations (e.g. sampling and harvest tubes, electrochemical sensors, etc.) inside the bioreactor if required.
- Install the desired bioreactor in the vessel holder if required (bioreactors #1, #3 to #10) or place the head plate onto the bioreactor tank (bioreactor #2) and tighten the head plate with screws.
- For investigations of glass bioreactors, place the bioreactor glass vessel into the holder.
- For investigations of single-use bioreactors, disassemble the top mounted tubing ports and impeller shaft housing from the plastic head plates by using appropriate cutting tools. Place the plastic vessel into the holder.
- Place a temperature sensor inside the bioreactor and connect it to the control unit. Connect the tubing for the pressurized air to the gas inlet port of the air bearing and apply a pressure of around 5.5 bar provided by a compressor. Connect the torque transducer to the A/D converter and power on the transmitter.
4. Configurations in the data acquisition software
- Open the software for the data acquisition of torque sensor signal and configure the measurement preferences.
- Make sure that the first two channels in the DAQ channels window are initialized and active. In this study, the torque signal was set on channel 0 and the rotational speed signal was set on channel 1.
- Click the Live update button to display the current measurement values.
- Set the torque channel signal to zero if the absolute torque signal without rotation is larger than 0.1 mN·m by using the right-mouse click on the channel item in the channel list and selecting the Zero balance option.
- Navigate to the DAQ job tab page and define a data acquisition rate of 2 Hz from the dropdown menu list. Use the options Immediately at job start and Duration from the dropdown lists to set the Start and Stop of the data acquisition, respectively.
- Define a time span for the Sample duration that is longer than the time required to finish the measurement (for example, use 1 h 0 m 30 s for a one hour recipe defined in the second step).
- Navigate to the Data storage settings page and select the option ASCII + channel info from the dropdown list to set the File format for the data save file. Set a file path on the PC hard drive for the measurement Output file.
- Make sure that the first two channels in the DAQ channels window are initialized and active. In this study, the torque signal was set on channel 0 and the rotational speed signal was set on channel 1.
5. Perform the torque measurement
- Start the data acquisition for the torque signal in the control and data acquisition software for the torque meter by clicking the Start button on the DAQ job menu page.
- Start the data acquisition for the agitator speed and the temperature in the bioreactor control unit software by clicking the DAQ start button on the Settings tab page.
- Start the agitator control in the control unit software with a manual set-point or the pre-defined recipe scheme.
- If a single measurement is conducted, use the control box entry on the Main tab page of the bioreactor control software. Type the desired set-point into the text box and click on the ‘Agitator control on’ item.
- If multiple measurements with a recipe are conducted, navigate to the Phases tab page and click the Start button.
Note: The software will automatically disable all manual entry boxes for the duration of the recipe and a window opens automatically to confirm the end of the process.
- In the data acquisition software, a window opens automatically after the pre-defined measurement duration. Save the data for each measurement on the operator PC, preferably on the hard drive, by clicking the Save data now button.
- Repeat the measurement for each desired agitator speed without and with liquid inside the bioreactor vessel.
- Pour water (or the sucrose solution) through a funnel into the bioreactor.
Note: Make sure that the liquid completely covers the impellers since (partially) exposed impellers can result in undesired axial forces that could damage the torque sensor.
- Pour water (or the sucrose solution) through a funnel into the bioreactor.
6. Data evaluation
NOTE: The obtained torque values in the empty vessel (dead torque) correspond to the residual friction losses of the bearing and must be subtracted from the values determined in the liquid in order to obtain the effective torque values (see Eq. 1).
- Average the torque values for each agitator speed measured after a quasi-stable signal has been achieved (see discussion below). Ideally, calculate the mean value over a period of at least 2 min for each condition, corresponding to 240 data points at a measurement rate of 2 Hz.
- Use a Matlab code for the data processing by running the code from the software command line.
NOTE: The code is provided for download in the supplement section of this manuscript. This script imports the raw data file from the data recording, calculates the phase average rotational speed, Reynolds number (from Eq. 3 based on user inputs) and torque values for each of the phases, visualizes the outcomes, and stores the results in a second text file, which then can be used to further process the data. - Subtract the torque values obtained in the empty vessel from those measured in the liquid to obtain the effective torque values.
- Calculate the power input and dimensionless power number from the time-averaged torque values according to Eq. 1 and Eq. 2.
Results
Loading...
$$\rightleftharpoonup{xx}$$
$$\longleftharp{xx}$$,
$$\longrightharp{xx}$$,
The power inputs in different multi-use and single-use bioreactors with working volumes between 1 L and 10 L were determined. The geometrical details are summarized in Table 2. In case of the single-use vessels, the top mounted tubing ports and impeller shaft housings had to be removed from the head plates in order to fit the vessels into the vessel holder. Furthermore, the built-in plastic shafts were attached to the stainless-steel shaft that was used in conjunction with the air bearing, but no further modifications were required.
The torque was measured for impeller speeds between 100 rpm and 300 rpm in the unbaffled vessels and between 100 rpm and 700 rpm in the baffled vessels, corresponding to maximum tip speeds of 1.13 m·s-1 and 1.54 m·s-1 (see Eq. 4) respectively.
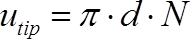 (4)
(4)
The defined agitator speeds at the lower end were restricted by the torque sensor measurement accuracy and relative standard deviation of reproducibility of ± 0.2 % and < 0.05 % of the nominal torque respectively (specified by the manufacturer36). Furthermore, the maximum agitator speeds were defined by the nominal torque (0.2 Nm), in particular for the 10 L tank investigated, and vortex formation in the unbaffled vessels. In order to prevent the sensor from being damaged, the maximum torque during measurement was defined at 60 % of the nominal torque (0.12 Nm) and the vortex depth was limited to approximately 20 mm based on visual inspection.
Using the stepwise increase in the rotational agitator speeds, a typical torque profile is shown in Figure 2. The torque signal increased with every step increase in the rotational speed, as expected from Eq. 1. Peak values in the torque signal were observed after each adjustment of the impeller speed, which can be explained by the initial acceleration of the liquid and the PID control of the agitator speed. Quasi stable measurements were obtained after approximately 1 min, depending on the rotational speed and impeller used. The residual fluctuations around the time averaged torque value of the individual phase were usually around 5 % of the mean value for most of the impellers and agitation speeds investigated.
For further evaluation, the phase averaged torque values were used, whereas the peak torque after each speed adjustment was ignored. Based on the measurement frequency of 2 Hz, the measured torques (TL) represented the mean of a least 240 data points, which provided a sufficiently high statistical certainty, and the relative standard deviations of these mean values were lower than 3 % for the majority of measurement points, which indicates stable measurement signals. Interestingly, the standard deviations typically decreased with increasing agitation speeds, which indicates that the relative importance of the aforementioned fluctuations decrease with higher agitation.
As it has been shown earlier35, the dead torque, i.e. the torque measured without liquid inside the vessel, which can be a result of friction losses in the bearing, seals and the motor drive or small bends in or imbalances of the impeller shaft (particularly in the single-use plastic shafts), can be substantially reduced by the use of the air bearing. In general, the dead torque values of the stainless steel agitators were smaller than for those made of the plastic. This can be explained by the higher level of stiffness of the steel shafts, which results in lower oscillation during the rotation. For most of the agitators used, the residual dead torques with the air bearing were as low as 0.5 mN·m and, consequently, below, or close to the sensor resolution of the torque meter applied (0.4 mN·m). The highest residual dead torque was observed in the bioreactor #6, which uses an impeller shaft retainer on the vessel bottom. During rotation, the impeller shaft collided with that retainer, which can also be observed during cultivation experiments, resulting in additional friction.
As can be seen from Figure 3, after calculating the power inputs from the effective torques (based on Eq. 1) and plotting them as a function of the Reynolds numbers (Eq. 3), individual profiles were obtained for each of the model media tested. In each of these curves, the power input increased as the Reynolds number increased and the slopes were close to the relationship PL  Re3. This correlation can be obtained from Eq. 2 and Eq. 3 when assuming a constant power number and impeller diameter. This was found for all agitators tested with R2 > 0.99.
From the obtained experimental torque data, the power characteristics of all agitators investigated were finally calculated based on Eq. 2 (see Figure 4, Figure 5, Figure 6). The standard Rushton turbine was used as a reference with well documented power numbers in the literature1,16,17,18,19,20,21,22,23,24,25. As can be seen from Figure 4a, the power number in the smaller 2 L vessel (bioreactor #1) decreased at low Reynolds numbers (100 < Re < ≈500) from P0 = 6.3 to P0 ≈ 3.3 before it increased again above Re ≈ 2000. An almost constant power number of P0 = 4.17±0.14 was obtained under fully turbulent conditions (Re > 104). A comparable value of P0 = 4.34±0.22 was determined for the larger vessel with 10 L working volume (bioreactor #2), whereas some deviations between the two scales were found for the transitional range with 600 < Re < 104 (see Figure 4a). Nevertheless, the qualitative trends in both scales agreed fully with literature data1,19, where the power input of a single Rushton turbine in 20 L1 and 40 L19 working volumes has been determined, respectively. It should be noted that the power numbers for the turbulent range are up to 25 % lower than those provided by reference data of P0 ≈ 4.719 and P0 ≈ 5.51. However, direct comparison is often difficult because of the different measurement techniques used as well as deviations in the geometrical parameters, including the diameter ratio (d/D), the off-bottom clearance (zM/D) and the tank bottom and baffle geometry. Other researchers found power numbers for Rushton turbines in baffled vessels in a range of 3.6 to 5.9, depending on the stirrer and vessel geometry used17,18,21,24,27,29,37,38. Thus, it can be argued that the current results were satisfying.
In Figure 4b, the power numbers of the bioreactors #3 and #4, with 1 L and 2 L working volumes respectively, are compared for a wide range of Reynolds numbers. The P0 values of the two geometrically similar agitators decreased continuously in the transition range and became constant (bioreactor #3: P0 = 3.67±0.06; bioreactor #4: P0 = 4.46±0.05) at fully developed turbulence with Re > 104, a criterion that has previously been found for the Rushton turbine and other agitators38. Interestingly, an almost constant offset between the two scales was observed, which can be explained by differences in the vessel and impeller geometries. Even though the impeller configuration in the two vessels is similar, it was not possible to keep all geometrical parameters constant. For example, the 1 L vessel is equipped with only two built-in baffles, whereas the 2 L vessel was equipped with three baffles. It is well known that the power number increases as the number of baffles increases, until a critical reinforcement condition is achieved38. Furthermore, the shape of the impeller disc in the smaller vessel had to be modified for manufacturability, which could have an influence on the power input. It should be also noted that the measured torque values in the smaller vessel were only between 4.2 mN·m and 12.8 mN·m, which corresponds only up to 6 % of the nominal torque of the torque meter used. In this range, small deviations in the measurement signal can have a significant impact on the results. Since no comparison data from reference measurements are available, it is difficult to draw final conclusions on the measurement reliability at the smallest scale used in this study and further investigations are necessary.
Figure 5 shows the power characteristics of the three commercially available single-use bioreactors investigated. In contrast to the baffled vessels, the power numbers of the single-use agitators decreased continuously over the complete range of Reynolds numbers investigated (100 < Re < 3·104), and no constant values were obtained due to the progressive vortex formation at high agitation rates in the unbaffled vessels. The highest power numbers of between P0 ≈ 6 and P0 ≈ 1.8 were obtained for the bioreactor #5, which is agitated by a radially pumping blade impeller and an axially pumping segment blade impeller with 45° pitched blades.
As expected, lower power numbers of between P0 ≈ 5.1 and P0 ≈ 1.1 were obtained for the bioreactor #7, which is agitated by two segment blade impellers with 30° pitched blades resulting in a primarily axial flow. It is well known that axial flow impellers have smaller power numbers than radial flow blade impellers due to the lower flow resistances of the pitched blades38. It should be noted that the experimental data on the power input in the bioreactor #7 that have been previously reported32 are somewhat higher ( e.g. P0 = 1.9 for Re = 1.4·104). However, the previously published data showed the same relationship of P0 Re-0.336 as found in the present study. The different measurement techniques can be responsible for the different absolute values.
Among the investigated single-use bioreactors, the bioreactor #6, which is mixed by one bottom-near marine impeller, had the lowest power numbers in the range of P0 ≈ 0.8 and P0 ≈ 0.3 (see Figure 5). This low power input can be explained by the low impeller pitch, even though computational fluid dynamics (CFD) analysis showed a rather dominant radial flow component around the impeller blades39. Good agreement of the current results and published data from CFD models39 and experiments32 can be stated.
Finally, the measurement setup was used to investigate the influence of the impeller diameter and blade angle in the bioreactor #7. As can be seen from Figure 6, all power curves decrease continuously over the complete range of Reynolds numbers, as expected. Significant differences were obtained between the two blade angles (30° and 45°), where the larger blade angle had higher power inputs (with 30°: 1.13 < P0 < 4.25 and 45°: 1.65 < P0 < 4.46) irrespective of the turbulence (i.e. Reynolds number). This is also known for classical pitched blade impellers40 and can again be explained by the higher flow resistance around the blades with stronger pitch. Interestingly, no significant differences in the power numbers between the two impeller diameters were detected. This has also been found for pitched blade impellers, whereas the power numbers of radial flow blade impellers typically tend to decrease as the d/D ratio increases40.
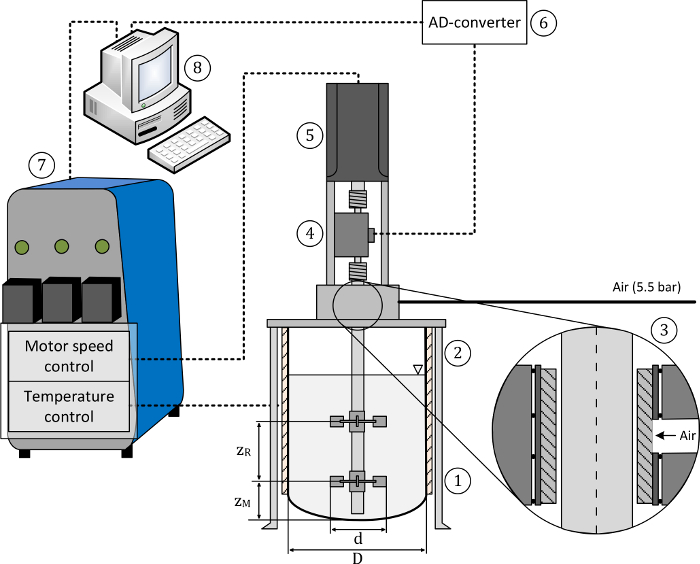
Figure 1: Schematic of the test setup. The setup consists of the (1) mixing tank, (2) vessel holder, (3) bearing cage with air bushing, (4) torque meter, (5) motor drive, (6) A/D converter, (7) control unit, (8) PC for data acquisition and control. Pressurized air (5.5 bar) was supplied for the air bushing, as recommended by the manufacturer. The main geometric dimensions of the mixing tank and the agitator are also indicated. This figure has been modified from35. Please click here to view a larger version of this figure.
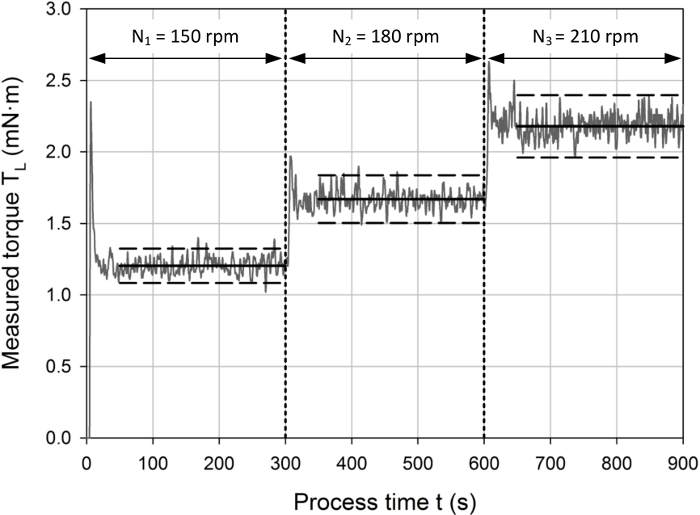
Figure 2: Typical measurement profile with a stepwise increase in the agitator rotational speed (i.e. N1 < N2 < N3) in 5 min intervals, as indicated by the vertical dashed lines. The horizontal dashed lines represent a 5 % confidence interval around the time-averaged torque values for the corresponding phases (indicated by the horizontal solid lines). Peak values were observed during the first minute of each interval, which can be explained by the initial acceleration of the liquid inside the tanks and the PID based agitator speed control. For further evaluation, only the torque signal during the quasi stable phase was used, where the measurement signal fluctuated around the mean averaged value within the 5 % confidence interval. Please click here to view a larger version of this figure.
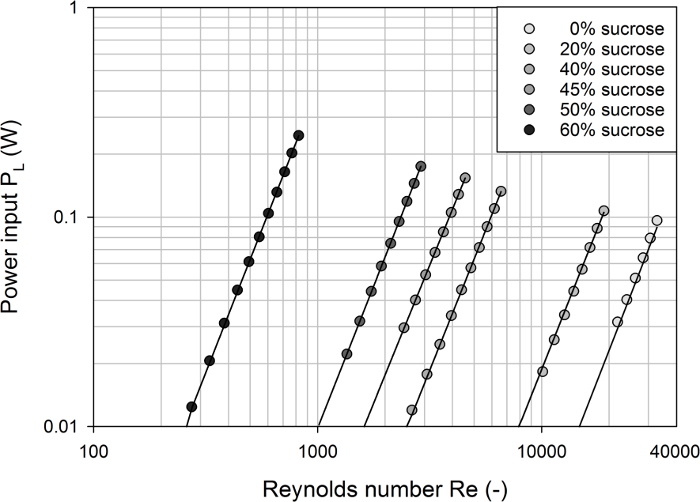
Figure 3: Calculated power input in the bioreactor #1 as a function of the Reynolds number for different model media. Individual profiles were obtained for each of the model media tested. The solid lines represent model predictions assuming P Re3 and very good agreement with the experimental data was found (with R2 > 0.99). Please click here to view a larger version of this figure.

Figure 4: Determined power numbers as a function of the Reynolds number in baffled tanks. (a) The comparison of data from Rushton turbines in the small and large tanks (with 2 L and 10 L working volume respectively) shows that the dimensionless power numbers for fully turbulent conditions are equal between the two scales. Small deviations were found for the transitional range with Re < 104, where the power number increased as the Reynolds number increased. (b) The comparison of data from the bioreactors #3 and #4 shows a qualitatively similar decrease of the power numbers as the Reynolds number increased until stable values are obtained under fully turbulent conditions. The power numbers for the 1 L bioreactor show higher fluctuations compared to the 2 L counterpart. No data for the 1 L vessel were obtained for Reynolds numbers in the range 550 < Re < 950 when using the same model media as in the 2 L vessel. The quantitative offset between the scales can be explained by differences in the vessel and agitator geometries or could be a result of the sensor sensitivity. Further investigations are required. The solid lines represent polynomial regression models. Please click here to view a larger version of this figure.
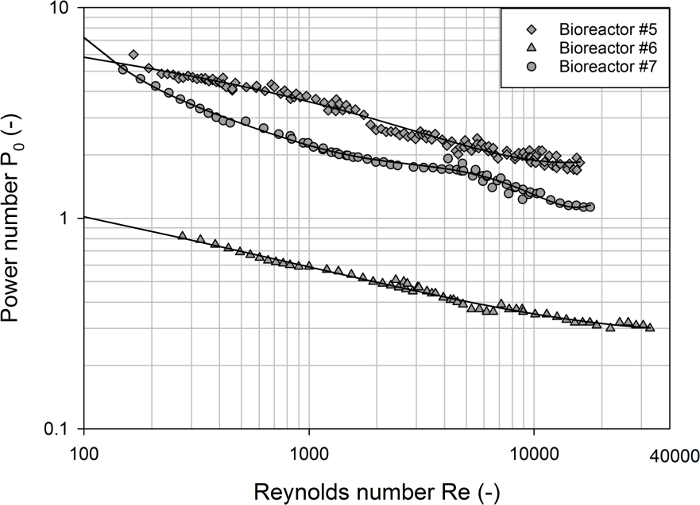
Figure 5: Determined power numbers as a function of the Reynolds number for different single-use bioreactors. The power numbers for each of the vessels decreased as the Reynolds numbers increased. In contrast to the baffled vessels, no stable power numbers were obtained due to the progressive vortex formation at high agitation rates in the unbaffled vessels. The solid lines represent polynomial regression models. Please click here to view a larger version of this figure.

Figure 6: Determined power numbers as a function of the Reynolds number for different modifications of the bioreactor #7. Distinct profiles were obtained for the two different blade angles of 30° and 45°, but no significant differences between the two impeller diameter ratios (d/D = 0.43 and d/D = 0.57) were found. The power numbers of all configurations showed a continuous decrease over the complete range of Reynolds numbers investigated due to the progressive vortex formation at high agitation rates in the unbaffled vessels. The solid lines represent polynomial regression models. Please click here to view a larger version of this figure.
| Final sucrose concentration | Liquid density ρL | Liquid viscosity ηL | Reynolds number Re |
| (%w/w) | (kg·m-3) | (mPa·s) | (-) |
| 0 | 998.2 | 1 | 11954 |
| 20 | 1081 | 2 | 6486 |
| 30 | 1127 | 3.2 | 4226 |
| 40 | 1176.4 | 6.2 | 2277 |
| 50 | 1231.7 | 15.5 | 954 |
| 55 | 1259.8 | 28.3 | 534 |
| 60 | 1288.7 | 58.9 | 263 |
Table 1: Summary of liquid densities and viscosities for selected sucrose solutions at 20 °C and resulting dimensionless Reynolds number for an impeller with diameter and rotational speed of 60 mm and 200 rpm, respectively. The Reynolds number is calculated using Eq. 3.
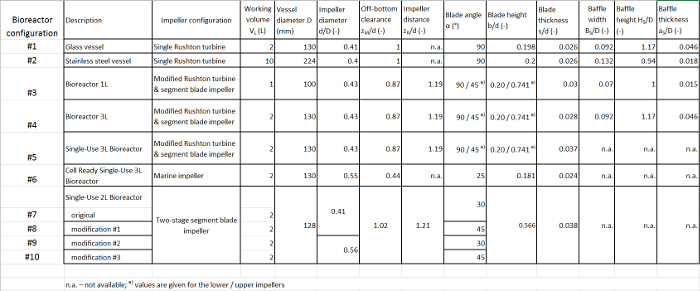
Table 2: Summary of the geometrical details of the bioreactors investigated. Please click here to download this file.
Discussion
Loading...
$$\rightleftharpoonup{xx}$$
$$\longleftharp{xx}$$,
$$\longrightharp{xx}$$,
Despite the importance of the (specific) power input for the engineering characterization and scaling-up/down of bioreactors, only a few publications on experimental investigations in benchtop scale bioreactors, particularly single-use systems in the one-digit liter volume range, can be found in the literature. One reason for this lack of data can be seen in the difficulties of accurate power input measurements in such small scales. In order to overcome some of these difficulties, the present study provides a detailed protocol for torque based power input measurements that are supported by an air bearing to minimize the friction losses in the bearing. The applicability of the method was demonstrated using three commercially available single-use bioreactors as well as multi-use bioreactors in scales between 1 L and 10 L working volume.
Based on our experience with the torque based measurements, the most critical factors to address are: 1) reducing the dead torque by minimizing the friction losses inside the bearings and seals, in particular in laboratory scale bioreactors, and 2) the selection of a suitable torque meter for the desired bioreactor size and agitation conditions. As has been shown earlier35, the dead torque can be dramatically reduced by the use of an air bearing. In the present study, a low cost air bushing made of porous carbon material was used. The residual torque in the empty vessels tested were typically below 0.5 mN·m with agitation rates of up to 900 rpm, corresponding to impeller tip speeds of up to 3 m·s-1. In contrast, the dead torque of the bioreactor #6 with the built-in mechanical shaft bearing was, for example, between 9.4 mN·m and 20 mN·m, and comparable values of around 3 mN·m have been also reported for the bioreactor #732. This is about one order of magnitude higher than the values obtained in the proposed experimental setup.
Besides the air bearing, the torque meter used is the most critical component. A commercially available torque meter that is designed for measuring static and dynamic torque, rotation speed and angle of rotation was selected for this study. Considering the bioreactors of interest with maximum working volumes of 10 L and the corresponding agitators, a nominal torque of 0.2 N·m was chosen. It was found that high reproducibility with relative standard deviation of replicates < 5% and reliable measurements can be obtained for effective torques as low as 2 mN·m, corresponding to only 1 % of the nominal torque. Hence, the measurement range of the sensor applied in the present study was significantly wider than results which have been published based on an inter-laboratory study of members of the German GVC-VDI working group on mixing41.
Nevertheless, the range of the agitator speed should be carefully selected with respect to the torque sensor resolution, the nominal torque and vortex formation. The latter often occurs in unbaffled bioreactors agitated at higher speeds and can cause damage to the torque meter. Both the minimum and maximum feasible agitator speeds can be limiting factors of the method described in this study. In addition to our previous work35, this study involved also the bioreactor #3, the smallest member in glass bioreactor family provided by the manufacturer, which is agitated by two-stage impellers with diameters of 42 mm. A comparable power characteristic to that in the geometrically similar bioreactor #4 was obtained with the presented experimental setup. This is notable since the torque scales with M d5 for a given liquid density, impeller geometry (i.e. power number) and rotational speed (see Eq. 1 and Eq. 2). Consequently, an approximately 40% lower impeller torque results from a 10% smaller impeller diameter, for example. Nevertheless, higher rotational speeds in the 1 L scale than in the 2 L scale were required during operation to resolve the produced torque with the available torque meter. Due to the built-in baffles of the bioreactor #3, no vortex formation was observed, but this can become an issue with unbaffled vessels. It should be emphasized that the constant offset in the power numbers that was found between the two scales could result from measurement inaccuracies caused by the limited sensor resolution (in addition to geometrical differences). Further investigations are required to draw final conclusions on the minimum scale at which the proposed setup is still feasible.
Nevertheless, the same protocol was used for power input measurements in various glass vessels from different manufacturers with working volumes of between 1 L and 10 L in our laboratory. This highlights the transferability of the used method for the characterization of different bioreactor systems. The experimental effort could be reduced by automated measurements using the recipe management within the automation system provided by the control unit software and the automated data processing based on the universal Matlab language.
Further, it should be noted that, by using the sucrose containing, cheap Newtonian model media, a wide range of Reynolds numbers (100 < Re < 6·104), depending on the agitator and scale, was covered. It should be also emphasized that the lower limit of the turbulence range is usually irrelevant for animal cell cultures with water-like media, even if very low impeller speeds are used. However, significant increases in the broth viscosity, which results in turbulence damping, and even non-Newtonian behavior have been described for fungi- and plant cell-based cultures. For example, apparent viscosities in plant cultures of up to 400-fold compared to water have been reported42, which leads to much lower Reynolds numbers.
Finally, using the bioreactor #7 as a first case study, it has been demonstrated that the proposed experimental setup can be used to study the effect of design modifications on the power input at laboratory scale. In combination with rapid prototyping techniques, this can be a powerful tool for impeller design studies, which will form parts of future work.
Disclosures
Loading...
$$\rightleftharpoonup{xx}$$
$$\longleftharp{xx}$$,
$$\longrightharp{xx}$$,
The authors have declared no conflicts of interest.
Acknowledgements
Loading...
$$\rightleftharpoonup{xx}$$
$$\longleftharp{xx}$$,
$$\longrightharp{xx}$$,
The authors would like to thank Dieter Häussler and Beat Gautschi for their assistance during the experimental set up. We are also grateful to Caroline Hyde for English proof reading.
Materials
| Name | Company | Catalog Number | Comments |
|---|---|---|---|
| T20WN torque meter | HBM Hottinger Baldwin Messtechnik GmbH | Nominal torque 0.2 Nm | |
| Spider-8 | HBM Hottinger Baldwin Messtechnik GmbH | HBM Spider8 is no longer available for sale. QuantumX DAQ system (especially the QuantumX modules MX840A and MX440A) are recommended. | |
| Catman easy software | HBM Hottinger Baldwin Messtechnik GmbH | Version 4.2.2 | |
| Air bearing | IBS precision engineering | 13 mm air bushing | |
| Stainless steel impeller shaft | Bioengineering AG | Shaft tolerance -0.0076 mm | |
| Brushless motor AKM2 | Kollmorgen | ||
| Metal bellow coupling | Uiker AG | ||
| Finesse RDPDmini control unit | Finesse, a part of Thermo Fisher Scientific | No longer supported (the replacement product G3Lab universal controller can be used) | |
| Sucrose | Migros Schweiz AG | Food grade | |
| Matlab software | Mathworks | Version R2017a | |
| Finesse μTruBio PC software | Finesse, a part of Thermo Fisher Scientific | Version 3.1 (no longer supported) | |
| SmartGlass 1L | Finesse, a part of Thermo Fisher Scientific | referred to as Bioreactor 1L in Table 2 | |
| SmartGlass 3L | Finesse, a part of Thermo Fisher Scientific | referred to as Bioreactor 3L in Table 2 | |
| SmartVessel 3L | Finesse, a part of Thermo Fisher Scientific | referred to as Single-Use 3L Bioreactor in Table 2 | |
| Mobius CellReady 3L | Merck Millipore | referred to as Cell Ready Single-Use 3L Bioreactor in Table 2 | |
| UniVessel SU 2L | Sartorius Stedim Biotech | referred to as Single-Use 2L Bioreactor in Table 2 |
References
Loading...
$$\rightleftharpoonup{xx}$$
$$\longleftharp{xx}$$,
$$\longrightharp{xx}$$,
- Shiue, S. J., Wong, C. W. Studies on homogenization efficiency of various agitators in liquid blending. Can. J. Chem. Eng. 62, 602-609 (1984).
- Zlokarnik, M. Rührtechnik -- Theorie und Praxis. , Springer-Verlag. Berlin, Heidelberg, New York. (1999).
- Ghotli, A. R., Raman, A. A. A., Ibrahim, S., Baroutian, S. Liquid-liquid mixing in stirred vessels: a review. Chem. Eng. Commun. 200, 595-627 (2013).
- Arjunwadkar, S. J., Sarvanan, K., Kulkarni, P. R., Pandit, A. B. Gas-liquid mass transfer in dual impeller bioreactor. Biochem. Eng. J. 1, 99-106 (1999).
- Hari-Prajitno, D., Mishra, V. P., Takenaka, K., Bujalski, W., Nienow, A. W., McKemmie, J. Gas-liquid mixing studies with multiple up- and down-pumping hydrofoil impellers: power characteristics and mixing time. Can. J. Chemical Eng. 76, 1056-1068 (1998).
- Wichterle, K. Heat transfer in agitated vessels. Chem. Eng. Sci. 49, 1480-1483 (1994).
- Angst, R., Kraume, M. Experimental investigations of stirred solid/liquid systems in three different scales: particle distribution and power consumption. Chem. Eng. Sci. 61, 2864-2870 (2006).
- Cherry, R., Papoutsakis, E. T. Hydrodynamic effects on cells in agitated tissue culture reactors. Bioprocess Eng. 1, 29-41 (1986).
- Chalmers, J. J. Shear sensitivity of insect cells. Cytotechnology. 20, 163-171 (1996).
- Ma, N., Mollet, M., Chalmers, J. J. Aeration, mixing and hydrodynamics in bioreactors. Cell Culture Technology for Pharmaceutical and Cell-Based Therapies. Ozturk, S. S., Hu, W. -S. , Taylor & Francis. New York (NY). 225-248 (2006).
- Chisti, Y. Shear Sensitivity. Encyclopedia of Bioprocess Technology. Flickinger, M. C., Drew, S. W. , John Wiley & Sons. Hoboken, NJ, USA. 1719-1762 (2002).
- Oosterhuis, N. M. G., Kossen, N. W. F. Power input measurements in a production scale bioreactor. Biotechnol. Lett. 3, 645-650 (1981).
- King, R. L., Hiller, R. A., Tatterson, G. B. Power consumption in a mixer. AIChE J. 34, 506-509 (1988).
- Brown, D. E. The measurement of fermenter power input. Ind. Chem. 16, 684-688 (1997).
- Bourne, J. R., Buerli, M., Regenass, W. Heat transfer and power measurements in stirred tanks using heat flow calorimetry. Chem. Eng. Sci. 36, 347-354 (1981).
- Böhme, G., Stenger, M. Consistent scale-up procedure for the power consumption in agitated non-newtonian fluids. Chem. Eng. Technol. 11, 199-205 (1988).
- Reséndiz, R., Martínez, A., Ascanio, G., Galindo, E. A new pneumatic bearing dynamometer for power input measurement in stirred tanks. Chem. Eng. Technol. 14, 105-108 (1991).
- Distelhoff, M. F. W., Laker, J., Marquis, A. J., Nouri, J. M. The application of a strain gauge technique to the measurement of the power characteristics of five impellers. Exp. Fluids. 20, 56-58 (1995).
- Ibrahim, S., Nienow, A. W. Power curves and flow patterns for a range of Impellers in Newtonian fluids: 40 < Re < 5x10^5. Chem. Eng. Res. Des. 73, 485-491 (1995).
- Karcz, J., Major, M. An effect of a baffle length on the power consumption in an agitated vessel. Chem. Eng. Process. Process Intensif. 37, 249-256 (1998).
- Houcine, I., Plasari, E., David, R. Effects of the stirred tank's design on power consumption and mixing time in liquid phase. Chem. Eng. Technol. 23, 605-613 (2000).
- Chen, Z. D., Chen, J. J. J. A study of agitated gas-liquid reactors with concave blade impellers. Gupta, B., Ibrahim, S. , Kluwer Academic Publishers. 43-56 (2000).
- Chapple, D., Kresta, S. M., Wall, A., Afacan, A. The effect of impeller and tank geometry on power number for a pitched blade turbine. Chem. Eng. Res. Des. 80, 364-372 (2002).
- Gill, N. K., Appleton, M., Baganz, F., Lye, G. J. Quantification of power consumption and oxygen transfer characteristics of a stirred miniature bioreactor for predictive fermentation scale-up. Biotechnol. Bioeng. 100, 1144-1155 (2008).
- Cudak, M. Hydrodynamic characteristics of mechanically agitated air - aqueous sucrose solutions. Chem. Process Eng. 35, 97-107 (2014).
- Kuboi, R., Nienow, A. W., Allsford, K. A multipurpose stirred tank facility for flow visualisation and dual impeller power measurement. Chem. Eng. Commun. 22, 29-39 (1983).
- Wu, J., Zhu, Y., Pullum, L. Impeller geometry effect on velocity and solids suspension. Chem. Eng. Res. Des. 79, 989-997 (2001).
- Amanullah, A., Serrano-Carreon, L., Castro, B., Galindo, E., Nienow, A. W. The influence of impeller type in pilot scale xanthan fermentations. Biotechnol. Bioeng. 57, 95-108 (1998).
- Saito, F., Nienow, A. W., Chatwin, S., Moore, I. P. T. Power, gas dispersion and homogenisation Characteristics of SCABA SRGT and Rushton turbine impellers. J. Chem. Eng. Japan. 25, 281-287 (1992).
- Ascanio, G., Castro, B., Galindo, E. Measurement of power consumption in stirred vessels - a review. Chem. Eng. Res. Des. 82, 1282-1290 (2004).
- Vilaça, P. R., Badino, A. C., Facciotti, M. C. R., Schmidell, W. Determination of power consumption and volumetric oxygen transfer coefficient in bioreactors. Bioprocess Eng. 22, 261-265 (2000).
- van Eikenhorst, G., Thomassen, Y. E., van der Pol, L. A., Bakker, W. M. Assessment of mass transfer and mixing in rigid lab-scale disposable bioreactors at low power input levels. Biotechnol. Prog. 30, 1269-1276 (2014).
- Eibl, D., Peuker, T., Eibl, R. Single-use equipment in biopharmaceutical manufacture: A brief introduction. Single-Use Technology in Biopharmaceutical Manufacture. Eibl, R., Eibl, D. , John Wiley & Sons. Hoboken, NJ, USA. 3-11 (2010).
- Eibl, R., Kaiser, S., Lombriser, R., Eibl, D. Disposable bioreactors: the current state-of-the-art and recommended applications in biotechnology. Appl. Microbiol. Biotechnol. 86, 41-49 (2010).
- Kaiser, S. C., Werner, S., Jossen, V., Kraume, M., Eibl, D. Development of a method for reliable power input measurements in conventional and single-use stirred bioreactors at laboratory scale. Eng. Life Sci. 17 (5), 500-511 (2016).
- Hottinger Baldwin Messtechnik GmbH. Drehmoment-Messwelle T20WN product description. , Available from: http://www.hbm.com/en/0264/torq (2016).
- Nienow, A. W., Miles, D. Impeller power numbers in closed vessels. Ind. Eng. Chem. Process Des. Dev. 10, 41-43 (1971).
- Liepe, F., Sperling, R., Jembere, S. Rührwerke - Theoretische Grundlagen, Auslegung und Bewertung. , Eigenverlag FH. Anhalt, Köthen, Germany. (1998).
- Kaiser, S. C., Werner, S., Eibl, D. CFD as tool to characterize single-use bioreactors. Single-Use Technology in Biopharmaceutical Manufacture. Eibl, R., Eibl, D. , John Wiley & Sons. Hoboken, NJ, USA. 264-279 (2010).
- Liepe, F. Verfahrenstechnische Berechnungsmethoden Teil 4: Stoffvereinigen in fluiden Phasen - Ausrüstungen und ihre Berechnung. VEB Deutscher Verlag für Grundstoffindustrie. , Leipzig, Germany. (1988).
- Kraume, M., Zehner, P. Experience with experimental standards for measurements of various parameters in stirred tanks: a comparative test. Chem. Eng. Res. Des. 79, 811-818 (2001).
- Werner, S., Greulich, J., Geipel, K., Steingroewer, J., Bley, T., Eibl, D. Mass propagation of Helianthus annuus suspension cells in orbitally shaken bioreactors: Improved growth rate in single-use bag bioreactors. Eng. Life Sci. 14, 676-684 (2014).
Reprints and Permissions
Request permission to reuse the text or figures of this JoVE article
Request Permission