Most common gut content analyses of macroinvertebrates are visual. Requiring intense knowledge about morphological diversity of prey organisms, they miss soft bodied prey and, due to strong comminution of prey, are nearly impossible for some organisms, including amphipods. We provide detailed, novel genetic approaches for macroinvertebrate prey identification in the diet of amphipods.
A subscription to JoVE is required to view this content. Sign in or start your free trial.
Method Article
Laboratory Protocol for Genetic Gut Content Analyses of Aquatic Macroinvertebrates Using Group-specific rDNA Primers
In This Article
Summary
Abstract
Analyzing food webs is essential for a better understanding of ecosystems. For example, food web interactions can undergo severe changes caused by the invasion of non-indigenous species. However, an exact identification of field predator-prey interactions is difficult in many cases. These analyses are often based on a visual evaluation of gut content or the analysis of stable isotope ratios (δ15N and δ13C). Such methods require comprehensive knowledge about, respectively, morphologic diversity or isotopic signature from individual prey organisms, leading to obstacles in the exact identification of prey organisms. Visual gut content analyses especially underestimate soft bodied prey organisms, because maceration, ingestion and digestion of prey organisms make identification of specific species difficult. Hence, polymerase chain reaction (PCR) based strategies, for example the use of group-specific primer sets, provide a powerful tool for the investigation of food web interactions. Here, we describe detailed protocols to investigate the gut contents of macroinvertebrate consumers from the field using group-specific primer sets for nuclear ribosomal deoxyribonucleic acid (rDNA). DNA can be extracted either from whole specimens (in the case of small taxa) or out of gut contents of specimens collected in the field. Presence and functional efficiency of the DNA templates need to be confirmed directly from the tested individual using universal primer sets targeting the respective subunit of DNA. We also demonstrate that consumed prey can be determined further down to species level via PCR with unmodified group-specific primers combined with subsequent single strand conformation polymorphism (SSCP) analyses using polyacrylamide gels. Furthermore, we show that the use of different fluorescent dyes as labels enables parallel screening for DNA fragments of different prey groups from multiple gut content samples via automated fragment analysis.
Introduction
Predator-prey interactions, which constitute the majority of trophic interactions and food web dynamics, are key aspects to characterize the fluxes of matter and energy throughout food webs within and between ecosystems, which is one of the major goals of ecology1. The determination of the source and flow of carbon and nutrients is furthering the understanding of ecological connectivity between ecosystems2. However, ecosystems, such as rivers and their catchments, are not only linked by fluxes of organic matter and nutrients but also by the movements of organisms3. Thus, habitat alterations interrupting the flow of resources that link those systems can strongly alter the food webs of both ecosystems, not only directly but also indirectly by changing the respective composition of predator-prey communities. For instance, changes of food webs have been shown to be linked to the movements of single predator species (e.g., rainbow trout)4. Such changes potentially threaten biodiversity and the functioning of aquatic ecosystems. Therefore, analyzing predator-prey interactions in the field is essential to determine the impact of human-induced environmental changes, such as water management practices, on the native biodiversity of aquatic ecosystems.
Since tracking trophic linkages is difficult in complex systems, several approaches have been established that enable the assessment of feeding interactions in the field5. Traditionally, investigations of feeding interactions in the field are based on visual identification of prey remains in dissected guts and require an extensive knowledge about morphologic prey diversity. Visual gut content analyses have provided insights in resource use of several groups of consumers (e.g., seasonal variation in diet of lobster6 and fish7,8 or feeding preferences of copepods). However, the physical process of digestion makes visual gut content analyses difficult and usually misses soft bodied prey-organisms9. For species feeding by liquid ingestion or for some invertebrate consumers that intensively comminute their food before ingestion, like amphipods, visual identification of prey species in gut contents is impossible10. Due to these limitations, molecular analysis provides a promising alternative.
Molecular analyses have now become a common tool allowing rapid and precise prey detection in gut contents. The range of such techniques is diverse: strategies based on monoclonal antibodies or polymerase chain reactions (PCR) are often used, because of their high specificity and sensitivity11. The development of new monoclonal antibodies is time- and cost-intensive, therefore, the application of other molecular techniques is more useful when antibodies do not already exist11. Another common approach is the amplification of regions of deoxyribonucleic acid (DNA), like ribosomal ribonucleic acid (RNA) genes present in most species, using universal primer sets12,13. When using this technique, it is often not possible to identify the whole range of prey organisms within mixed sources of DNA14. An effective approach to avoid such a drawback is to use group-specific primer sets for genetic gut content analyses. Designed to amplify only DNA regions of particular target groups and exclude all other species15,16, group-specific primers enable identification of prey organisms on the taxonomic level of the specified groups without time- and cost-intensive secondary analyses. However, like all gut content analysis, such analyses provide only a snapshot of feeding behavior. Therefore, combining molecular gut content analyses with analyses of time-integrating natural tracers (e.g., stable isotopes) is considered beneficial1,2.
Here, we describe a detailed method for PCR-based investigations of predator-prey interactions using group-specific primer sets for nuclear ribosomal DNA (rDNA) regions to be combined with stable isotope analyses of the same specimen. We describe the detection of the DNA of single prey groups via agarose gel electrophoresis. Additionally, we present an opportunity for further downstream analyses of PCR products of such group-specific primers applicable whenever a higher taxonomic resolution than the primers' specificity is required. Because single stranded DNA (ssDNA) fragments form tertiary conformations that are determined by their primary sequence17, small variations in fragments amplified by such group-specific primers lead to conformational changes. Such changes can be detected by single strand conformation polymorphism (SSCP) analyses with polyacrylamide gels17,18, enabling a more precise identification of prey organisms (down to the species level).
While agarose gel electrophoresis is a common and inexpensive tool to visualize DNA fragments and determine their approximate length19, the resolution depends on the amount of DNA and the staining dye used20. Usually, the visualization is straight forward when working with pure DNA samples, but potentially low amounts of prey DNA in the gut contents of consumers can complicate the scoring of agarose gel electrophoresis results. Still, this detection method is feasible to screen a low number of consumer specimens from the field for one or a few prey groups, but complication in the scoring makes the screening of a high number of samples for multiple prey taxa extremely time intensive and thus impracticable. A more sensitive detection method is the automated analysis of fragments via capillary electrophoresis, which additionally allows the determination of the exact length of fragments21. Several microsatellite based studies have shown that by using different fluorescent dyes as labels, it is possible to detect and determine different fragments of comparable length by automated fragment analysis22,23,24. Therefore, we also present a detailed protocol for parallel detection of DNA from multiple prey groups using PCR with labeled group-specific primer sets and detection via automated fragment analysis with an automated sequencer. Additionally, we present results from a case study demonstrating that the detection of prey DNA via automated fragment analysis is an approach which also enables a relative quantification of ingested prey.
Access restricted. Please log in or start a trial to view this content.
Protocol
1. Collect Macroinvertebrates from the Field and Prepare the Samples for Genetic Gut Content Analyses.
- Collect macroinvertebrates at each site, sort out individuals of consumer species of interest into single tubes, and directly freeze them in liquid nitrogen or dry ice to prevent gut clearance and degradation of DNA.
NOTE: Avoid storing samples in alcohol, because some macroinvertebrates tend to regurgitate before the alcohol kills them. - Only use the gastro-intestinal tract of mid-sized and big (approximately >3 mm) macroinvertebrate species for genetic gut content analyses so the remaining matter of the specimen can be used for other procedures (e.g., stable isotope analysis). Note that this is not applicable when investigating very small taxa like water mites. Therefore, steps 1.2.1 and 1.2.2 can be skipped.
- Slightly defrost an individual and carefully dissect its gastro-intestinal tract under a stereomicroscope using fine stainless steel forceps. Make sure not to puncture the gastro-intestinal tract to avoid loss of matter.
- Clean forceps using decontamination solution to remove DNA and RNA contaminations after the preparation of each gastro-intestinal tract. Therefore, incubate forceps for 10 min in the decontamination solution. Afterwards, rinse them with sterile water to remove residual traces and wipe them with a lint-free paper towel.
- Transfer the dissected gastrointestinal tract to a 2.0 mL safe-lock reaction tube containing 440 µL (450 µL possible for use of repetitive pipette) salt extraction buffer [SEB; 0.4 M sodium chloride (NaCl), 10 mM Tris(hydroxymethyl)-aminomethane hydrochloride (Tris-HCl) pH 8.0, and 2 mM ethylenediaminetetraacetic acid disodium salt dehydrate (EDTA) pH 8.0]. Store prepared samples at −20 °C immediately until the extraction of DNA. Ensure that DNA will be extracted within a couple of days.
- Use a modified high-salt extraction protocol25 to extract DNA.
- Take samples out of the freezer. Use forceps to add one 5 mm stainless steel bead to each sample tube, and leave frozen samples on the bench at room temperature (RT) to thaw. Use a bead mill to homogenize samples for 1 min at 15 Hz.
- Spin down samples with a short run of a centrifuge. Use microliter pipettes to add 90 µL (100 µL possible for use of repetitive pipette) 10% sodium dodecyl sulfate solution (SDS) and 5 µL of 10 mg/mL proteinase K.
- Vortex samples thoroughly and incubate mixtures for 1 h at 60 °C with constant shaking at 400 rpm on a thermomixer. Additionally, thoroughly vortex samples every 10 min to further promote lysis.
- Spin down samples with a short run of a centrifuge, add 350 µL of 5 M NaCl with a microliter pipette and vortex thoroughly for approximately 0.5 - 1 min. Centrifuge samples for 40 min at 16,200 x g at 5 °C.
NOTE: If multiple sets in a row have to be done, the temperature setting of the centrifuge needs to be slightly raised (not higher than 10 °C) because SDS tends to flocculate if the temperature is too low. - Use microliter pipettes to transfer approximately 600 µL supernatant into a new 1.5 mL reaction tube. Be careful not to remove anything from the pellet.
- Tip stainless steel beads out of the reaction tubes into a stainless steel tea strainer, clean them with running water and incubate them in a Petri dish with the decontamination solution for 10 min. Thoroughly rinse off the decontamination solution with sterile water and store cleaned beads in ethanol (>99%, p.a. grade) or dry until reuse.
NOTE: Cleaning of beads does not need to be done in this step directly, but rather can be done whenever there is waiting time in the following steps. - Add 600 µL of ice-cold isopropanol (p.a. grade) to the supernatant with a microliter pipette and carefully invert the tube a couple of times. Store samples overnight at -20 °C.
- Take samples out of the freezer and centrifuge them for 20 min at 16,200 × g and room temperature. Carefully discard the supernatant and dry the tube carefully with lint-free tissue paper. Note that if the surrounding temperature is high (more than 25 °C), centrifuge at 5 °C to avoid the pellets slipping while discarding the supernatant.
- Wash pellets containing DNA with 70% ethanol. To do this, add 200 µL of ice-cold ethanol (70%, p.a. grade) using a microliter pipette and centrifuge samples for 10 min at 16,200 x g and room temperature (or 5 °C, if needed). Carefully discard the supernatant and dry the tube carefully with lint-free tissue paper. Use a 10 µL pipette adjusted to approximately 8 µL to carefully pipette off the remaining supernatant. Make sure not to disturb the pellet.
- Dry the pellet for approximately 5-20 min at 60 °C or at room temperature at the bench until all the ethanol is evaporated.
- Dissolve pellet in 50-100 µL nuclease-free (steam sterilized and DEPC treated) water (ddH2O), wait for at least 1 h (though better results will be obtained overnight at 4 °C).
- Measure the amount of DNA contained in each sample with a micro-volume spectrophotometer, according to the manufacturer's instructions. Make a working dilution of each sample containing approximately 2-10 ng DNA/µL. Keep the stock solution in the freezer. Keep the working solution in the fridge and ensure that further sample processing is done shortly.
2. Verify Functional Efficiency of DNA-extracts for Subsequent Detection of Recently Ingested Prey.
- To ensure the presence and functional efficiency of templates, test each DNA extract (steps 1.1 to 1.3.11) using universal primer sets suitable for the respective food source (e.g., invertebrates16,26) that are targeting the same nuclear subunit as the group-specific primer, used for subsequent detection of prey25,27. The following steps refer to the use of universal primer sets NSF1419/20 and NSR1642/1616 and LSU D1,D2 fw1 and LSU D1,D2 rev2 or LSU D1,D2 rev426. To prove that the PCR reaction has been successful and that no contamination did occur, use a positive control containing DNA that had already been amplified successfully and one control sample containing ddH2O instead of DNA within each PCR run.
- To prepare primer working solutions that contain a final concentration 10 µM of the primer, pipette the appropriate amount of the respective primer stock solution and ddH2O (depending on the concentration of the stock solution) into a fresh 1.5 mL reaction tube using micropipettes.
- Add primers, deoxynucleotide mix (dNTPs), reaction buffer, Taq DNA polymerase and ddH2O in a 1.5 or 2.0 mL (depending on the number of samples to be processed) reaction tube, then vortex this mixture. Detailed volumes for the standard reaction mixture for a 10 µL PCR reaction are given in Table 1 (for details of chemicals used, see Table of Materials).
- Use microliter pipettes to transfer each 1 µL of DNA extract into 9 µL of the standard reaction mixture within a PCR tube (or a well of a PCR plate). Close the reaction tube or the reaction wells of the plate (with cap stripes).
- Program the thermocycler: The standard protocol for the NSF1419/20 and NSR1642/1616 primer set is: 94 °C for 4 min (denaturation), followed by 30 cycles of 94 °C for 30 s, 50 °C (annealing temperature) for 30 s, 72 °C for 90 s, and final extension at 72 °C for 10 min. For the LSU primer sets26, use the following: 94 °C for 4 min, followed by 45 cycles of 94 °C for 20 s, 52.5 °C for 20 s, 72 °C for 90 s, and a final extension at 72 °C for 8 min.
- Place PCR tubes or plates into the thermocycler, close the lid of the cycler, and start the respective program.
- Prepare a 1.5% agarose gel using a buffer solution containing Tris base, boric acid and EDTA (TBE buffer), and agarose. For preparation of a 1.5% agarose gel, using a gel casting tray with overall dimensions of 10 cm × 7.5 cm × 3 cm, weigh 0.45 g agarose into a conical flask, use a measuring cylinder to gauge 30 mL of 1x TBE buffer (89 mM Tris, pH 7.6, 89 mM boric acid and 2 mM EDTA, pH 8.0) and pour it into the conical flask. Heat the mixture using a microwave. Stop the microwave whenever there are large air bubbles and carefully swirl the flask until the solution has only one phase.
- To cool down solution to approximately 60 °C, swirl the flask in a water bath. Swiftly pour the solution into a gel casting tray, remove air bubbles, and insert combs. Wait approximately 20 min until gel is hardened.
- Fill electrophoresis unit with 0.5x TBE and insert gel casting tray containing the agarose gel. Make sure that the gel slots are free of air bubbles.
- Spin down the PCR products using the short run option of a mini (plate) centrifuge. Use a microliter pipette to mix each 3 µL of PCR product with 1 µL of 6x loading dye (40% sucrose and 0.25% bromophenol blue) and load it into the gel slots of the agarose gel. Pipette 1.5 µL of a 100 bp DNA ladder into one slot of each line with a microliter pipette as size standard. Replace the lid of the electrophoresis unit correctly and connect leads to a power supply. Run the gel at 100 V/cm for 35 min.
- To prepare a staining bath, pour 1,000 mL of 1x TBE into a square-shaped plastic box impermeable to light. Add 50 µL of ethidium bromide with a microliter pipette, close the lid of the plastic box and shake it to ensure equal distribution of the ethidium bromide.
- Remove the gel from the electrophoresis unit and place it into the staining bath for approximately 10 min. Then, take the gel out of the staining bath and place it onto a gel documentation system and visualize it according to the manual.
- Analyze only samples that showed positive results (fragments of adequate size visual in agarose gel) in terms of presence and functional efficiency of templates for subsequent detection of recently ingested prey.
| PCR-Mix | Concentration working solution | Mix for 10 µl PCR reaction | Final concentration in PCR |
| Primer FW | 10 µM | 0.5 μl | 0.5 µM |
| Primer RW | 10 µM | 0.5 μl | 0.5 µM |
| Reaction buffer (20 mM Tris-HCl, pH 8.55, 16 mM (NH4)2SO4 and 2 mM MgCl2 final concentrations) | 1 µM | 1 μl | 1 µM |
| dNTP | 10 mM | 0.25 μl | 0.25 mM |
| Taq polymerase | 5 U | 0.1 μl | 0.05 U |
| ddH20 | 6.65 μl | ||
| Total amount reaction mixture | 9 μl | ||
| DNA | 1 μl | ||
Table 1: Detailed protocol for the preparation of the standard reaction mixture for a 10 µL PCR reaction.
3. Detect Recently Ingested Prey/Food Items with Group-Specific Primer Sets Using Gel Electrophoresis.
- Conduct PCR using the working solution of DNA extracts (prepared according to steps 1.1 to 1.3.11) and the group-specific primer set (unlabeled, i.e., without modification) appropriate for the prey group targeted like described in steps 2.1.1 to 2.1.3 (for variations in the reaction mixture for the respective primer set, see Table 2). Run PCR using the standard protocol given in step 2.1.4 (for annealing temperatures for the respective primer set, see Table 2).
- Use one control with pure DNA from a specimen belonging to the respective target group (positive control) and one negative control with pure DNA from the consumer species in each PCR run.
- Check the success of the PCR reaction using agarose gel electrophoresis described in steps 2.1.6 to 2.1.11. The PCR reaction was successful if a fragment of appropriate length (see Table 2) is visible for the positive control but not for the negative control. If one or both of these criteria are unfulfilled, repeat PCR.
- Use agarose gel electrophoresis, as described in steps 2.1.6 to 2.1.11, to detect whether the prey group targeted had been consumed by the different consumer specimens tested (via judgment of whether the fragment of appropriate length is visible or not). Make sure not to miss fragments with low visual resolution.
- Store PCR products at 4 °C, if further analyses will be done within the next 24 h, or at -20 °C if analyses are to be performed later.
4. Subsequently Determine Consumed Prey Further Downstream Using SSCP Analysis via Polyacrylamide Gel.
- Prepare a 9% acrylamide gel for SSCP electrophoresis. Prepare the working solutions in a laboratory hood.
- To prepare a 200 mL acrylamide working solution, fill a measuring cylinder with 20 mL of 10x TBE (109 g of Tris base, 55 g of boric acid and 40 mL of 0.50 M EDTA, pH 8.0 dissolved in 1000 mL of ddH2O) and another one with 45 mL of 40% (29:1) acrylamide mix. Pour TBE and acrylamide mix into a graduated flask (a graduated glass bottle with a 200 mL mark is also appropriate here) and add ddH2O up to the 200 mL mark. Keep working solution in the fridge (4 °C) until needed. Do not use working solution older than one week.
- Weigh 0.1 g of ammonium persulfate (APS; use a balance with at least 0.01 g accuracy) into a 1 mL volumetric flask and dissolve it by adding ddH2O up to the graduation mark to prepare a 10% APS stock solution. Transfer aliquots (approximately 350 µL) into fresh reaction tubes.
NOTE: One aliquot is needed for each polyacrylamide gel. Store the remaining aliquots at -20 °C and only defrost aliquots shortly before they are needed. - Assemble a gel cassette compromised of two glass plates, one blank and one notched glass plate (each 20 cm x 20 cm), with spacers (1.5 mm thick) between them running up the sides of the glass. Use each three fold-back clips (32 mm) on the right and left side to fixate gel cassette (Figure 1).
- Mix 5 g of agarose and 250 mL of 1x TBE buffer in a conical flask to prepare solution for a 2% agarose gel. Heat and afterwards cool down mixture as described in steps 2.1.6 and 2.1.7. Swiftly pour the solution into a square-shaped plastic box (21 cm x 6.5 cm x 5 cm) and place the lower end of the gel cassette (step 4.1.3) into the agarose solution. Adjust the fold-back clips at the lower end of the gel cassette to a height so that they sit on the rim of the square-shaped plastic box (Figure 1). Wait approximately 20-30 min until the agarose plug has completely hardened.
- Fill a 100 mL measuring cylinder with the acrylamide working solution (step 4.1.1) until the 60 mL mark and pour solution into a beaker. Use a micropipette to add 300 µL of one aliquot of the APS stock solution (step 4.1.2) and to subsequently add 37.5 µL of tetramethylethylenediamine (TEMED). Swiftly, pour the solution between the glass plates of the gel cassette. Alternatively, inject the solution between the glass plates with a 100 mL disposable syringe with a 1,000 µL pipette tip adjusted to the injection head of the syringe.
- Carefully insert a 1.5 mm thick standard comb at the upper end between the glass plates. The comb must be surrounded by the polyacrylamide solution. Wait approximately 1 h until the polyacrylamide gel is polymerized. Avoid ventilation during polymerization as far as possible because it increases the time needed for the gel to polymerize.
NOTE: It is possible to store casted gels within sealed plastic bags with a wet tissue in the fridge up to 3 days.
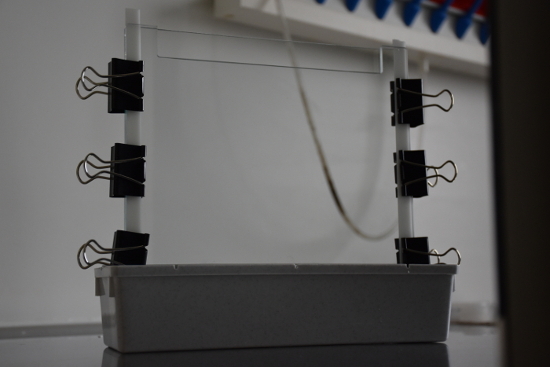
Figure 1: Picture illustrating the construction to pour polyacrylamide gels. Please click here to view a larger version of this figure.
- Place the gel cassette, containing the polyacrylamide gel prepared, into a vertical electrophoresis unit. Fill the electrophoresis unit with the appropriate amount (depending on the type of electrophoresis unit) of 0.5x TBE and cool the unit down to 10 °C using a refrigerated circulator.
- For DNA denaturation, preheat a thermal-block/-cycler to 96 °C. Prepare denaturation buffer with 95% formamide (99.5% p.a. grade) and 5% aqueous solution containing 0.25% bromophenol blue and 40% (w/v) sucrose.
- Take the PCR products out of the fridge or the freezer and defrost them. Spin down the PCR products using the short run option of a mini (plate) centrifuge. Then, mix each 4 µL of a PCR product with 4 µL of denaturation buffer. Heat mixtures for 5 min at 96 °C immediately followed by a cooling step in iced water for 10 min.
NOTE: Samples should be loaded onto the polyacrylamide gel (step 4.5) immediately after this. - Remove comb from the polyacrylamide gel (step 4.1.6) and use a micropipette to completely load each sample into a gel slot. Run electrophoresis at 8 W per gel while constantly cooling the electrophoresis unit to 10 °C. Running time needed depends on the size of fragment to be separated. For fragment sizes of approximately 210 bp, a running time of about 3.5 h is considered appropriate.
- To prepare a staining bath, pour 1,000 mL of 1x TBE into a square-shaped plastic box impermeable to light and add 30 µL of staining dye (suitable to stain single stranded DNA) with a microliter pipette. Close the lid of the plastic box and shake it to ensure equal distribution of the staining dye.
- Remove the gel cassette from the electrophoresis chamber and carefully separate the notched glass plate from the gel. Slide the polyacrylamide gel from the blank glass plate into the staining bath. Place the staining bath onto a shaking platform and stain gel for 20 to 30 min with constant shaking.
- Take the gel carefully out of the staining bath and place it onto the UV table of a documentation system.
NOTE: Due to the instability of the gel it is advisable to handle the prior step with two people. One person should hold the staining bath next to the UV table and another one should reach under the gel with both hands, take it out, and slide it onto the UV table. - Close the lid or door of the documentation system and take a photograph according to the manufacturer's instruction manual.
5. Detect Multiple Recently Ingested Prey Groups in Parallel Using Automated Fragment Analyses.
- Analyze the gut content DNA extracts using the 16 group-specific primer sets given in Table 2, with one primer of a set labelled due to modification with a staining dye (see Table 2 column titled Modification), and use the parallel detection methods of an automated sequencer.
- Use the working solution of DNA extracts (prepared according to steps 1.1 to 1.3.11) and conduct separate PCRs for each primer set like described in steps 2.1.1 to 2.1.5 (variations in the mixture are given in Table 2). Use at least one control with pure DNA from a specimen belonging to the respective target group (positive control) and one negative control with pure DNA from the consumer species in each PCR run.
- Run PCRs in the thermocycler using the standard PCR protocol given in step 2.1.4, adjusted to the respective annealing temperature (and number of cycles) for each primer set given in Table 2.
NOTE: Use the same DNA allocation of reaction wells for PCR with each of the 16 different primer sets to simplify subsequent pooling of PCR products for batched automated fragment analyses. - Store PCR products at -20 °C until all PCRs belonging to one batch for the automated fragment analyses (see Table 2) are finished. Keep PCR products in the dark and do not store them longer than 1 week prior to fragment analyses.
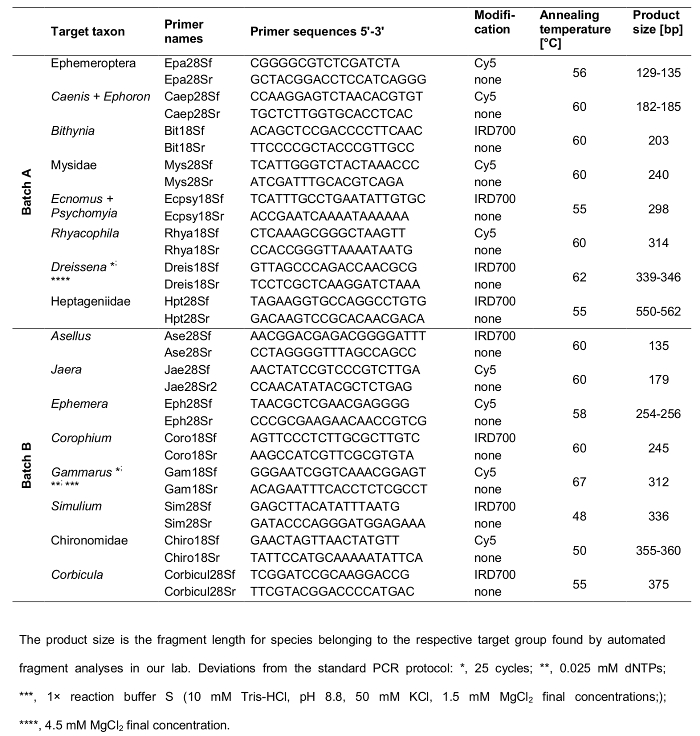
Table 2: Details of the 2 batches of 15 group-specific primer pairs established by Koester et al. (2013) and the newly designed Jae28S primer pair amplifying regions of the 18S or 28S rDNA from 16 target groups of aquatic macroinvertebrates. f, forward primers; r, reverse primers; 18S, primer targets the 18S rDNA subunit; 28S, primer targets the 28S rDNA subunit. "Hydrobiologia, Is Dikerogammarus villosus (Crustacea, Gammaridae) a 'killer shrimp' in the River Rhine system?, 768, 2016, Table S1, Supplementary material page 2, Koester Meike, Bayer Bastian, Gergs René, (© Springer International Publishing Switzerland 2015)" With permission of Springer. Please click here to view a larger version of this table.
- To detect the amplified fragments of all 16 primer sets conduct automated fragment analyses in the 2 batches given in Table 2. Use an internal size standard (DNA Size Standard Kit - 400 [Batch B] and - 600 [Batch A], respectively) to determine fragment length. Prepare the sequencing plate and automatic sequencer as described in the following steps. Note that this procedure might have to be adjusted if using another platform than that given in the Materials Table.
- To run each batch-sample, prepare a mixture containing Sample Loading Solution (SLS) and the respective size standard. Pipette 21.6 µL of SLS and 0.4 µL of DNA Size Standard Kit - 600 per sample of Batch A and, respectively, 21.7 µL of SLS and 0.3 µL of DNA Size Standard Kit - 400 per sample of Batch B.
- Take the PCR products of the 8 PCRs belonging to the respective batch out of the freezer and defrost them. Ensure that they are still kept in the dark.
- Use a microliter pipette to load the number of wells of a sequencing plate needed (number of samples to be analyzed) with each 22 µL of the respective mixture described in step 5.2.1. Spin down the PCR products of each of the 8 PCRs using the short run option of a mini (plate) centrifuge. Transfer each 1 µL per PCR product of each of the 8 PCRs into the respective wells of the sequencing plate with a microliter pipette.
- Carefully spin down this mixture within the sequencing plate with a short run of a mini plate centrifuge and overlay each of the wells used with one drop of mineral oil. Fill respective reaction wells of a buffer plate with 250-300 µL of DNA separation buffer.
- Use the software for the capillary sequencer to create a Sample Setup according to the manufacturer's instructions. Assign the methods to control sample sets and determine the sequence of methods to be used to process data (see Table 3 for running conditions adequate for use with the size standard given in the Materials Table). Note that it is crucial that the allocation of samples within the Sample Setup matches the sample allocation in the sequencing plate (including positive and negative controls, see step 5.1.1) and that the method adequate for fragment analyses with the respective size standard is chosen.
- Fill a wetting tray with deionized water and insert the sequencing plate, buffer plate and wetting tray into the capillary sequencer. Insert a gel cartridge containing a sufficient amount of fresh DNA separation gel which is needed for the sample run. Run the sequencing plate using the prepared Sample Setup.
| Denature | Seperate | Capillary | Inject | ||||
| Temperature | Time | Voltage | Time | Voltage | Time | ||
| size standard 600 | 90 °C | 120 s | 4.8 kV | 60 min | 50 °C Wait for Temp: YES | 2.0 kV | 30 s |
| size standard 400 | 90 °C | 120 s | 6 kV | 45 min | 50 °C Wait for Temp: YES | 2.0 kV | 30 s |
Table 3: Specific conditions for fragment analyses upon the automated sequencer using the size standards given in the Materials Table.
- To analyze the results export raw data and upload those data to a fragment analysis program. Choose standard dye color orders of the respective manufacturer to set dye color channels.
- Create a Panel outlining the expected range of fragment length amplified by the single group-specific primer sets within a batch according to the user manual of the program.
- To process the data, select the respective Panel, appropriate size standard, standard color, and type of analysis and run procedure. Choose the electropherogram option to display fluorescent signal intensities from capillary electrophoresis instruments as a single line trace for each dye color. Markers/primer sets will be displayed indicating the respective fragment range and the exact length of the detected fragment associated with the center of each called peak will be highlighted (in most programs by coloration or name assigned) automatically.
- For each sample, calculate how closely the sample's internal size standard matches the selected size standard to reassure the success of the size calling. Most fragment analyses programs have an option to automatically calculate and visualize this match. If the size calling failed, repeat fragment analyses for those samples.
- Visually recheck the electropherogram of each sample and confirm/unconfirm each peak called for each marker/primer set separately. Manually insert uncalled peaks that fit the criteria of a marker/primer set or delete wrong ones according to the user manual of the program used. Apply the base pair size or bin name in the 'Allele Label'. Calculate and display the peak specifications in the 'Peak Table'.
Access restricted. Please log in or start a trial to view this content.
Results
We successfully used steps described in this protocol for diet analyses within different studies. In this section, we present examples describing the applicability of the different sections of the protocol.
As an example, to demonstrate the effectiveness of group-specific primer sets established by the authors28 and the potential of further downstream analyses of PCR products by SSCP analyses, a feeding e...
Access restricted. Please log in or start a trial to view this content.
Discussion
Here, we present an easy and cost-efficient method for PCR-based determination of predator-prey interactions from field samples via group-specific primers for rDNA regions, which can be combined with other non-molecular analyses of the same specimens. However, there are several critical steps within the protocol. Firstly, assuring the specificity of the primers used is essential. Secondly, it is crucial to avoid contamination and loss of gut content material during the preparation of the gastro-intestinal tract and the s...
Access restricted. Please log in or start a trial to view this content.
Disclosures
The authors have nothing to disclose.
Acknowledgements
We thank Silke Classen from the Research Institute for Ecosystem Analysis and Assessment (gaiac), RWTH Aachen for her assistance in the establishment of the group-specific primer sets used in this protocol. We also thank Peter Martin and Laura Schynawa from the University of Kiel for the cooperation in the water mites' experiments. We also thank the technical lab assistants for keeping the lab running smoothly and preparing the register of companies and catalogue numbers. This work was supported by the German Research Foundation (DFG; project GE 2219/3-1).
Access restricted. Please log in or start a trial to view this content.
Materials
| Name | Company | Catalog Number | Comments |
|---|---|---|---|
| liquid nitrogen | Any | NA | For transport of field samples of macroinvertebrates to the laboratory. |
| 1.5 ml reaction tubes - Safelock | Any | NA | For collection of consumer specimens in the field and subsequent conservation in liquid nitrogen reaction tubes do not necessarily need to be PCR clean. To avoid exploding of the tubes, the lid of the tubes should be punctured with a needle. |
| Stereomicroscope | Any | NA | Make sure magnification is suitable to prepare the gastro-intestinaltract of the size of consumer of interest. |
| Petri dishes | Any | NA | To dissect the gastro-intestinal tract of consumer specimens under the stereomikroscope. |
| Stainless steel foceps: Dumont forceps No. 7 | Bioform | B40d | This curved stainless steel forceps can sometimes be very helful to hold specimen fixed inbetween the curved part without puncturing the gastro-intestinal tract. |
| Stainless steel foceps: Dumont forceps Electronic No. 5 | Bioform | B40b | This fine stainless steel forceps is ideally suited for the preparation of the gastro-intestinal tract of consumer specimens. |
| DNA-ExitusPlus | AppliChem | A7409,1000RF | Decontamination solution for the removal of DNA and RNA contaminations |
| fuzz-free paper towel | Any | NA | |
| Lab scale | Any | NA | Precision needs to be at least 0.01 g. |
| Microlitre pipettes (0.5-10/10-100/50-200/100-1000 μL) | Any | NA | |
| Safe-Lock Tubes 2.0 ml | VWR | 211-2165 | It is crucial that these raction tubes are free of DNA, DNase, RNase and PCR inhibitors (PCR clean)! |
| Safe-Lock Tubes 1.5 ml | VWR | 211-2164 | It is crucial that these raction tubes are free of DNA, DNase, RNase and PCR inhibitors (PCR clean)! |
| Sodium chloride ≥99.5%, p.a., ACS, ISO | carlroth | 3957.3 | For salt extraction buffer (SEB) and 5M NaCl-solution required for extraction of DNA. |
| Tris(hydroxymethyl)-aminomethane Tris | carlroth | 4855.2 | For salt extraction buffer (SEB) and TBE buffer |
| Microlitre pipettes (0.5-10/10-100/50-200/100-1000 μL) | carlroth | 8043.1 | For salt extraction buffer (SEB) and TBE buffer |
| Boric acid ≥99.8 %, p.a., ACS, ISO | carlroth | 6943.2 | For TBE buffer. Not needed if commercialy available TBE buffer is obtained. |
| Sodium dodecyl sulfate (SDS) | carlroth | 4360.1 | For extraction of DNA |
| Proteinase K lyophil. | carlroth | 7528.1 | Prepare a working solution containing 10 mg/ml. |
| TissueLyser II | Quiagen | 85300 | Bead mill for homogenization of the samples. |
| Stainless Steel Beads, 5 mm | Quiagen | 69989 | For homogenization of samples. |
| Heating Thermoshaker | Any | NA | |
| Vortex Mixer | Any | NA | |
| Refrigerated centrifuge: himac CT 15 RE | Hitachi | NA | Refrigerated centrifuge used for centrifugation during the extraction of DNA (Protocol 1). |
| Isopropanol | carlroth | 6752.5 | |
| Ethanol 99.8 %, p.a. | Any | NA | |
| Water Molecular biology grade (ddH2O) | AppliChem | A7398,1000 | nuclease-free (stream sterilized and DEPC treated) water used for re-suspension of DNA and whenever refered to ddH2O within the manuscript |
| Unmodified Olegonucleotides | Eurofins MWG Operon | NA | Primers unlabeled |
| Modified olegonucleotides | Metabion International AG | NA | Primers labelled |
| peqGOLD Taq all inclusive | VWR Peqlab | 01-1000 | Taq all inclusive for PCR reaction mixtures (reaction buffer Y and S, dNTPs and MgCl2) |
| Primus 96 advanced gradient thermocycler or peqStar96x Universal Gradient | Peqlab | NA | Primer sets were originally established on a Primus 96 advanced gradient thermocycler. As this cycler was quite old, we than checked if our primer sets are efficient and specific under the same conditions using the peqSta96x (which also could simulate the older model). However, tests showed that our primers work well and are still specific (see Koester et al. 2013) without using the simulation of the old machine. |
| Standard 96 Well PCR Plates | VWR Peqlab | 732-2879 | Used for PCR reactions. |
| Low Profile Tube Stripes 0.15 ml with Flat Cap Stripes | VWR Peqlab | 732-3223 | Cap stripes used to close the PCR plates. |
| Agarose | Peqlab | 35-1020 | Used for gel electrophoresis. |
| Microwave | Any | NA | |
| Conical flask | Any | NA | |
| Measuring cylinder | Any | NA | |
| Horizontal electrophoresis unit and respective combs with teeth | Any | NA | For agarose gel electrophoresis. |
| Electrophoresis Power Supply PS3002 | Life Technologies | NA | |
| Ethidium bromide solution 1 % | carlroth | 2218.1 | Used to prepare staining bath for agarose gels. |
| Formamide | carlroth | 6749.1 | Needded for the denaturation buffer for SSCP analyses. |
| Bromphenol blue | AppliChem | A3640.0010 | Needed for the loading dye for agarose gel electrophoresis. |
| Sucrose | carlroth | 4621.1 | Needed for the loading dye for agarose gel electrophoresis. |
| 100 bp-DNA-Ladder extended | carlroth | T835.1 | As size standard for agarose gel electrophoresis. |
| UV-Documentation system | Any | NA | To visualize gel electrophoresis results. |
| Rotiphorese NF-Acrylamide/Bis-solution 40 % (29:1) | carlroth | A121.1 | For the preparation of polyacrylamid gels. |
| Ammonium peroxydisulphate | carlroth | 9592.2 | For the preparation of polyacrylamid gels. |
| foldback clips (32 mm) | Any | NA | For the preparation of polyacrylamid gels. |
| square-shaped plastic box (21 × 6.5 × 5 cm) | Any | NA | For the preparation of polyacrylamid gels. |
| Tetramethylethylenediamine (TEMED) | carlroth | 23.67.1 | For the preparation of polyacrylamid gels. |
| Beaker | Any | NA | |
| RC 10 Digital chiller | VWR | 462-0138 | For SSCP analyses using polyacrylamide gel electrophoresis. |
| Vertical electrophoresis unit P10DS (OWL Separation Systems) | VWR | 700-2361 | For SSCP analyses using polyacrylamide gel electrophoresis. |
| Notched glass plate | VWR | 730-0261 | For SSCP analyses using polyacrylamide gel electrophoresis. |
| Blank glass plate | VWR | 730-0260 | For SSCP analyses using polyacrylamide gel electrophoresis. |
| Spacers | VWR | 730-0262 | For SSCP analyses using polyacrylamide gel electrophoresis. |
| Comb with 25 teeth | VWR | 730-0294 | For SSCP analyses using polyacrylamide gel electrophoresis. |
| Shaking platform | Any | NA | For constant shaking of the staining bath. |
| GelStar Nucleic Acid Stain (Lonza Rockland, Inc.) | Biozym | 850535 (50535) | For staining of polyacrylamide gels. |
| GenomeLab DNA Size Standard Kit 400bp | AB Sciex | 608098 | For automated fragment analyses. Size stanard for Batch B. |
| GenomeLab DNA Size Standard Kit 600bp | AB Sciex | 608095 | For automated fragment analyses. Size stanard for Batch A. |
| Sample Loading Solution (SLS) | AB Sciex | 608082 | For automated fragment analyses. |
| Sequenzing plate - 96 Well Polypropylene PCR Microplate | Costar | 6551 | For automated fragment analyses. |
| Plate centrifuge, PerfectSpin P | VWR Peqlab | NA | mini plate centrifuge used to spin down PCR products. |
| Buffer plate - 96 Well EIA/RIA Clear Flat Bottom Polystyrene Not Treated Microplate | Corning | 9017 | For automated fragment analyses. |
| GenomeLab Seperation buffer | AB Sciex | 608012 | For automated fragment analyses. |
| Separation Gel - LPAI | AB Sciex | 608010 | For automated fragment analyses. |
| Sequenzer - CEQ8000 Genetic Analysis System | Beckman Coulter | NA | For automated fragment analyses. |
| GeneMarker V1.95 | Softgenetics | NA | To analyze results of automated fragment analyses. |
References
- Carreon-Martinez, L., Heath, D. D. Revolution in food web analysis and trophic ecology: diet analysis by DNA and stable isotope analysis. Mol Ecol. 9 (1), 25-27 (2010).
- Hardy, C. M., Krull, E. S., Hartley, D. M., Oliver, R. L. Carbon source accounting for fish using combined DNA and stable isotope analyses in a regulated lowland river weir pool. Mol Ecol. 19 (1), 197-212 (2010).
- Baxter, C. V., Fausch, K. D., Saunders, W. C. Tangled webs: reciprocal flows of invertebrate prey link streams and riparian zones. Freshwater Biol. 50 (2), 201-220 (2005).
- Baxter, C. V., Fausch, K. D., Murakami, M., Chapman, P. L. Fish invasion restructures stream and forest food webs by interrupting reciprocal prey subsidies. Ecol. 85 (10), 2656-2663 (2004).
- Traugott, M., Kamenova, S., Ruess, L., Seeber, J., Plantegenest, M. Empirically Characterising Trophic Networks: What Emerging DNA-Based Methods, Stable Isotope and Fatty Acid Analyses Can Offer. Adv. Ecol. Res. Vol 49: Ecological Networks in an Agricultural World. 49, Elsevier Academic Press Inc. 177-224 (2013).
- Diaz Arredondo, M. A., Guzman del Proo, S. A. Feeding habits of the spiny lobster (Panulirus interruptus Randall, 1840) in Bahia Tortugas, Baja California Sur. Cienc Mar. 21 (4), 439-462 (1995).
- Letourneur, Y., Galzin, R., Harmelin-Vivien, M. Temporal variations in the diet of the damselfish Stegastes nigricans (Lacepède) on a Réunion fringing reef. J Exp Mar Biol Ecol. 217 (1), 1-18 (1997).
- Akin, S., Winemiller, K. O. Seasonal variation in food web composition and structure in a temperate tidal estuary. Estuar Coast. 29 (4), 552-567 (2006).
- Redd, K. S., Jarman, S. N., Frusher, S. D., Johnson, C. R. A molecular approach to identify prey of the southern rock lobster. Bull Entomol Res. 98 (3), 233-238 (2008).
- Gergs, R. Dreissena polymorpha in Lake Constance: An example of a keystone engineer? Universität Konstanz. , (2009).
- Sheppard, S. K., Harwood, J. D. Advances in molecular ecology: tracking trophic links through predator-prey food-webs. Funct Ecol. 19 (5), 751-762 (2005).
- Jarman, S. N., Ward, R. D., Elliott, N. G. Oligonucleotide primers for PCR amplification of coelomate introns. Mar Biotechnol (NY). 4 (4), 347-355 (2002).
- Verma, S. K., Singh, L. Novel universal primers establish identity of an enormous number of animal species for forensic application. Mol Ecol Notes. 3 (1), 28-31 (2003).
- Deagle, B. E., et al. Molecular scatology as a tool to study diet: analysis of prey DNA in scats from captive Steller sea lions. Mol Ecol. 14 (6), 1831-1842 (2005).
- Jarman, S. N., Deagle, B. E., Gales, N. J. Group-specific polymerase chain reaction for DNA-based analysis of species diversity and identity in dietary samples. Mol Ecol. 13 (5), 1313-1322 (2004).
- Jarman, S. N., Redd, K. S., Gales, N. J. Group-specific primers for amplifying DNA sequences that identify Amphipoda, Cephalopoda, Echinodermata, Gastropoda, Isopoda, Ostracoda and Thoracica. Mol Ecol Notes. 6 (1), 268-271 (2006).
- Hayashi, K., Yandell, D. W. How sensitive is PCR-SSCP? Hum Mutat. 2 (5), 338-346 (1993).
- Glavač, D., Dean, M. Optimization of the single-strand conformation polymorphism (SSCP) technique for detection of point mutations. Hum Mutat. 2 (5), 404-414 (1993).
- Mülhardt, C. Der Experimentator Molekularbiologie / Genomics. , 7th ed, Spektrum Akademischer Verlag. Heidelberg. (2013).
- Lee, S. V., Bahaman, A. R. Discriminatory Power of Agarose Gel Electrophoresis in DNA Fragments Analysis. Gel Electrophoresis - Principles and Basics. , InTech. (2012).
- Wang, X. W., et al. A new electrophoresis technique to separate microsatellite alleles. Afr J Biotechnol. 8 (11), 2432-2436 (2009).
- Gemmer, I., Gergs, R. Characterization of the first twelve microsatellite loci for the amphipod Gammarus roeselii (Crustacea: Amphipoda). Conserv Genet Resour. 5 (4), 955-957 (2013).
- Olafsson, K., Hjorleifsdottir, S., Pampoulie, C., Hreggvidsson, G. O., Gudjonsson, S. Novel set of multiplex assays (SalPrint15) for efficient analysis of 15 microsatellite loci of contemporary samples of the Atlantic salmon (Salmo salar). Mol Ecol Resour. 10 (3), 533-537 (2010).
- Baric, S., Hollrigl, A., Fureder, L., Petutschnig, J., Dalla Via, J. First analysis of genetic variability in Carinthian populations of the white-clawed crayfish Austropotamobius pallipes. Bull. Fr. Peche Piscicult. (380-381), 977-990 (2006).
- Koester, M., Gergs, R. No evidence for intraguild predation of Dikerogammarus villosus (Sowinsky, 1894) at an invasion front in the Untere Lorze, Switzerland. Aquat Invasions. 9 (4), 489-497 (2014).
- Sonnenberg, R., Nolte, A. W., Tautz, D. An evaluation of LSU rDNA D1-D2 sequences for their use in species identification. Front Zool. 4 (6), 6(2007).
- Koester, M., Bayer, B., Gergs, R. Is Dikerogammarus villosus (Crustacea, Gammaridae) a 'killer shrimp' in the River Rhine system? Hydrobiologia. 768 (1), 299-313 (2016).
- Koester, M., Claßen, S., Gergs, R. Establishment of group-specific PCR primers for the identification of freshwater macroinvertebrates. Conserv Genet Resour. 5 (4), 1091-1093 (2013).
- Martin, P., Koester, M., Schynawa, L., Gergs, R. First detection of prey DNA in Hygrobates fluviatilis (Hydrachnidia, Acari): a new approach for determining predator-prey relationships in water mites. Exp Appl Acarol. 67 (3), 373-380 (2015).
- Deagle, B. E., et al. Studying Seabird Diet through Genetic Analysis of Faeces: A Case Study on Macaroni Penguins (Eudyptes chrysolophus). PLoS One. 2 (9), e831(2007).
- Sint, D., Niederklapfer, B., Kaufmann, R., Traugott, M. Group-Specific Multiplex PCR Detection Systems for the Identification of Flying Insect Prey. PLoS One. 9 (12), e115501(2014).
- Zarzoso-Lacoste, D., Corse, E., Vidal, E. Improving PCR detection of prey in molecular diet studies: importance of group-specific primer set selection and extraction protocol performances. Mol Ecol Resour. 13 (1), 117-127 (2013).
- Vestheim, H., Jarman, S. Blocking primers to enhance PCR amplification of rare sequences in mixed samples - a case study on prey DNA in Antarctic krill stomachs. Front Zool. 5 (1), 12(2008).
- Harper, G. L., et al. Rapid screening of invertebrate predators for multiple prey DNA targets. Mol Ecol. 14 (3), 819-827 (2005).
Access restricted. Please log in or start a trial to view this content.
Reprints and Permissions
