We report a method to quantify muscle area, which is an indirect method to determine muscle mass in Drosophila adults. We demonstrate the application of our methodology by analyzing the indirect flight muscles in a Drosophila model of Myotonic Dystrophy disease.
Method Article
Optical Cross-Sectional Muscle Area Determination of Drosophila Melanogaster Adult Indirect Flight Muscles
In This Article
Summary
Abstract
Muscle mass wasting, known as muscle atrophy, is a common phenotype in Drosophila models of neuromuscular diseases. We have used the indirect flight muscles (IFMs) of flies, specifically the dorso-longitudinal muscles (DLM), as the experimental subject to measure the atrophic phenotype brought about by different genetic causes. In this protocol, we describe how to embed fly thorax muscles for semi thin sectioning, how to obtain a good contrast between muscle and the surrounding tissue, and how to process optical microscope images for semiautomatic acquisition of quantifiable data and analysis. We describe three specific applications of the methodological pipeline. First, we show how the method can be applied to quantify muscle degeneration in a myotonic dystrophy fly model; second, measurement of muscle cross-sectional area can help to identify genes that either promote or prevent muscle atrophy and/or muscle degeneration; third, this protocol can be applied to determine whether a candidate compound is able to significantly modify a given atrophic phenotype induced by a disease-causing mutation or by an environmental trigger.
Introduction
The thorax of the fruit fly contains two different classes of flight muscles, which are functionally, physiologically and anatomically distinct. These muscles are: the indirect flight muscles (IFM), which are composed of dorso-longitudinal (DLM) and dorso-ventral (DVM) muscles (Figure 1), and the synchronous flight control muscles1,2. These muscles together generate the elevated mechanical power required for flight. The size, distribution and rostro-caudal disposition of the IFMs allow an easy orientation for transversal sectioning3 (Figure 2A). For this reason, we have selected these muscles to study muscle atrophy in Drosophila melanogaster.

Figure 1. Diagram of the thorax of the fruit fly showing the indirect flight muscles (IFMs) arrangement. (Left) represents a lateral view and (Right) represents a cross section of the thorax. The IFMs are composed of the Dorso-longitudinal (DLM) muscles (in red) and the Dorso-ventral (DVM) muscles (in green).
Preservation of tissue structure and the control over dorso-ventral axis orientation of histological sections are critical to ensure proper assessment of muscle cross-sectional area. To preserve muscle structure we used a fixation mixture modified from Tomlinson et al.4 . Moreover, because muscles are internal tissues, the impermeability of Drosophila's exoskeleton is a problem as fixation mixtures cannot penetrate to the target tissues. To circumvent this problem, we removed the fly head, legs, wings and the last two segments of the abdomen to create holes that allowed the fixation mixture to enter. As part of the fixation protocol we included treatment with osmium tetroxide (OsO4)5, which is extensively used because of its ability to fix fats, including triglycerides. OsO4 preserves most structures extremely well, particularly at the cytological level and at the same time provides contrast to the image. After fixation, Drosophila thoraces were embedded in resin for transversal semi-thin sectioning (1.5 µm). For improved contrast, tissue can be additionally stained with toluidine blue. Images of complete thoraces were taken at 10X and muscle area was quantified by binarizing images (of equal dimensions) and quantifying percentage of pixels corresponding to muscle tissue (black pixels) out of total, with ImageJ software.
Modifications on the tissue preparation and fixation mixtures, as the increase of the concentration of OsO4 and glutaraldehyde solution, introduced in this protocol, allowed unique preservation of muscle tissue. This is because the protocol avoids the degradation and deformation of the tissue, making the posterior analysis of the samples more reliable even in highly atrophic conditions associated with neuromuscular degenerative diseases such as Myotonic Dystrophy (DM). In its more common form, DM type 1, this rare genetic disorder is brought about by expanded CUG repeats in myotonic dystrophy protein kinase (DMPK) transcripts. Mutant DMPK RNA aggregates form ribonuclear foci that sequester the Muscleblind-like nuclear RNA-binding proteins (MBNL1-3; Muscleblind (Mbl) in Drosophila)6. We generated a Drosophila model of Myotonic Dystrophy by expressing 250 CTG repeats under the muscular myosin heavy chain promoter (Mhc-Gal4). Model flies were flightless with a typical 'up-held wings' phenotype and had serious muscle atrophy in their IFMs (Figure 2B). Previous studies performed in our laboratory have shown that determination of the muscle area of IFMs is a reliable method to quantify the effects of different chemical or genetic modifiers of the muscle atrophy in these model flies7. As an example, overexpression of Mbl isoform C in flies expressing the 250 CTG repeats in the muscle, achieved a rescue of muscle area, as Mbl depletion by sequestration is the triggering factor in DM1 pathogenesis8 (Figure 2C). Muscle area was also rescued after feeding the DM model flies with Abp1, a hexapeptide with proven anti-DM1 activity9 (Figure 2D).
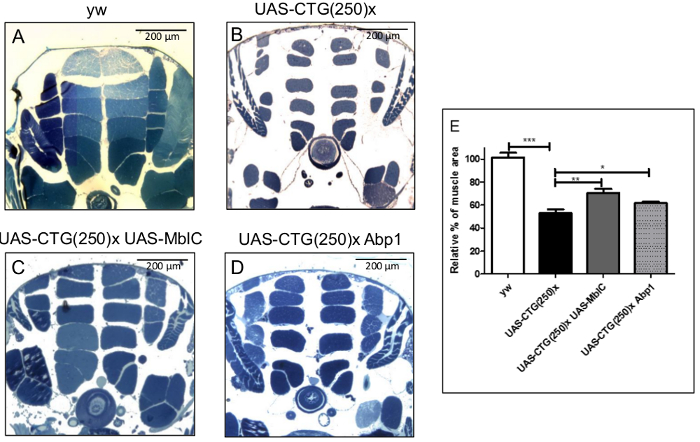
Figure 2. Quantification of dorsoventral sections of resin-embedded adult thoraces. (A-D) Indirect flight muscles of Drosophila melanogaster with the indicated relevant genotypes. (A) Control flies (yw). (B) Expression of 250 non-coding CTG repeats in muscle (UAS-CTG(250)x) caused a reduction of muscle area in DLMs in comparison to control flies. (C) This muscle atrophy phenotype was rescued by overexpression of Muscleblind (MblC) (UAS-CTG(250)x UAS-MblC) and (D) feeding the model flies with the hexapeptide Abp1 (UAS-CTG(250)x Abp1). In all images the dorsal side is on top. Transgenes were driven to muscle using a Myosin heavy-chain promoter (Mhc)-Gal4. (E) Quantification of percentage of muscle area relative to the control flies confirmed that the differences were significant. The histogram shows means ± S.E.M. **p<0.01 and *p<0.05 (Student´s t-test). Scale bar: 200 µm. Please click here to view a larger version of this figure.
The method here reported will be of interest to researchers focusing on muscle development, maintenance and aging, disease pathology and drug testing as it provides reliable information about how muscle tissue responds to both endogenous and external factors.
Access restricted. Please log in or start a trial to view this content.
Protocol
1. Fixation and resin embedding
- Anesthetize the flies with carbon dioxide (CO2) or via hypothermia using an ice block. Use a dissecting microscope (with low magnification to see the whole fly) and scissors to remove the legs, wings, head and the terminal part of abdomen to facilitate the penetration of the fixative. Careful handling of the carcasses is required at this step to avoid the deformation of the thorax.
NOTE: Start with at least 12 flies per genotype to ensure a sufficient number of properly processed individuals at the end of the procedure. - Transfer the carcasses to a 1.5 mL tube on ice (placing a maximum of 6 individuals per tube) containing 200 µL of solution 1.
NOTE: The carcasses cannot remain in the solution 1 for more than 20 min.- For solution 1, mix components in these volume proportions: ¼ 4% paraformaldehyde, ¼ 8% glutaraldehyde, ¼ 0.2 M Na2HPO4 and ¼ 0.2 M NaH2PO4.
- Add 200 µL of solution 2 and incubate on ice for 30 min.
- Solution 2: Mix solution 1 and OsO4 in a 1:1 (v/v) proportion.
CAUTION: OsO4 is extremely toxic. Manipulate it in a fume hood with appropriate safety and disposal measures.
- Solution 2: Mix solution 1 and OsO4 in a 1:1 (v/v) proportion.
- Remove all the liquid. Add 200 µL of solution 2 and incubate on ice for 1-2 h.
- Remove the solution and dehydrate the samples through a graded ethanol series as follows: once in 30 %, 50%, 70%, 90%, and twice in absolute ethanol; 5 min each. Add 1 mL of ethanol to cover the samples.
NOTE: Once the tissue is placed in 90% ethanol, the subsequent steps can be performed at room temperature. - Incubate the samples twice in propylene oxide for 10 min each incubation.
CAUTION: Propylene oxide is toxic, use it in a fume hood. - Replace the propylene oxide by a 1:1 (v/v) mixture of epoxy resin and propylene oxide and incubate at room temperature overnight.
CAUTION: The resin is extremely toxic in a liquid state.The resin is available as a set of four components (A, B, C and D).- For epoxy resin, add in a disposable beaker 54 g of resin (A), 44.5 g of hardener (B), 2.5 g of accelerator (C) and 10 g of plasticizer (D). Combine all the resin components in a fume hood. Store the resin in aliquots at -20 °C (for up to 6 months) or at -80 °C (for several years).
- To discard the resin, bake it at 70 °C for 24 h because solid resin is not toxic. Discard all the previous solutions in the Heavy Metals Group according to appropriate international procedures, because solutions can contain traces of OsO4.
- Replace the previous mixture with 100% resin, and incubate the samples for 4 h.
- Transfer the carcasses to plastic molds containing new resin (one carcass in each well of the mold). Use a sharpened wooden stick or needle to transfer and orient the carcasses in the wells and leave the resin to polymerize overnight in a Pasteur oven at 70 °C.
NOTE: To ensure appropriate orientation of the carcasses for posterior trimming and sectioning, the carcasses should be lying on their long side, with the anterior part of the carcass very near to the edge of the well.
2. Trimming and Sectioning of Blocks
- Remove the polymerized resin blocks from the molds. Use razor blades to trim away the resin, form a trapezoidal shape surrounding the carcass and give appropriate orientation in the microtome. Start sectioning all the carcasses after the transverse suture to obtain comparable results.
NOTE: The section must be perpendicular to the anteroposterior axis of the DLMs to trim the sample correctly ( Figure 3).
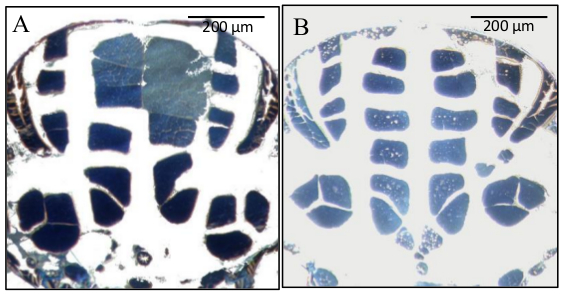
Figure 3. Dorsoventral sections of resin-embedded adult thoraces of the Myotonic Dystrophy model flies. In (A), the trimming of the sample was not correct as the section in the dorsal-right part of the image was not completely transversal to the muscles. As a consequence, the three muscle bundles on the upper right side seem bigger than the ones of the left side. This mistake would result in an overestimation of the muscle area. (B) Section from a correctly trimmed resin block. Scale bar: 200 µm.
- Cut 1.5-µm thick sections with an ultramicrotome and transfer the sections into water drops over gelatinized slides.
- Obtain the sections from the mesothorax segment for all the samples to obtain comparable results.
- Place the slides containing the sections on a heating block at 70-80 °C until the H2O evaporates. At this point, the samples can be observed with the OsO4 contrast (Figure 4A).
3. Staining IFM sections
- Cover the sections with enough toluidine blue for approximately 30 s on the heating block.
- For toluidine blue solution, dissolve 1% of toluidine blue and 1% of borax in H2O.
- Rinse with H2O and leave the slides on a warm plate to evaporate the water. Repeat the staining with toluidine blue if the contrast needs to be enhanced (Figure 4B).
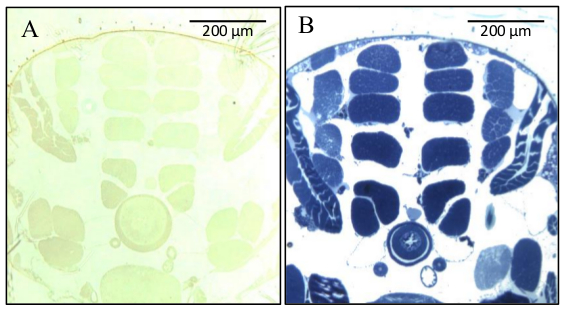
Figure 4. Dorsoventral sections of resin-embedded adult thoraces with different contrast stainings. Both panels show images of DM1 model flies fed with Abp1 as in Figure 2D. (A) Image of a section with the OsO4 contrast. (B) Section stained with toluidine blue allows better visualization of the muscle bundles. Scale bar: 200 µm.
4. Mounting IFM sections
- Dry the slides with the heating block until the H2O evaporates.
- Put 1 or 2 drops of mounting medium on the sections and put on a coverslip.
Caution: Carry out this step in a fume hood because the mounting medium is toxic.
5. Acquisition of images and quantification of muscle area
- Take the images at low magnification so that the whole set of DLM muscles is in focus. We normally use 10X.
- For statistical analysis take at least 5 serial images per fly and analyze at least 5 flies per experimental group.
- Select the image containing the whole muscles (Figure 5A). Check the axis or orientation of the section and discard the samples with inappropriate orientation, which would distort the results (compare Figures 3A/ 3B to distinguish between badly and well-oriented sections, respectively).
- Use ImageJ software to select an area (in pixels) containing only the DLMs (Figure 5A/5B). For comparison between different experimental groups, the reference area to be used would always be the fly with the biggest muscles. In all the images of the different genotypes to compare, select an area containing DLMs of equal dimensions to the reference area (Figure 5B).
- Binarize the images with the Image-J command: Process/Binary/Make binary and delete the areas or pixels that do not correspond to the muscles of interest (Figure 5C).
- In the case that artefactual black spots appear in areas other than muscle, delete them with the command Drawing tools and select the eraser symbol.
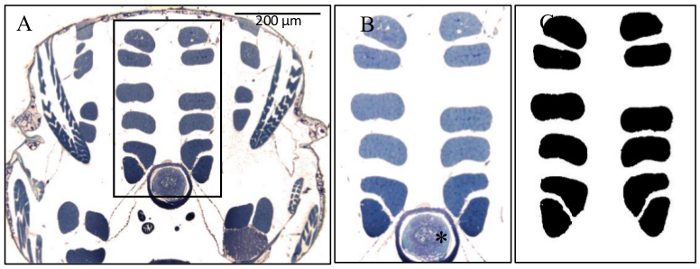
Figure 5. Image analysis procedure for muscle area determination. (A) Transversal section of Myotonic Dystrophy type 1 model fly thorax with a rectangle containing the DLM. (B) Selected area with only the indirect flight muscles and the intestine (*). (C) Binarized image. The black areas correspond to the muscles of interest. The intestine has been erased for an accurate quantification of muscle area. Scale bar: 200 µm.
- Quantify percentage of pixels corresponding to muscle tissue (black pixels) out of total with the command: Analyze/Measurement and select the option area fraction. This percentage of area is an estimation of the DLM muscular mass of each fly.
Access restricted. Please log in or start a trial to view this content.
Results
To quantify whether the overexpression of MblC or the administration of Abp1 had any effect in the atrophic phenotype of the Myotonic Dystrophy fly model we focused on the DLMs, which are part of IFMs (Figure 1). We determined that the model flies, which express 250 non-coding CTG repeats throughout the musculature driven by the Myosin heavy-chain promoter (Mhc)-Gal4, had a 50% reduction of muscle area compared to control flies. In contrast, co-expre...
Access restricted. Please log in or start a trial to view this content.
Discussion
It has been demonstrated that Drosophila melanogaster is a useful model to study human neuromuscular diseases7,10,11, including Myotonic Dystrophies, which are characterized by the appearance of muscular atrophy. The protocol presented here is a useful tool for quantifying the muscle degeneration caused by the onset or progression of a particular disease in a fly model. For example, it is also possible to follow and qua...
Access restricted. Please log in or start a trial to view this content.
Disclosures
No conflicts of interest declared.
Acknowledgements
The authors would like to thank members of the Translational Genomics Group and Kathryn J Hanson for the feed-back and the improvements on this protocol. This project was carried out with research grant SAF2015-64500-R, which includes European Regional Development Funds, awarded to R.A by the Ministerio de Economia y Competitividad.
Access restricted. Please log in or start a trial to view this content.
Materials
| Name | Company | Catalog Number | Comments |
|---|---|---|---|
| Image-J software | National Institutes of Health | https://imagej.nih.gov/ij/ | |
| Ultramicrotome | Leica | Leica UC6 | |
| Microscope | Leica | Leica MZ6 | Bright field technique. |
| Razor blades | Electron Microscopy Sciences | 71970 | Several alternative providers exist. |
| Scissors | World Precision World | 14003 | Several alternative providers exist. |
| Embedding molds | Electron Microscopy Sciences | 70900 | Several alternative providers exist. |
| Glutaraldehyde | Fluka (Sigma) | 49624 | Toxic. |
| OsO4 | Polyscience | 0972A | Extremely toxic. |
| Propylene oxide | Sigma Aldrich | 82320-250ML | Extremely toxic. |
| resin (Durcupan) | Sigma Aldrich | 44611-44614 | Carcinogenic when it is unpolymerized. |
| Toluidine blue | Panreac | 251176 | Toxic. |
| Mountant Medium (DPX) | Sigma Aldrich | 44581 | Dangerous. |
| Paraformaldehyde | Sigma Aldrich | P6148-500G | Harmful. |
| Na2HPO4 | Panreac | 122507 | 0.2 M dilution. |
| NaH2PO4 | Panreac | 121677 | 0.2 M dilution. |
| Borax | Panreac | 3052 | Toxic. |
References
- Fernandes, J., Bate, M., Vijayraghavan, K. Development of the indirect flight muscles of Drosophila. Development. 113, 67-77 (1991).
- Fernandes, J. J., Keshishian, H. Patterning the dorsal longitudinal flight muscles (DLM) of Drosophila: insights from the ablation of larval scaffolds. Development. 122, 3755-3763 (1996).
- Hartenstein, V. Atlas of Drosophila Development. Atlas Drosoph. Dev. , 1-57 (1993).
- Tomlinson, A., Ready, D. F. Cell fate in the Drosophila ommatidium. Dev. Biol. 123, 264-275 (1987).
- Griffith, W. P. Osmium Tetroxide And Its Applications. Platin Met Rev. 18, 94-96 (1974).
- Bird, T. D. Myotonic Dystrophy Type 1. GeneReviews. 1, 1-23 (1993).
- Bargiela, A., et al. Increased autophagy and apoptosis contribute to muscle atrophy in a myotonic dystrophy type 1 Drosophila model. Dis Model Mech. 8, 679-690 (2015).
- Llamusi, B., et al. Muscleblind, BSF and TBPH are mislocalized in the muscle sarcomere of a Drosophila myotonic dystrophy model. Dis. Model. Mech. 6, 184-196 (2012).
- García-López, A., Llamusí, B., Orzáez, M., Pérez-Payá, E., Artero, R. D. In vivo discovery of a peptide that prevents CUG-RNA hairpin formation and reverses RNA toxicity in myotonic dystrophy models. Proc. Natl. Acad. Sci. U.S.A. 108, 11866-11871 (2011).
- van der Plas, M. C., et al. Drosophila Dystrophin is required for integrity of the musculature. Mech. Dev. 124, 617-630 (2007).
- Lloyd, T. E., Taylor, J. P. Flightless flies: Drosophila models of neuromuscular disease. Ann New York Acad Sci. , 1184(2010).
- Babcock, D. T., Ganetzky, B. An improved method for accurate and rapid measurement of flight performance in Drosophila. J. Vis. Exp. , e51223(2014).
Access restricted. Please log in or start a trial to view this content.
Reprints and Permissions
Request permission to reuse the text or figures of this JoVE article
Request Permission