Here we present a method for directly measuring transfer RNA charging levels from purified Escherichia coli RNA as well as a way to compare relative levels of transfer RNA, or any other short RNA, across different samples based on the addition of spike-in cells expressing a reference gene.
Method Article
Quantification of the Abundance and Charging Levels of Transfer RNAs in Escherichia coli
Opens in a new tab
In This Article
Summary
Loading...
$$\rightleftharpoonup{xx}$$
$$\longleftharp{xx}$$,
$$\longrightharp{xx}$$,
Abstract
Loading...
$$\rightleftharpoonup{xx}$$
$$\longleftharp{xx}$$,
$$\longrightharp{xx}$$,
Transfer RNA (tRNA) is an essential part of the translational machinery in any organism. tRNAs bind and transfer amino acids to the translating ribosome. The relative levels of different tRNAs, and the ratio of aminoacylated tRNA to total tRNA, known as the charging level, are important factors in determining the accuracy and speed of translation. Therefore, the abundance and charging levels of tRNAs are important variables to measure when studying protein synthesis, for example under various stress conditions. Here, we describe a method for harvesting tRNA and directly measuring both the relative abundance and the absolute charging level of specific tRNA species in Escherichia coli. The tRNA is harvested in such a way that the labile bond between the tRNA and its amino acid is preserved. The RNA is then subjected to gel electrophoresis and Northern blotting, which results in separation of the charged and uncharged tRNAs. The levels of specific tRNAs in different samples can be compared due to the addition of spike-in cells for normalization. Prior to RNA purification, we add 5% of E. coli cells that overproduce the rare tRNAselC to each sample. The amount of the tRNA species of interest in a sample is then normalized to the amount of tRNAselC in the same sample. Addition of spike-in cells prior to RNA purification has the advantage over addition of purified spike-in RNAs that it also accounts for any differences in cell lysis efficiency between samples.
Introduction
Loading...
$$\rightleftharpoonup{xx}$$
$$\longleftharp{xx}$$,
$$\longrightharp{xx}$$,
In the following, we present a method for quantifying specific tRNAs and measuring their charging levels by Northern blotting. The method is based on a technique first developed by Varshney et al.1. By harvesting cells into trichloroacetic acid (TCA) and keeping the samples at 0 °C throughout the RNA purification, the ester bond between the tRNA and the amino acid is conserved2,3,4. Aminoacylated tRNAs can be distinguished from their nonacylated counterparts by gel electrophoresis and Northern blotting, due to a decreased mobility of the aminoacylated tRNA in the gel, caused by the covalently bound amino acid5. Additionally, we present a protocol for normalizing tRNA quantities by addition of spike-in cells overexpressing the rarely used tRNAselC 4.
tRNAs are some of the most abundant molecules in the bacterial cell and an absolutely vital part of the translation machinery. tRNAs bind amino acids and transfer them to the translating ribosomes. The binding of amino acids to tRNAs (aminoacylation or charging) is facilitated by aminoacyl tRNA synthetases. The relative abundance of different charged tRNAs is important for ensuring the fidelity of protein synthesis, because underrepresentation of the cognate charged tRNA for a given messenger RNA (mRNA) codon increases the likelihood that a near-cognate tRNA will erroneously deliver its amino acid to the growing polypeptide chain on the ribosome6. The importance of charged tRNA is reflected in the extensive response of the E. coli cell to a severe drop in the charging levels of a tRNA; the stringent response. During the stringent response the synthesis of tRNAs, ribosomal RNAs and most mRNAs is lowered in favor of transcription of specific mRNAs associated with amino acid biosynthesis and stress survival, and the growth rate of the cells is lowered dramatically7. Furthermore, recent work by us and others has shown that E. coli actively degrades the majority of its tRNA in response to stresses that limit translation4,8, suggesting that adjustment of the tRNA levels may be important for coping with such stresses. Thus, reliable measurements of tRNA abundances and charging levels will be an important tool for fully understanding bacterial stress responses.
E.coli is commonly used to express recombinant protein and due to the differences in codon usage between species, suboptimal expression is a problem often faced9. This can be circumvented by expression of additional tRNAs needed to translate the recombinant mRNA10. Measurements of tRNA charging levels in such strains could guide troubleshooting efforts and help optimize protein expression.
This method also enables the detection of "mischarging"; a tRNA molecule aminoacylated with a non-cognate amino acid. Aminoacylation by different amino acids may cause a tRNA to migrate with slightly different velocities through polyacrylamide gels1,11. In some cases, the method can also be used to distinguish different modification patterns on otherwise identical tRNAs3.
Another established biochemical procedure for the investigation of tRNA charging levels is periodate oxidation. The method relies on the observation that aminoacylated tRNA is protected from periodate oxidation and uncharged tRNA is not. After periodate oxidation treatment the recharging of the tRNA is used to estimate the charging levels of the harvested RNA. However, the recharging of several tRNAs has been shown to be affected by the treatment thus providing some inaccuracy12. The method presented here measures charging directly from purified RNA, thus excluding any biases from chemical or enzymatic reactions. One limitation of this method is that only one tRNA species is detected at a time, so although the same Northern blot can be stripped and reprobed for multiple tRNAs, it is time-consuming and somewhat laborious to collect data on many tRNAs.
A reliable way of normalizing samples to each other is vital in studies where the goal is to compare the relative levels of a molecule across different samples. Here we introduce a normalization procedure for RNA where a small aliquot of E. coli cells overexpressing the rare tRNAselC is added as a spike-in to all the experimental samples prior to RNA purification. This method is useful not only when examining tRNAs but for relative quantification of any species of RNA when the experimental setup is such that no endogenous RNA can be trusted to be present at the same cellular concentration in all the samples. For example, the level of a "housekeeping" RNA-like ribosomal RNA is often used as an endogenous reference to compare the relative quantities of another RNA between different samples13. But this is of little use if the cellular concentration of the reference RNA varies between samples, as can be the case for ribosomal RNA if sampling occurs during a stress response15,16,17 or during entry into stationary phase17. The addition of spike-in cells to the experimental samples prior to RNA purification provides a solid and accurate way of normalization independent of the sampling setup. Another way of standardization is the addition of one or more spike-in RNAs to the experimental samples after RNA purification. However, this method does not account for any differences in RNA recovery between samples.
Using E. coli cells that overexpress the reference RNA as spike-in cells (see Figure 1) in an experiment on E. coli has the drawback that it results in addition of a small amount of exogenous E. coli total RNA to the samples. We correct for this addition by analyzing a sample containing only spike-in cells in parallel with the experimental samples (see the Northern blot in Figure 2, lane labeled "selC"). The protocol presented is developed for E. coli K-12 but is likely to be applicable for most bacterial species.
Access restricted. Please log in or start a trial to view this content.
Protocol
Loading...
$$\rightleftharpoonup{xx}$$
$$\longleftharp{xx}$$,
$$\longrightharp{xx}$$,
1. Preparation of bacterial cultures.
- Grow all cultures in Erlenmeyer flasks with a culture/flask volume ratio of at most 1/6. In a typical experimental setup, grow the cultures at 37.0 °C and shaking at 160 rpm in morpholinepropanesulfonic acid (MOPS) minimal medium18 supplemented with the preferred carbon source, for example 0.2% glucose, for at least 10 consecutive generations before RNA harvest.
- The day before RNA harvest, dilute an outgrown culture of the desired strain in MOPS minimal medium in such a way that it will reach the desired OD436 at the desired time the following day. Calculate the volume of outgrown culture to use for inoculation by the formula:
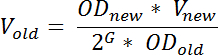
NOTE: Here, ODnew denotes the desired OD436 after incubation, Vnew denotes the volume of the diluted culture, ODold denotes the OD436 of the outgrown culture diluted from, G denotes the number of generations the culture will grow, from the time of dilution (t1) to the time it is needed the day after (t2) and can be calculated as: time difference (in min) between t1 and t2 divided by the generation time (in min). To ensure steady-state growth at the time of sampling, G should be ≥10; Vold denotes the volume of the out-grown culture that should be transferred to the fresh medium. This equation is an approximation that does not account for any lag phase; a phenomenon often observed after dilution of an out-grown culture in fresh media.- Growth conditions will vary depending on the purpose of the experiment, but to limit cell-to-cell variation in tRNA levels and to increase the reproducibility of the results, (recommended) grow the cultures to steady state prior to sampling19.
2. Preparation of spike-in cells
NOTE: The E. coli strain MAS1074, which expresses the selC gene encoding tRNAselC under the control of an isopropyl β-D-1-thiogalactopyranoside (IPTG)-inducible promoter is used as the spike-in strain.
- Dilute an outgrown culture of MAS1074 to an OD436 of 0.05 in MOPS minimal medium supplemented with 100 µg/mL ampicillin and 0.2% glucose. Grow the culture at 37 °C shaking at 160 rpm.
NOTE: See the Discussion for the use of an alternative reference strain. - At OD436 ~0.1, add IPTG to a final concentration of 1 mM to induce the expression of tRNAselC. Grow the culture to OD436 ~0.5 (~3-4 h of growth) and move the culture flask to an ice bath. Keep the spike-in cell culture on ice until all samples for RNA purification have been harvested.
3. Harvest of experimental samples.
- Pre-warm (37 °C) one capped 100 mL Erlenmeyer flask (or similar) containing 4 mL 10 % (w/v) trichloroacetic acid (TCA) for each sample by placing it in a heated water bath.
NOTE: CAUTION, TCA decomposes upon heating, producing toxic and corrosive fumes including hydrogen chloride and chloroform. The solution in water is a strong acid; it reacts violently with bases and is corrosive to many metals. Proper precaution should be taken when using this liquid. - Immediately prior to cell harvest, measure and record the OD436 of the culture.
- To harvest the cells, transfer 4 mL of culture to a pre-warmed flask containing TCA.
- Mix the sample by swirling the flask by hand for 5 s. Mixing with TCA immediately disables all enzymatic activities and thus preserves the charging levels of the tRNAs.
NOTE: If multiple samples are to be collected, keep harvested samples in TCA on ice until all samples have been collected.
4. Addition of spike-in cells
NOTE: Preparation of spike-in cells is described in Step 2.
- When all samples for RNA preparation have been collected, add 5% spike-in cells (based on OD) to each sample.
NOTE: The volume of spike-in cell culture needed is calculated by the formula:
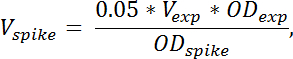
where Vspike denotes the volume of spike-in cell culture needed, Vexp denotes the volume of harvested experimental cell culture (without TCA), ODexp denotes the OD436 of the experimental cell culture at the time of harvest into TCA. ODspike denotes the OD436 of the spike-in cell culture. If multiple samples are harvested at different ODs, the volume of spike-in cells added should be adjusted according to the formula above for each sample. - To quantify the contribution from the spike-in cells to the RNA species of interest, prepare a sample only containing spike-in cells by mixing 4 mL spike-in cells with 4 mL TCA. Prepare RNA from this sample in the same way as for the other samples.
- Optionally, take another flask containing only the experimental sample, without spike-in cells, and include it to quantify the contribution of the experimental sample to the tRNAselC levels; the endogenous levels of tRNAselC in E. coli K-12 are negligibly low.
5. Preparation of RNA
NOTE: The RNA preparation protocol described here is essentially that described by Varshney et al.1; To avoid deacylation of the aminoacylated tRNAs during purification it is important to keep the samples at acidic pH and at 0 °C throughout the course of purification. Use clean sterile tubes/flasks to hold the samples and solutions, and prepare all solutions with ultrapure (18.2 MΩ·cm resistivity) water.
- Pour 8 mL of each sample into an ice-chilled centrifuge tube. Centrifuge samples for 10 min at 9,500 x g at 4 °C. Completely remove supernatant and resuspend in 0.3 mL cold 0.3 M sodium acetate, pH 4.5 and 10 mM EDTA.
- Transfer each sample to a cold 1.5 mL microcentrifuge tube and add 0.3 mL phenol equilibrated with the same buffer.
NOTE: CAUTION, phenol produces toxic fumes and is highly corrosive to the skin. - Vortex each sample 10x for 15 s with at least 1 min between each vortex. In between vortexing keep the samples at 0 °C. Use the frequent pauses to ensure that the samples remain cold.
- Centrifuge samples for 15 min at 20,000 x g at 4 °C. Transfer the water phase (upper phase) to new 1.5 mL microcentrifuge tubes. Add 0.3 mL cold phenol and vortex 4x 15 s as before.
- Centrifuge for 10 min at 20,000 x g at 4 °C. Transfer the water phase to new, cold 1.5 mL microcentrifuge tubes containing 2.5 times the volume of 96% ethanol (~750 µL). Precipitate the RNA by incubating the tubes for 1 h at -20 °C or overnight at -80 °C.
- Centrifuge samples for 30 min at 20,000 x g at 4 °C. Discard the supernatant and carefully add 1 mL cold 70% ethanol without disturbing the RNA pellet. Gently invert once to wash the insides of the tubes with ethanol.
NOTE: The pellet can be hard to see at this step. - Centrifuge for 10 min at 20,000 x g at 4 °C. Completely remove the supernatant and air-dry the pellet until no ethanol is left. Resuspend the pellet by vigorously vortexing in 20 µL cold 10 mM sodium acetate pH 4.5 and 1 mM EDTA.
NOTE: Do not over-dry the pellet as it will become difficult to resuspend. - Optionally, assess the concentration of RNA by measuring absorbance at 260 nm.
- Optionally, assess the quality of the purified RNA by agarose gel electrophoresis20.
- Store samples at -80 °C.
NOTE: The protocol can be paused here.
6. Preparation of chemically deacylated control sample
NOTE: To distinguish the band of aminoacylated tRNA from its deacylated counterpart on the Northern blot, a chemically deacylated aliquot is prepared by alkaline treatment. For most purposes, it is sufficient to deacylate a single sample for each Northern blot.
- Thaw the RNA sample on ice. Transfer a 4 µL aliquot of the RNA sample to a new tube. Add 46 µL Tris-HCl pH 9.0. Incubate for 2 h at 37 °C.
- Add 15 µL of 0.3 M sodium acetate at pH 4.5 and subsequently add 125 µL of 96% ethanol. Precipitate RNA at -20 °C for 1 h.
- Centrifuge for 30 min at 20,000 x g at 4 °C. Completely remove supernatant and resuspend in 4 µL cold 10 mM sodium acetate pH 4.5 and 1 mM EDTA.
NOTE: The protocol can be paused here, if the sample is stored at -80 °C.
7. Gel electrophoresis and Northern blotting
- Mix 4 µL sample (untreated or chemically deacylated) with 6 µL loading buffer (0.1 M sodium acetate (pH 5.0), 8 M urea, 0.05% bromophenol blue, and 0.05% xylene cyanol).
NOTE: Remember to include the sample containing only spike-in cells, the chemically deacylated sample (and the sample without spike-in cells, if one was prepared). - Load the samples onto a 0.4 mm thick 6.5% polyacrylamide gel (19:1 acrylam- ide:bisacrylamide) containing 8 M urea in 0.1 M sodium acetate buffer (pH 5.0). Use 60 cm long gels for proper separation of tRNA species.
- Separate the RNA by electrophoresis at 10 V/cm gel at 4 °C, until the bromophenol blue reaches the bottom of the gel (~20 h).
- The area from the xylene cyanol dye and 20 cm down towards the bromophenol blue dye is used for blotting (the distance between the two dyes should be 25-30 cm). Carefully separate the two glass plates, so that the gel remains on one of them. A thin piece of filter paper is cut to the size of the desired blotting area and placed on top of the part of the gel that will be used for blotting. The parts of the gel that are not covered by filter paper are cut off and discarded. Use the filter paper to carefully lift the gel piece away from the glass plate.
NOTE: The large gel is very fragile so handle with care. - A positively charged nylon membrane (e.g. Hybond N+ membrane) is placed on top of the gel and it is electroblotted at 20 V for 90 min using 40 mM Tris-acetate (pH 8.1), 2 mM EDTA as transfer buffer.
- Crosslink the RNA to the membrane using UV-light (0.12 J/cm2).
NOTE: The membrane can now be stored at room temperature and the protocol can be paused here.
8. Design and verification of probes
NOTE: Careful design and verification of Northern blot probes is crucial to obtain reliable results and avoid unwanted cross-hybridization with other RNA species.
- Use short synthetic oligonucleotides as probes. Design the probe sequence in a way that it is complementary to the most unique part of the sequence of the tRNA of interest - this is often the anticodon loop.
NOTE: A list of predicted tRNA sequences from various organisms can be found in the Genomic tRNA Database (GtRNAdb)21. - Adjust the length of the sequence to obtain a predicted melting temperature of 55-65 °C.
- BLAST (Basic Local Alignment Search Tool) the chosen sequence against the genome sequence of the bacterial strain used in the experiment, to verify that the sequence is unique to the selected tRNA, as described in22.
NOTE: Table 1 lists suggested probe sequences for several different tRNAs of E. coli K12. If the probe is specific for the tRNA of interest, only two bands are visible on the Northern blot (charged and uncharged tRNA) and only one band is visible in the lane with the deacylated sample (uncharged tRNA). If more than two bands are present or if further validation of probe specificity is desired, see Discussion.
9. Hybridization of Northern blot
NOTE: In the following steps, the membrane is sequentially hybridized with probes complementary to the desired specific tRNAs, including a probe specific for the reference tRNAselC.
- Place the membrane in a hybridization tube and add 6 mL hybridization solution (0.9 M NaCl, 0.05 M NaH2PO4 (pH 7.7), 5 mM EDTA, 0.5% (w/v) SDS, 100 mg/mL of sheared and denatured herring sperm DNA and 5x Denhardt's solution (100x Denhardt's solution = 2% bovine serum albumin, 2% polyvinylpyrrolidone 40, and 2% Ficoll)).
- Pre-hybridize the membrane in the buffer for 1 h rotating at 42 °C. Add 30 pmol radioactive oligo-DNA probe 5'-end-labeled with 32P (prepared as described by Sambrook et al.23)
NOTE: CAUTION, the high-energy beta emissions from 32P can present a substantial skin and eye dose hazard. Proper precaution should be taken when using 32P. Radioactive waste should be disposed of according to the appropriate institutional safety protocols. - Incubate the probe with the membrane overnight rotating at 42 °C. Remove the probe using a disposable 10 mL pipette.
NOTE: If stored in a freezer the probe can be reused. - In the hybridization tube, wash the membrane shortly in 50 mL of 0.3 M NaCl, 30 mM sodium citrate, 0.1% (w/v) SDS at room temperature.
NOTE: This first wash contains much unbound probe and must be handled as highly radioactive. - Repeat step 9.4 once, then move the membrane to a flat plastic container or tray including a lid. Cover the membrane with the washing solution (0.3 M NaCl, 30 mM sodium citrate, 0.1% (w/v) SDS) and incubate it for 30 min at room temperature.
- Change the washing solution and continue the washing until a satisfying signal to noise ratio has been obtained (often 3 - 4 changes of washing solution). Use a Geiger-Müller tube to detect how the noise to signal ratio changes by measuring the radiation from an empty area of the membrane and compare it to the area where the probe has hybridized specifically to tRNA.
- In order to be able to strip the probe from the membrane after exposure, ensure that (important) the membrane does not dry out before the stripping procedure. Place the membrane in a thin plastic bag or wrap it tightly using plastic wrap and seal it to be air-tight by tape or welding. Place the sealed membrane on a phosphorimaging screen.
NOTE: The required exposure time on the phosphorimaging screen is determined by the specific activity of the probe, the amount of RNA probed for, and the hybridization efficiency of the probe, and can vary greatly; from a few minutes to several days. With experience, the intensity of the radiation detected on the membrane with the Geiger-Müller tube gives a good indication of the required exposure time. For reliable quantification, it is important that the screen is not overexposed. - Scan the phosphorimaging screen using a laser scanner and save the file in ".gel" format.
NOTE: A high signal to noise ratio is necessary for reliable quantification. Probing for a tRNA should result in two bands; one containing aminoacylated tRNA (slower migration) and one containing deacylated tRNA (faster migration). See Figure 2.
10. Stripping the membrane
NOTE: Before the membrane can be probed for another tRNA, the previous probe must first be removed by stripping the membrane.
- Heat enough stripping buffer (15 mM NaCl, 1.5 mM sodium citrate, 0.1% (w/v) SDS) to cover the membrane and pour it over the membrane. Incubate it for 15 min at room temperature.
- Repeat step 10.1 until no radiation can be detected with a Geiger-Müller tube; the membrane can now be re-hybridized following the steps described in Section 9.
11. Quantifying tRNA and charging levels
- Load the .gel file into the imaging software (see the Table of Materials). Draw a vertical line along each of the sample lanes in such a way that it spans most of the width of the lane but excludes the edges of the bands where the signal can be uneven, as shown in Figure 3A.
- Visualize counts from each lane by clicking "Analysis" -> "Create Graph". Manually define the two peaks representing the charged and the uncharged tRNA from each lane, as shown in Figure 3B.
- Obtain counts from each peak by clicking "Analysis" -> "Area Report", and record the area under each of the two peaks.
- When the blot has been probed for tRNAselC and at least one tRNA of interest, normalize the levels of the tRNA of interest to tRNAselC.
- Calculate the proportion of tRNA originating from the spike-in cells in each lane and subtract from the total signal in that lane using the equation:

NOTE: Here, SampletRNA = the signal obtained from a single lane of a membrane probed for the desired tRNA; SampleselC = the signal obtained from the same lane of the same membrane probed for tRNAselC; ReftRNA = the signal obtained from the lane containing only spike-in cell RNA of the same membrane probed for the desired tRNA; RefselC = the signal obtained from the lane containing only spike-in cell RNA of the same membrane probed for tRNAselC. - To normalize, divide the corrected tRNA value from each lane by the tRNAselC signal from the same lane.
NOTE: The contribution to the tRNAselC signal from the sampled cells is negligible (See Figure 2, lane labeled "-selC").
- Calculate the proportion of tRNA originating from the spike-in cells in each lane and subtract from the total signal in that lane using the equation:
- Calculate the tRNA charging level for each lane by dividing the signal of the peak representing charged tRNA with the sum of the signal from both peaks (charged + uncharged).
Access restricted. Please log in or start a trial to view this content.
Results
Loading...
$$\rightleftharpoonup{xx}$$
$$\longleftharp{xx}$$,
$$\longrightharp{xx}$$,
Using the procedure described here, the abundance and charging levels of three tRNAs were measured in E. coli K-12 before and during amino acid starvation.
The arginine auxotroph strain NF9154 (thr leu his argH thi mtl supE44) was grown for at least ten generations in MOPS minimal medium supplemented with 0.4% glycerol, 50 µg/mL threonine, leucine, arginine, and 5 µg/mL histidine at 37 °...
Access restricted. Please log in or start a trial to view this content.
Discussion
Loading...
$$\rightleftharpoonup{xx}$$
$$\longleftharp{xx}$$,
$$\longrightharp{xx}$$,
This protocol describes how to simultaneously measure the charging level of specific E. coli tRNAs and compare the relative levels of the tRNAs in different samples. The critical points of the protocol are 1) to handle the samples in such a way that the cellular tRNA charging levels are retained, 2) to normalize tRNA quantities in such a way that relative tRNA levels in different samples can be reliably compared, and 3) to ensure the specificity of the selected probes for the tRNAs of interest. These points are ...
Access restricted. Please log in or start a trial to view this content.
Disclosures
Loading...
$$\rightleftharpoonup{xx}$$
$$\longleftharp{xx}$$,
$$\longrightharp{xx}$$,
The authors have nothing to disclose.
Acknowledgements
Loading...
$$\rightleftharpoonup{xx}$$
$$\longleftharp{xx}$$,
$$\longrightharp{xx}$$,
The authors thank Marit Warrer for excellent technical assistance. This work was supported by the Danish Council for Independent Research | Natural Sciences [1323-00343B] and the Danish National Research Foundation [DNRF120].
Access restricted. Please log in or start a trial to view this content.
Materials
| Name | Company | Catalog Number | Comments |
|---|---|---|---|
| Urea | Merck | 57-13-6 | Purity >99% |
| Polyacrylamide | Serva | 79-06-7 | |
| Bis (N,N'-Methylene-bis-acrylamide) | BIO-RAD | 161-0201 | |
| Trichloroacetic acid (TCA) | Sigma | 76-03-9 | |
| Phenol | Merck | 108-95-2 | |
| IPTG | |||
| Glucose | |||
| Sodium Acetate | |||
| EDTA | |||
| Ethanol | |||
| Tris | |||
| Hydrochloric acid | |||
| Sodium Chloride | |||
| NaH2PO4 | |||
| Sodium Citrate | |||
| SDS | |||
| Herring Sperm DNA | Sigma | 100403-24-5 | |
| BSA | |||
| Polivinylpyrrolidone | |||
| Ficoll | |||
| P32 γATP | Perkin Elmer | ||
| DNA oligos (probes) | TAG Copenhagen | ||
| Hybond N+ membrane | GE Healthcare | RPN203B | |
| Crosslinker | |||
| Electroblotter | BIO-RAD | ||
| Typhoon FLA 7000 Scanner | GE Healthcare | 28955809 | |
| Spectrophotometer | |||
| Hydridization oven | |||
| Geiger-Müller tube | |||
| Phosphor imager screen | GE Healthcare | ||
| Hybridization tube | |||
| Culture Flasks | |||
| 1.5 ml microcentrifuge tubes | |||
| 20 ml centrifuge tubes | |||
| Name | Company | Catalog Number | Comments |
| Software | |||
| ImageQuant | GE Healthcare | ||
| Excel | Microsoft |
References
Loading...
$$\rightleftharpoonup{xx}$$
$$\longleftharp{xx}$$,
$$\longrightharp{xx}$$,
- Varshney, U., Lee, C. -P., RajBhandary, U. L. Direct analysis of aminoacylation levels of tRNAs in vivo. Application to studying recognition of Escherichia coli initiator tRNA mutants by glutaminyl-tRNA synthetase. J Biol Chem. 266 (36), 24712-24718 (1991).
- Sorensen, M. A. Charging levels of four tRNA species in Escherichia coli Rel(+) and Rel(-) strains during amino acid starvation: a simple model for the effect of ppGpp on translational accuracy. J Mol Biol. 307 (3), 785-798 (2001).
- Krüger, M. K., Sørensen, M. A. Aminoacylation of hypomodified tRNAGlu in vivo. J. Mol. Biol. 284 (3), 609-620 (1998).
- Svenningsen, S. L., Kongstad, M., Stenum, T. S., Muñoz-Gómez, A. J., Sørensen, M. A. Transfer RNA is highly unstable during early amino acid starvation in Escherichia coli. Nucleic Acids Res. 45 (2), 793-804 (2017).
- Enriquez, J. A., Attardi, G. Evidence for aminoacylation-induced conformational changes in human mitochondrial tRNAs. Proc Natl Acad Sci U S A. 93 (16), 8300-8305 (1996).
- Parker, J. Errors and alternatives in reading the universal genetic code. Microbiol Rev. 53 (3), 273-298 (1989).
- Traxler, M. F., et al. The global, ppGpp-mediated stringent response to amino acid starvation in Escherichia coli. Mol Microbiol. 68 (5), 1128-1148 (2008).
- Zhong, J., et al. Transfer RNAs Mediate the Rapid Adaptation of Escherichia coli to Oxidative Stress. PLoS Genet. 11 (6), e1005302(2015).
- Kane, J. F. Effects of rare codon clusters on high-level expression of heterologous proteins in Escherichia coli. Curr Opin Biotechnol. 6 (5), 494-500 (1995).
- Baca, A. M., Hol, W. G. Overcoming codon bias: a method for high-level overexpression of Plasmodium and other AT-rich parasite genes in Escherichia coli. Int J Parasitol. 30 (2), 113-118 (2000).
- Li, S., Pelka, H., Schulman, L. The anticodon and discriminator base are important for aminoacylation of Escherichia coli tRNA (Asn). J Biol Chem. 268 (24), 18335-18339 (1993).
- Rizzino, A. A., Freundlich, M. Estimation of in vivo aminoacylation by periodate oxidation: tRNA alterations and iodate inhibition. Anal Biochem. 66 (2), 446-449 (1975).
- Dittmar, K. A., Sorensen, M. A., Elf, J., Ehrenberg, M., Pan, T. Selective charging of tRNA isoacceptors induced by amino-acid starvation. EMBO Rep. 6 (2), 151-157 (2005).
- Zhou, K., et al. Novel reference genes for quantifying transcriptional responses of Escherichia coli to protein overexpression by quantitative PCR. BMC Mol Biol. 12 (1), 18(2011).
- Jacobson, A., Gillespie, D. Metabolic events occurring during recovery from prolonged glucose starvation in Escherichia coli. J Bacteriol. 95 (3), 1030-1039 (1968).
- McCarthy, B. The effects of magnesium starvation on the ribosome content of Escherichia coli. Biochim Biophys Acta (BBA)-Specialized Section on Nucleic Acids and Related Subjects. 55 (6), 880-889 (1962).
- Zundel, M. A., Basturea, G. N., Deutscher, M. P. Initiation of ribosome degradation during starvation in Escherichia coli. Rna. 15 (5), 977-983 (2009).
- Piir, K., Paier, A., Liiv, A., Tenson, T., Maivali, U. Ribosome degradation in growing bacteria. EMBO Rep. 12 (5), 458-462 (2011).
- Schaechter, M., Maaloe, O., Kjeldgaard, N. O. Dependency on medium and temperature of cell size and chemical composition during balanced grown of Salmonella typhimurium. J Gen Microbiol. 19 (3), 592-606 (1958).
- Neidhardt, F. C., Bloch, P. L., Smith, D. F. Culture medium for enterobacteria. J Bacteriol. 119 (3), 736-747 (1974).
- Sambrook, J., Fritsch, E. F., Maniatis, T. Molecular cloning: a laboratory manual. , Cold spring harbor laboratory press. (1989).
- Sorensen, M. A., Jensen, K. F., Pedersen, S. High concentrations of ppGpp decrease the RNA chain growth rate. Implications for protein synthesis and translational fidelity during amino acid starvation in Escherichia coli. J Mol Biol. 236 (2), 441-454 (1994).
- Tian, C., et al. Rapid Curtailing of the Stringent Response by Toxin-Antitoxin Module-Encoded mRNases. J Bacteriol. 198 (14), 1918-1926 (2016).
Access restricted. Please log in or start a trial to view this content.
Reprints and Permissions
Request permission to reuse the text or figures of this JoVE article
Request Permission