The aim of this protocol is to describe step-by-step the technique of minimally invasive transverse aortic constriction (TAC) in mice. By elimination of intubation and ventilation which are mandatory for the commonly used standard procedure, minimally invasive TAC simplifies the operative procedure and reduces the strain put on the animal.
Method Article
Technique of Minimally Invasive Transverse Aortic Constriction in Mice for Induction of Left Ventricular Hypertrophy
In This Article
Summary
Abstract
Transverse aortic constriction (TAC) in mice is one of the most commonly used surgical techniques for experimental investigation of pressure overload-induced left ventricular hypertrophy (LVH) and its progression to heart failure. In the majority of the reported investigations, this procedure is performed with intubation and ventilation of the animal which renders it demanding and time-consuming and adds to the surgical burden to the animal. The aim of this protocol is to describe a simplified technique of minimally invasive TAC without intubation and ventilation of mice. Critical steps of the technique are emphasized in order to achieve low mortality and high efficiency in inducing LVH.
Male C57BL/6 mice (10-week-old, 25-30 g, n=60) were anesthetized with a single intraperitoneal injection of a mixture of ketamine and xylazine. In a spontaneously breathing animal following a 3-4 mm upper partial sternotomy, a segment of 6/0 silk suture threaded through the eye of a ligation aid was passed under the aortic arch and tied over a blunted 27-gauge needle. Sham-operated animals underwent the same surgical preparation but without aortic constriction. The efficacy of the procedure in inducing LVH is attested by a significant increase in the heart/body weight ratio. This ratio is obtained at days 3, 7, 14 and 28 after surgery (n = 6 - 10 in each group and each time point). Using our technique, LVH is observed in TAC compared to sham animals from day 7 through day 28. Operative and late (over 28 days) mortalities are both very low at 1.7%.
In conclusion, our cost-effective technique of minimally invasive TAC in mice carries very low operative and post-operative mortalities and is highly efficient in inducing LVH. It simplifies the operative procedure and reduces the strain put on the animal. It can be easily performed by following the critical steps described in this protocol.
Introduction
Over the past years, the study of heart failure has been conducted in viable animal models1. Compared to large animal models of heart failure, small animal models have numerous potential advantages. Beside lower costs of housing and maintenance, small animal models are accessible to more researchers due to the less complex facilities needed2.
Mouse heart failure models offer many of the same advantages as the rat models. In addition to reduced housing costs3, mouse models benefit from the availability of relevant transgenic and knockout (KO) strains. The possibility of cell type-specific, inducible KO or transgenic strategies make the mouse an invaluable tool to study the pathogenesis of heart failure and to try to identify novel therapeutic regimens3.
Among the mouse models of heart failure currently used4, transverse aortic constriction (TAC) which was first described by Rockman5 is the preferred model to generate pressure overload-induced left ventricular hypertrophy (LVH)1,3. The greatest advantage of this model is the ability to allow stratification of LVH2, although left ventricular remodeling in response to TAC is variable among different mouse strains. In particular, C57BL/6 mice develop rapid LV dilation after TAC that may not occur with other strains4,6,7.
The sudden onset of hypertension achieved with TAC causes an approximately 50% increase in LV mass within 2 weeks, allowing to rapidly examine the activity of pharmacological or molecular interventions aiming at modulating the development of LVH4. The acute induction of severe hypertension by TAC does not exactly reproduce the progressive left ventricular hypertrophy and remodeling observed in the clinical setting of aortic stenosis or arterial hypertension. Nevertheless, this model is used by many investigators to identify and modify novel therapeutic targets in heart failure4.
Performing TAC in mice requires greater surgical expertise than that required for other techniques used to induce LVH and subsequent heart failure2. Most authors perform this procedure by intubating and ventilating the animal2,8, which makes this procedure more demanding and time-consuming and adds to the surgical burden for the animal. Only few investigators have used minimally invasive TAC in their study with brief reference to the surgical procedure9,10,11.
The aim of this protocol is to describe step-by-step a simplified and user-friendly technique of minimally invasive transverse aortic constriction in mice, highlighting the critical stages of the procedure. By following these key steps, one can easily perform this technique.
Protocol
Male C57BL/6J mice (10 weeks, 25 - 30g, n=60) are used in this protocol. Animals receive humane care in compliance with the guidelines formulated by the French Ministry of Agriculture and of Higher Education and Research, and all procedures are performed in accordance with the European Community Council Directive of November 24, 1986 (86/609/EEC) and the French laws. The protocol was approved by the "Regional Ethics Committee for Animal Experimentation CREMEAS" (#2016092816207606).
1. Preparation for surgery
- Maintain the mice for one week after arrival in the animal facility on a 12h/12h light/dark cycle, in standard cages, with food (for details see the Table of Materials) and water available ad libitum.
- On the day of operation, place the mice in individual cages a few minutes prior to induction of anesthesia, in order to avoid any additional stress to the animal. Sterilize all surgical instruments the day before surgery.
- Inject intra-peritoneally a single dose of a mixture of ketamine (51.4 mg/kg) and xylazine (3.3 mg/kg) diluted in saline solution (0.9% NaCl).
- Make sure of the depth of the anesthesia by the absence of the toe-retreat reflex.
- Shave the neck and chest of the animal with a commercially available razor and disinfect the shaved area with 70% alcohol.
- Place the animal supine on a clean cork working pad and fix the paws with adhesive tape.
2. Surgery
- Sterile surgical technique is used throughout the procedures. In a spontaneously breathing animal, perform a longitudinal midline cervical incision over 10 mm with an 11-blade knife from supra-sternal notch to the mid-chest in order to expose the sternum (Figure 1).
- Retract the thyroid by passing a 4/0 monofilament polypropylene stay suture with a Crile-Wood needle holder and tape it to the working pad.
- Separate bluntly the pre-tracheal muscles with micro-surgical forceps to uncover the trachea.
- Slide gently the smooth-tipped curved micro-surgical forceps with the closed jaws over the trachea and behind the sternum.
- By carefully opening and closing the jaws of the smooth-tipped curved microsurgical forceps carry out a blunt dissection under the pre-tracheal muscles and behind the sternum to move the pleura away.
- Grasp the right supra-clavicular muscles with the smooth-tipped straight micro-surgical forceps and pull up gently the chest of the animal.
- Slide the inferior jaw of the bone nipper under the sternum and perform a 3-4 mm upper partial sternotomy (Figure 2). Direct the lower part of the mini-sternotomy slightly toward the left.
- Pass a 7/0 monofilament polypropylene stay suture from inside to outside through the second intercostal space on each side of the mini-sternotomy using a micro-surgical needle holder. Stay close to costo-sternal angle to avoid injury to intercostal and internal thoracic vessels or pleura.
- Spread the sternal edges using 7/0 monofilament polypropylene stay sutures on each side and fix them to the working pad with adhesive tape.
- Gently move aside the pre-tracheal muscles, mediastinal fat and thymus using smooth-tipped curved microsurgical forceps to visualize the aortic arch under low-power magnification (2 - 3X) (Figure 3). Take particular care not to touch or damage the parietal pleura to prevent pneumothorax development.
- Expose the soft tissue under the aortic arch by tying forceps (Figure 4A) and spread gently its jaws. Prepare a tunnel in the soft tissue under the aortic arch with second tying forceps by gently opening and closing the jaws in the soft tissue.
- Pass a segment of 6/0 silk ligature threaded through the eye of a ligation aid (Figure 4B) held in the left hand under the aortic arch and retrieve it by tying forceps held in the right hand between the origin of the right innominate and left common carotid arteries (Figure 5).
- Cut a 27-gauge needle to a length of 5 mm and blunt both ends by pressing them with a Crile needle holder. Place the blunted 27-gauge needle next to the aortic arch (Figure 6) with smooth-tipped straight micro-surgical forceps and tie the suture snugly around the needle and the aorta between the right innominate and left common carotid arteries using the two tying forceps (Figure 7). To tie snugly the suture, perform an initial double knot followed by four additional knots. Make sure that all knots are flat.
- After ligation, remove quickly but gently the needle to achieve a 0.4 mm diameter narrowing and a reproducible transverse 65-70% aortic constriction.
- Check for hemostasis of the soft tissue around the aortic arch, of the sternal edges and pre-tracheal muscles. Put resorbable hemostatic gauze wherever oozing of blood is observed.Remove the 7/0 monofilament polypropylene stay sutures used for spreading the sternal edges.
- Pass a simple 6/0 monofilament polypropylene suture with a micro-surgical needle holder from outside to inside of the left second intercostal space and then from inside to outside of the right second intercostal space. Stay close to costo-sternal angle to avoid injury to intercostal and internal thoracic vessels or pleura.
- Bring together the sternal edges by tying 6/0 monofilament polypropylene suture with a Crile-Wood needle holder.
- Close the skin with a 5/0 monofilament polypropylene running suture in one layer with a Crile-Wood needle holder.
- Perform the sham procedure identical to the constriction operation but without tying a suture around the aorta.
3. Post-operative recovery
- Monitor the animals very closely. Transfer the mouse to an individual cage and place it in a prone position.
- Allow the mouse to recover under a warming light until fully awake (less than 1 h after inducing anesthesia).
- For post-operative analgesia, inject 0.1 mg/kg of buprenorphine intraperitoneally. Repeat subcutaneous injections of 0.1 mg/kg of buprenorphine every 8 h for the first three days as indicated.
- Place the operated mice in standard cages (maximum 3 mice per cage and minimum 2 mice per cage).
4. Heart harvest
- On the day of analysis, euthanize the mouse with a solution of ketamine 300 mg/kg and xylazine 20 mg/kg in saline by intraperitoneal injection.
- First harvest the blood from the inferior vena cava and then through the same line inject 5 mL of solution of 2.6 mM EDTA in saline.
- Harvest the heart, remove the atria and weight the heart (left and right ventricles without atria).
- Separate the left from the right ventricle with the septum remaining to the left ventricle part. Weigh both tissue samples and freeze them in liquid nitrogen.
Results
Operative and late survival
The operative survival was very high, 98.3% (59 out of 60) for the entire series (TAC and sham-operated animals). The only operative death was due to a bleeding complication in a mouse planed for sham operation. Post-operative survival during the observation period of 28 days was also excellent, by 98.3% (58 out of 59). The only late post-operative death occurred in a TAC mouse on day (D) 16, possibly of cardiac origin.
Validation of the technique
The presented technique is very reliable and reproducible. The correct placement of the suture between the right innominate and left common carotid arteries was confirmed during tissue harvest in all animals undergoing TAC.
The efficacy of the technique to induce left ventricular hypertrophy was validated by determination of heart weight/body weight ratios (HW/BW, mg/g) at 3, 7, 14 and 28 days post-surgery. The HW is the weight of the left and right ventricles without atria. The HW/BW ratio significantly increased in the banded compared to the sham groups from post-operative D7 (4.9±0.2 versus 4.1±0.05 mg/g, P<0.01) on, and remained significantly higher up to D28 (5.8±0.3 versus 4.1±0.1 mg/g, P<0.0001) post-surgery (Figure 8). The observed increase in HW/BW ratio was solely due to a rise in left ventricle/body weight ratio (Figure 9A) since the right ventricle/body weight ratio remained comparable between TAC and sham-operated animals during the whole observation period (Figure 9B).
Further, we measured in the left ventricle tissue the mRNA expression of the biomarkers of cardiac hypertrophy as previously described12. At D14, mRNA expression of brain natriuretic protein (BNP), atrial natriuretic protein (ANP), angiotensin converting enzyme (ACE), collagen 1a1 (Col1a1) and transforming growth factor ß (TGFß) was significantly higher in aortic-banded compared to sham-operated animals (Figure 10). Hence, the observed left ventricular hypertrophy validates the efficiency of our TAC technique.
Mean and standard error of mean values were compared between TAC and sham groups using one-way ANOVA followed by Bonferroni's post-hoc test for comparison of paired data.
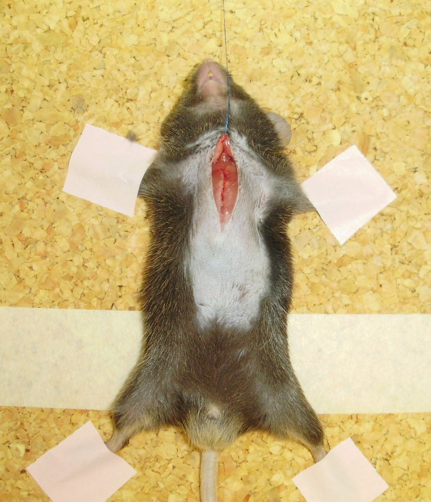
Figure 1: Incision.
The skin is incised over 10 mm from supra-sternal notch to mid-sternum and the thyroid is retracted with a stay suture. Please click here to view a larger version of this figure.
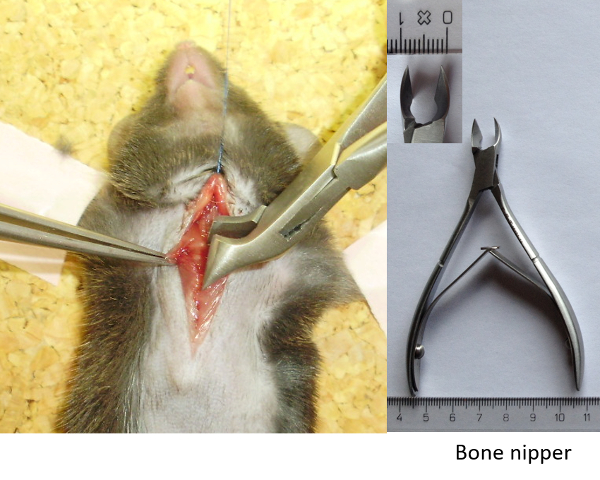
Figure 2: Bone nipper.
This instrument allows a short and precise cut in the bone for a 3-4 mm upper partial superior mini-sternotomy. Please click here to view a larger version of this figure.
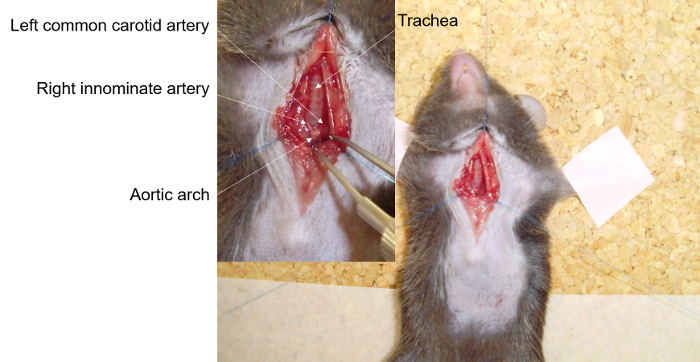
Figure 3: Exposure.
Following retraction of the sternal edges with 7/0 stay sutures, the aortic arch, right innominate and left common carotid arteries together with the trachea are exposed. Please click here to view a larger version of this figure.

Figure 4: A. Tying forceps. These forceps are necessary to perform a gentle and blunt dissection behind the sternum and around the aortic arch. B. Ligation aid. This is the key instrument for realizing a delicate and atraumatic passage under the aortic arch both in TAC and sham-operated mice. Please click here to view a larger version of this figure.
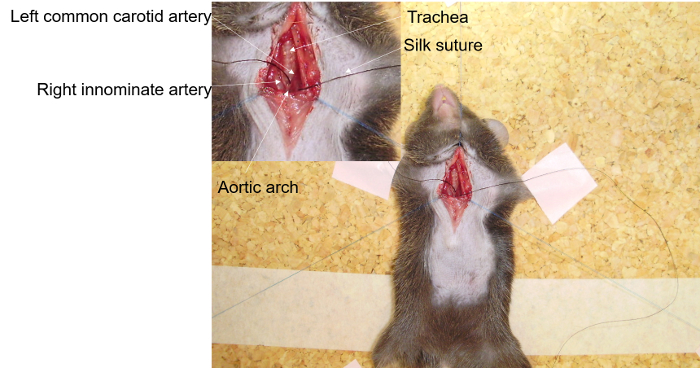
Figure 5: Passage under the aortic arch.
A segment of 6/0 silk ligature is passed under the aortic arch using the ligation aid and placed between the right innominate and left common carotid arteries. Please click here to view a larger version of this figure.
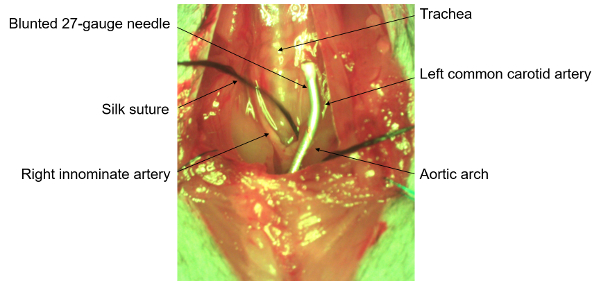
Figure 6: Preparation for ligation.
A short segment 2-3 mm of a blunted 27-gauge needle is placed over the aortic arch. Please click here to view a larger version of this figure.
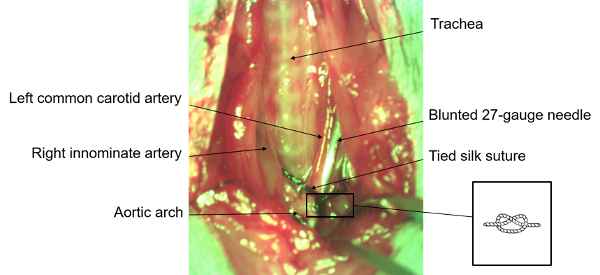
Figure 7: Transverse aortic constriction.
The silk suture is tied over the needle and the aortic arch between the right innominate and left common carotid arteries using tying forceps. The silk instead of polypropylene suture is preferred for the aortic ligation because the knot will better hold. Please click here to view a larger version of this figure.
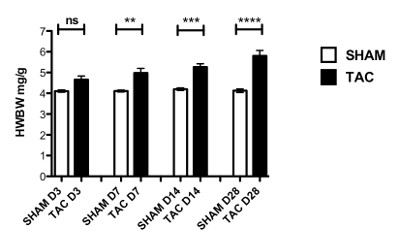
Figure 8: Validation of transverse aortic constriction.
The induction of cardiac hypertrophy by our minimally invasive transverse aortic constriction is demonstrated by significant increase in heart weight/body weight ratio in banded (black bars) as compared to sham operated (white bars) mice. The cardiac hypertrophy is already present at D7 after surgery and increases progressively over time up to D28 (n=6-10 per group. **P<0.01, ***P<0.001, ****P<0.0001). Data are presented as mean ± SEM (error bars). Please click here to view a larger version of this figure.
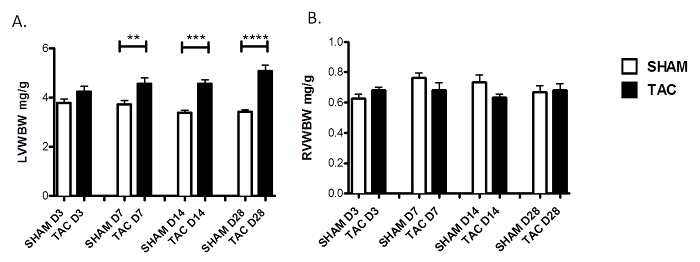
Figure 9: Left (A) and right (B) ventricle/ body weight ratio.
During the observation period, the left ventricle/body weight ratio increases while the right ventricle/body weight ratio remains similar in TAC (black bars) compared to sham-operated (white bars) animals. This confirms left ventricular hypertrophy without modification in the right ventricle, and strengthens the validation of our technique (n=6-10 per group. **P<0.01, ***P<0.001, ****P<0.0001).Data are presented as mean ± SEM (error bars). Please click here to view a larger version of this figure.
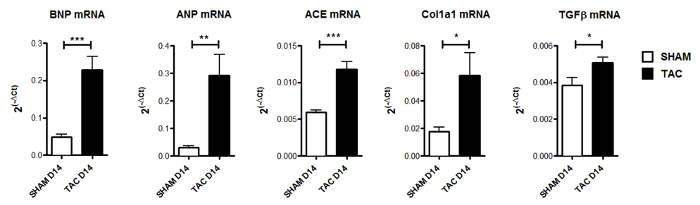
Figure 10: BNP-mRNA expression.
mRNA expression of brain natriuretic protein (BNP), atrial natriuretic protein (ANP), angiotensin converting enzyme (ACE), collagen 1a1 (Col1a1) and transforming growth factor ß (TGFß), positive controls for cardiac hypertrophy in aortic-banded (black bar) vs sham animals (white bar) (n=6 per group) at D14. Expression is calculated as 2(-ΔCt) where the calibrator is the mRNA level of the Gapdh reference gene. Data are presented as mean ± SEM (error bars). *P<0.05, **P<0.01, ***P<0.001 compared to sham group (t-test). Please click here to view a larger version of this figure.
Discussion
The aim of this protocol is to present a step-by-step illustration of the surgical technique for minimally invasive transverse aortic constriction in mice. Detailed technical description of transverse aortic constriction in mice has been reported by other authors2,8. However, these investigators perform surgery following intubation and ventilation of animals. The use of an additional step of intubation-ventilation increases the complexity and duration of the whole procedure and the global stress the animal is exposed to. For these reasons, the concept of minimally invasive transverse aortic constriction has received some attention. The minimally invasive transverse aortic constriction in mice is used to induce left ventricular hypertrophy and its progression to heart failure9,10,11. These studies focus on the pathways involved in the genesis of left ventricular hypertrophy and heart failure, but not on the description of the surgical technique9,10,11.
In this protocol, we report in details a simplified and reproducible technique of minimally invasive TAC in mice. A skilled surgeon can do the constriction operation in 20 minutes and the sham operation (without suture tying) in 15 minutes. During our initial technical proof, we found that the introduction of a key instrument, the ligation aid, allowed a very low operative mortality of 1.7%. This compares favorably to operative mortality of 4% reported by Rockman et. al.5, of 3.7% by Liao et al.13 and of 2.7% by Stansfield et al14. Further, the observation period up to 28 days, also shows a very low late post-operative mortality of 1.7%. Again, this compares well to the late mortality reported by Rockman et al (10%)5, Liao et al (19%)13 or Stansfield et al (2.6%)14.
The passage under the aortic arch is the most crucial step of the whole procedure. The reproducibility of this step was not described by Hu and co-workers who used a home-made wire with a snare at its end to pass under the aorta between the origin of the right innominate and left common carotid arteries9, nor by Tarnavski who positioned the curved forceps from the medial side under the ascending aorta to catch the 7/0 silk suture on the opposite side and move it underneath the aorta2. The ligation aid used in our technique allows a standardized and reproducible maneuver with low risk of aortic tear.
Another decisive step of the procedure is the tension applied to the tie over the 27-gauge needle to reduce efficiently and homogenously the lumen of the aortic arch. First, we use tying forceps, which help applying a uniform and reproducible tension on the suture around the aortic arch. The appropriate placement of the suture is verified during the harvest of the heart and aortic arch. Andersen and coworkers verified the appropriate placement of the band by evaluation of Doppler signals of the carotid arteries both before and after placement of the aortic band11. In their report, adequate banding was accepted when the Doppler velocity ratio doubled from right to left carotid arteries11. In our technique, we chose to measure the efficiency of TAC by the degree of induced left ventricular hypertrophy in banded compared to sham animals in order to validate the procedure, since it does not necessitate any increased duration of the procedure or supplementary anesthesia of the animals. In our technique, the degree of left ventricular hypertrophy and appropriate placement of banding are checked at the end of the experiment. The degree of left ventricular hypertrophy by our technique compares favorably with the results reported by other investigators at 3 weeks following TAC in mice15. In addition, the low variation of the ratio of heart to body weight observed in our banded animals attests the low fluctuation of the tension applied to the tie.
In conclusion, through avoidance of intubation-ventilation as presented in this protocol, our technique of minimally invasive TAC in mice provides a reliable and reproducible model. This model reduces the global strain put on the animals and is time- and cost-saving compared to TAC using intubation-ventilation of animals. The operative and late mortality rates of this procedure are very low and make this technique one of the methods of choice for induction of left ventricular hypertrophy in mice.
Disclosures
The authors have no conflict of interest to disclose.
Acknowledgements
This work was supported by a grant (N° 32016) of the Swiss Cardiovascular Foundation to RT.
Materials
| Name | Company | Catalog Number | Comments |
|---|---|---|---|
| Surgical microscope | Olympus | SZX2-TR30 | |
| Razor | Rowenta | Nomad TN3650FO | |
| Sutures: | |||
| Polypropylene 7/0 | Ethicon | BV-1X | |
| Polypropylene 6/0 | BBraun | C0862061 | |
| Silk 6/0 ligature | FST | 18020-60 | |
| Polypropylene 4/0 | Ethicon | 8683 | |
| Polypropylene 5/0 | Ethicon | Z303 | |
| Drugs: | |||
| Ketamin | Merial | Imalgène 1000, LBM154AD | |
| Xylazine | Bayer | Rompun 2%, KP09PPC | |
| Buprenorphine | Ceva | Vetergesic, 072013 | |
| Instruments: | |||
| Bone nippers | Fine Surgical Tools | 16101-10 | |
| Ligation aid | Fine Surgical Tools | 18062-12 | |
| Tying forceps | Fine Surgical Tools | 18026-10 | |
| Needle holder Crile-Wood | Fine Surgical Tools | 12003-15 | |
| Microsurgery forceps | Fine Surgical Tools | 11003-12 | |
| Microsurgery forceps | Fine Surgical Tools | 11002-12 | |
| Tissue forceps | Fine Surgical Tools | 11021-12 | |
| Microsurgery needle holder | Fine Surgical Tools | 12076-12 | |
| Microsurgery scissors | Fine Surgical Tools | 91501-09 | |
| Mayo scissors | Fine Surgical Tools | 14511-15 | |
| 11-blade knife | Fine Surgical Tools | 10011-00 | |
| RNA extraction and qPCR: | |||
| TriReagent | Euromedex | TR-118-200 | |
| Rneasy Mini kit | Qiagen | 74704 | |
| Qubit Fluorimetric RNA assay | Fisher Scientific | 10034622 | |
| RNA 6000 Nano kit | Agilent | 5067-1511 | |
| High Capacity cDNA kit | Fisher Scientific | 10400745 | |
| Taqman Master Mix | Fisher Scientific | 10157154 | |
| Taqman BNP primers | Fisher Scientific | Mm01255770_g1 | |
| Taqman ANP primers | Fisher Scientific | Mm01255747_g1 | |
| Taqman ACE primers | Fisher Scientific | Mm00802048_m1 | |
| Taqman Col1a1 primers | Fisher Scientific | Mm00801666_g1 | |
| Taqman TGFb primers | Fisher Scientific | Mm01178820_m1 | |
| Taqman Gapdh primers | Fisher Scientific | Mm99999915_g1 | |
| ABIPrism Thermocycler | Applied Biosystems | 7000 | |
| Software: | |||
| GraphPad Prism | GraphPad | Prism 7 | |
| Animal food | |||
| Complete diet for adult rats/mice | Safe | UB220610R |
References
- Molinari, F., Malara, N., Mollace, V., Rosano, G., Ferraro, E. Animal models of cardiac cachexia. Int. J. Cardiol. 219 (15), 105-110 (2016).
- Tarnavski, O. Mouse surgical models in cardiovascular research. Methods. Mol. Biol. 573, 115-137 (2009).
- Verma, S. K., Krishnamurthy, P., Kishore, R., et al. Transverse aortic constriction: a model to study heart failure in small animals. Manual of Research Techniques in Cardiovascular Medicine. Ardehali, H. , Wiley, J., & Sons. 164-169 (2014).
- Patten, R. D., Hall-Porter, M. R. Small animal models of heart failure. Development of novel therapies, past and present. Circ. Heart Fail. 2 (2), 138-144 (2009).
- Rockman, H. A., et al. Segregation of atrial-specific and inducible expression of an atrial natriuretic factor transgene in an in vivo murine model of cardiac hypertrophy. Proc. Natl. Acad. Sci. USA. 88 (18), Erratum in: Proc. Natl. Acad. Sci. USA Page 9907 8277-8281 (1991).
- Barrick, C. J., Rojas, M., Schoonhoven, R., Smyth, S. S., Threadgill, D. W. Cardiac response to pressure overload in 129S1/SvImJ and C57BL/6J mice: temporal- and background-dependent development of concentric left ventricular hypertrophy. Am. J. Physiol. Heart Circ. Physiol. 292 (5), 2119-2130 (2007).
- Deschepper, C. F., Olson, J. L., Otis, M., Gallo-Payet, N. Characterization of blood pressure and morphological traits in cardiovascular-related organs in 13 different inbred mouse strains. J. Appl. Physiol. 97 (1), 369-376 (2004).
- Almeida, A. C., van Oort, R. J., Wehrens, X. H. T. Transverse aortic constriction in mice. J. Vis. Exp. (38), April 21 (2010).
- Hu, P., Zhang, D., Swenson, L., Chakrabarti, G., Abel, E. D., Litwin, S. E. Minimally invasive aortic banding in mice: effects of altered cardiomyocyte insulin signaling during pressure overload. Am. J. Physiol. Heart Circ. Physiol. 285 (3), 1261-1269 (2003).
- Faerber, G., et al. Induction of heart failure by minimally invasive aortic constriction in mice: Reduced peroxisome proliferator-activated receptor ϒ coactivator levels and mitochondrial dysfunction. J. Thorac. Cardiovasc. Surg. 141 (2), 492-500 (2011).
- Andersen, N. M., Tang, R., Li, L., Javan, H., Zhang, X. Q., Selzman, C. H. IKK-β inhibition prevents adaptive left ventricular hypertrophy. J. Surg. Res. 178 (1), 105-109 (2012).
- Nemska, S., Monassier, L., Gassmann, M., Frossard, N., Tavakoli, R. Kinetic mRNA profiling in a rat model of left ventricular hypertrophy reveals early expression of chemokines and their receptors. PLoS ONE. 11 (8), 0161273(2016).
- Liao, Y., et al. Echocardiographic assessment of LV hypertrophy and function in aortic-banded mice: necropsy validation. Am. J. Physiol. Heart Circ. Physiol. 282 (5), 1703-1708 (2002).
- Stansfield, W. E., et al. Characterization of a model to independently study regression of ventricular hypertrophy. J. Surg. Res. 142 (2), 387-393 (2007).
- Beetz, N., et al. Ablation of biglycan attenuates cardiac hypertrophy and fibrosis after left ventricular pressure overload. J. Mol. Cell. Cardiol. 101, December 145-155 (2016).
Reprints and Permissions
