This protocol describes a novel method for investigating a form of chemical neurostimulation of wholemount rat retinas in vitro with the neurotransmitter glutamate. Chemical neurostimulation is a promising alternative to the conventional electrical neurostimulation of retinal neurons for treating irreversible blindness caused by photoreceptor degenerative diseases.
A subscription to JoVE is required to view this content. Sign in or start your free trial.
Method Article
Methodology for Biomimetic Chemical Neuromodulation of Rat Retinas with the Neurotransmitter Glutamate In Vitro
In This Article
Summary
Abstract
Photoreceptor degenerative diseases cause irreparable blindness through the progressive loss of photoreceptor cells in the retina. Retinal prostheses are an emerging treatment for photoreceptor degenerative diseases that seek to restore vision by artificially stimulating the surviving retinal neurons in the hope of eliciting comprehensible visual perception in patients. Current retinal prostheses have demonstrated success in restoring limited vision to patients using an array of electrodes to electrically stimulate the retina but face substantial physical barriers in restoring high acuity, natural vision to patients. Chemical neurostimulation using native neurotransmitters is a biomimetic alternative to electrical stimulation and could bypass the fundamental limitations associated with retinal prostheses using electrical neurostimulation. Specifically, chemical neurostimulation has the potential to restore more natural vision with comparable or better visual acuities to patients by injecting very small quantities of neurotransmitters, the same natural agents of communication used by retinal chemical synapses, at much finer resolution than current electrical prostheses. However, as a relatively unexplored stimulation paradigm, there is no established protocol for achieving chemical stimulation of the retina in vitro. The purpose of this work is to provide a detailed framework for accomplishing chemical stimulation of the retina for investigators who wish to study the potential of chemical neuromodulation of the retina or similar neural tissues in vitro. In this work, we describe the experimental setup and methodology for eliciting retinal ganglion cell (RGC) spike responses similar to visual light responses in wild-type and photoreceptor-degenerated wholemount rat retinas by injecting controlled volumes of the neurotransmitter glutamate into the subretinal space using glass micropipettes and a custom multiport microfluidic device. This methodology and protocol are general enough to be adapted for neuromodulation using other neurotransmitters or even other neural tissues.
Introduction
Photoreceptor degenerative diseases, such as retinitis pigmentosa and age-related macular degeneration, are leading inheritable causes of vision loss and are currently incurable1,2. Although these diseases arise from a variety of specific genetic mutations, photoreceptor degenerative diseases are characterized as a group by the progressive loss of the photoreceptor cells in the retina, which eventually causes blindness. The loss of photoreceptors triggers widespread remodeling throughout the retina but surviving retinal neurons, including the bipolar cells and RGCs, remain intact and relatively functional even in advanced stages of photoreceptor degeneration3,4,5,6,7.
The mechanisms and pathologies of these diseases have been well characterized3,4,5,6,7 but an effective treatment remains elusive. Over the past three decades, researchers worldwide have investigated a variety of therapeutic treatments for restoring vision to those affected with photoreceptor degenerative diseases including gene therapy8, stem cell treatment9, retinal transplantation10, and artificial stimulation11,12 of the surviving retinal neurons. Of these, the most clinically available are retinal prostheses, which are artificial neurostimulation devices that have traditionally utilized an array of electrodes to electrically stimulate either the bipolar cells or RGCs in specific patterns with the goal of creating artificial visual perceptions in patients11. Current generation electrical prostheses, such as the Argus II13 and Alpha-IMS14 devices, have achieved clinical approval and preliminary studies have indicated that they can improve the quality of life for patients by restoring a measure of vision using both epiretinal (front of the retina) and subretinal (back of the retina) implanted devices15,16. Research groups around the world are working on advancing retinal prostheses beyond the successes of these first-generation devices17,18,19,20 but have faced difficulties designing an electrical prosthesis capable of restoring high acuity vision below the legal blindness level to patients. Recent studies have shown that achieving higher spatial resolution than that enabled by the current generation electrical-based prostheses is challenging because of the charge injection limit, which necessitates the use of large electrodes to safely stimulate retinal neurons at the cost of spatial resolution, i.e. visual acuity11,21. Moreover, electrical stimulation is further limited because it typically stimulates all nearby cells and therefore elicits unnatural and confusing perceptions in patients, largely because it is an inherently unnatural stimulation paradigm21. Nevertheless, the early successes of electrical stimulation have demonstrated that artificial neurostimulation can be an effective treatment for photoreceptor degenerative diseases. This leads one to hypothesize that an even more effective treatment might be achievable by stimulating the retina with neurotransmitter chemicals, the natural agents of communication at chemical synapses. The purpose of the method presented in this paper is to explore the therapeutic feasibility of chemical stimulation, which seeks to mimic the natural system of synaptic communication between retinal neurons, as a biomimetic alternative to electrical stimulation for a retinal prosthesis.
Translation of the concept of therapeutic chemical stimulation to a chemical retinal prosthesis relies on chemically activating target retinal neurons with small quantities of native neurotransmitters, such as glutamate, released through a microfluidic device comprising a large array of microports in response to visual stimulation. In this way, a chemical retinal prosthesis would essentially be a biomimetic artificial photoreceptor layer that translates photons naturally reaching the retina to chemical signals. Since these chemical signals use the same neurotransmitters utilized in normal retinal signaling and stimulate the surviving retinal neurons of a degenerated retina through the same synaptic pathways used by normal vision pathways, the resulting visual perception achieved through a chemical retinal prosthesis could be more natural and comprehensible compared to one evoked through an electrical prosthesis. Moreover, since the microports through which neurotransmitters are released can be made extremely small and arrayed in high density, unlike the electrodes, a potential chemical prosthetic might be able to achieve more focal stimulation and higher spatial resolution than an electrical prosthesis. Thus, based on these potential advantages, a chemical retinal prosthesis offers a highly promising alternative to electrical prostheses.
Chemical stimulation of the retina, however, has been relatively little explored until recently. While electrical stimulation of the retina has been well characterized over decades of work through in vitro22,23, in vivo23,24, and clinical studies13,14, studies on chemical stimulation have been limited exclusively to a few in vitro works25,26,27,28. Iezzi and Finlayson26 and Inayat et al.27 demonstrated epiretinal chemical stimulation of the retina in vitro using a single electrode and a multielectrode array (MEA), respectively, to record the glutamate evoked responses of retinal neurons. More recently, Rountree et al.28 demonstrated the differential stimulation of the OFF and ON retinal pathways using glutamate from the subretinal side and an MEA to record the neuronal responses from multiple sites on the retina. Although these works have preliminarily established the feasibility of chemical stimulation, further studies are essential to investigate many aspects of this approach beyond those addressed so far25,26,27,28, and fine-tune the therapeutic stimulation parameters in both in vitro and in vivo animal models before translating this concept to a chemical retinal prosthesis as discussed above. However, currently there is no established methodology for accomplishing chemical stimulation of the retina in the literature and the methods used in the previous works have not been described in such detail as would be essential for replicative studies. Therefore, the rationale for this methods paper is to provide a well-defined framework for conducting in vitro chemical stimulation of the retina for those investigators interested in either replicating our previous studies27,28 or further advancing this nascent concept of chemical neurostimulation.
Here we demonstrate a method for conducting in vitro chemical stimulation of retinal neurons in wholemount retinas of wild-type rats and a photoreceptor degenerated rat model that closely mimics the progression of photoreceptor degenerative diseases in humans. The rationale behind developing this stimulation method in in vitro models is to evaluate the therapeutic ranges of various stimulation parameters and study neural response characteristics that would be impossible or difficult to observe in in vivo models, especially during the initial studies focused on evaluating the feasibility of this approach. In this procedure, we show both single-site and simultaneous multi-site chemical stimulations of retinas by delivering small quantities of 1 mM glutamate near target retinal neurons via commercially available single-port glass micropipettes and a custom micromachined multi-port microfluidic device, respectively. While both single-site and multi-site stimulations accomplish the basic objective of investigating the therapeutic feasibility of chemical neuromodulation, each serves a distinct purpose with a unique advantage. The single-site stimulation, which may be accomplished with commercially available pre-pulled glass micropipettes, can be used to inject chemicals directly into the subsurface of the retina at a single site and serves to investigate if observable RGC spike rate responses that are similar to visually evoked light responses can be elicited focally under the injection site. On the other hand, multi-site stimulation, which requires a specially fabricated multiport microfluidic device, can be used to inject chemicals spatially at multiple sites over the surface of the retina and serves to investigate how well glutamate-evoked RCG response patterns correspond to the glutamate injection patterns in pattern stimulation studies.
Access restricted. Please log in or start a trial to view this content.
Protocol
All animal experiments were conducted in accordance with the guidelines outlined by the National Research Council's Guide for the Care and Use of Laboratory Animals. Animal handling and euthanasia protocols were reviewed and approved by the Institutional Animal Care and Use Committee (IACUC) of the University of Illinois at Chicago.
1. Animal Models
- Wild-type Long-Evans rats
- Procure a 24 - 32 day old wild-type Long Evans Hooded rat of either sex raised with a standard 12 h day/night rhythm.
- Dark adapt the rat by placing it in a completely dark room for 1 h prior to beginning experiment.
- S334ter-3 rats
- Cross the transgenic albino homozygous S334ter-3 rat line (either sex), expressing two copies of the mutant rhodopsin gene, with a pigmented wild-type Long-Evans rat to produce pigmented heterozygous S334ter-3 rats that exhibit photoreceptor degeneration similar in progression to human retinitis pigmentosa29,30.
- Raise heterozygous offspring with standard 12 h day/night rhythm and use rats of either sex for experiments of the following ages corresponding to the following photoreceptor degeneration stages: Early stage degeneration: 14 - 20 days old; Middle stage degeneration: 21 - 27 days old; Late stage degeneration: 28 - 35 days old; Completely blind: >50 days old.
- Dark adapt the rat by placing it in a completely dark room for 1 h prior to beginning experiment.
2. Preparation of Ames' Medium Solution and Perfusion System
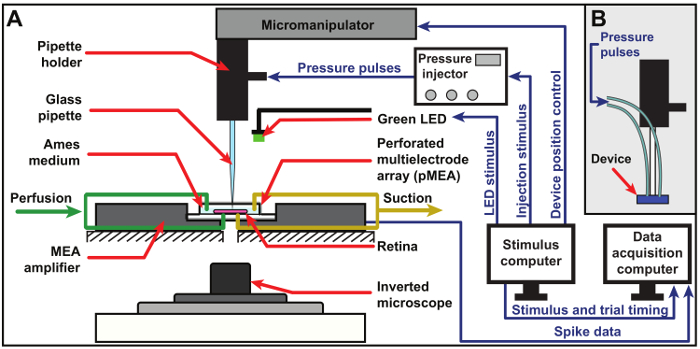
Figure 1: Schematic of experimental setup. Schematic of the experimental setup for chemical stimulation using a glass micropipette (A) and a custom multiport microfluidic device (B). The retina is placed on a pMEA and continuously perfused with fresh, oxygenated Ames medium solution from both the top and bottom through the pMEA perforations. Neural response signals picked up by the electrodes of the pMEA are fed through the MEA amplifier into a data acquisition computer. Visual and chemical stimulation are accomplished using a green LED and an 8-channel pressure injector, respectively, and both stimuli are triggered by a dedicated stimulus computer, which is also used to position the pipette via a precision 3-axis micromanipulator. An inverted microscope is used to observe the retina during an experiment. Please click here to view a larger version of this figure.
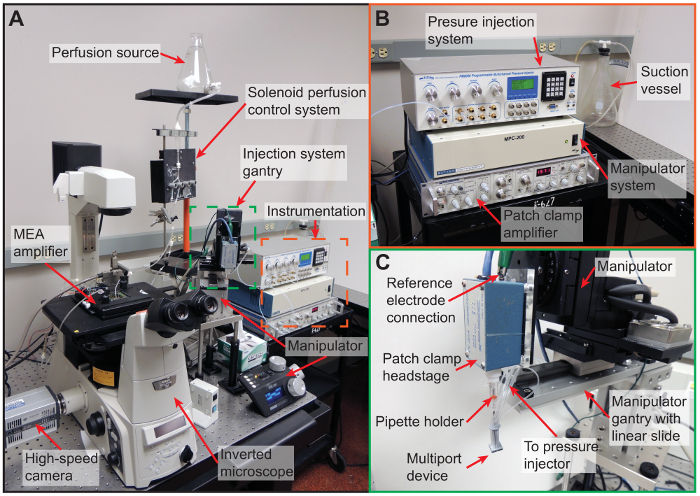
Figure 2: Experimental setup. (A) Photograph of the complete experimental setup showing the relative positions of all components. The MEA amplifier system is placed on top of an inverted microscope, which is used to visually inspect the retina and digitally image the device-retina interface by means of the attached high-speed camera during the experiment. Top and bottom perfusion are independently controlled using a solenoid-controlled perfusion system. Injection, position control, and impedance measurements are accomplished using a pressure injector, micromanipulator, and patch clamp amplifier (orange box; shown in more detail in B), respectively. The micropipette or device is inserted into a patch clamp headstage for impedance measurements and mounted on a gantry (indicated by green box; shown in more detail in C) to facilitate positioning using a micromanipulator. (B) A close-up of the measurement and control instruments used in the experiment: the 8-channel pressure injector, micromanipulator control system, patch clamp amplifier for impedance measurement, and the suction vessel for perfusion elimination. (C) A close-up of the injection system gantry showing a multiport device interfaced with the pipette holder, patch clamp headstage, and micromanipulator. Please click here to view a larger version of this figure.
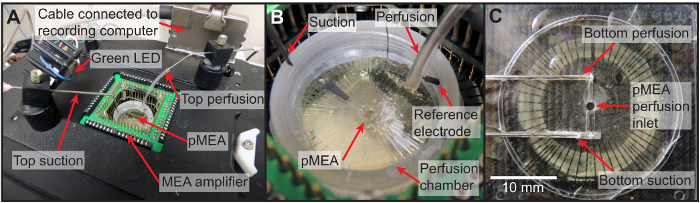
Figure 3: Perfusion setup. (A) Photograph of the top of the MEA amplifier showing the location of the top perfusion and suction as well as the green LED used for visual light stimulation. (B) A close-up of the pMEA perfusion chamber illustrating the precise locations of the top perfusion and suction, the pMEA, and the reference electrode used for impedance measurement. (C) A photomicrograph of the bottom perfusion plate. Please click here to view a larger version of this figure.
NOTE: See Figure 1, Figure 2, and Figure 3
- Measure out 900 mL of de-ionized water at room temperature (~21 °C) and place in 1 L container.
- Perfuse the water with 100% CO2 using a bubbling mechanism.
- Add 8.8 g of powdered Ames' medium to water in 1 L container.
- Rinse Ames' medium container with a few mL of de-ionized water to remove all traces of powdered Ames' medium and add to 1 L container.
- Add 25.3 mL of sodium bicarbonate solution (7.5% w/v31) to 1 L container.
- Add additional water to bring the solution to a final volume of 1 L.
- Continue perfusing the water with CO2 for approximately 5 min.
- Stop CO2 perfusion and begin perfusing solution with a medical-grade gas mixture of 95% O2 and 5% CO2 for at least 30 min or until the pH stabilizes at 7.4.
NOTE: For the purposes of this protocol, the Ames medium is kept at room temperature (~21 °C) throughout the experiment to prevent CO2 or O2 from outgassing, which can occlude the perfusion lines with air bubbles. - Clean the bottom and top perfusion tubes by filling with 70% ethanol and then wash both lines 3 times with de-ionized water. Fill the bottom line with de-ionized water and the top line with air. Close both lines using a solenoid valve system.
- Attach the main perfusion tube to the luer connection of the 1 L Ames medium container.
- Open the top perfusion valve and leave it open until solution exits from the top perfusion outlet. Turn off the top perfusion valve.
- Open the bottom perfusion outlet and leave it on until all bubbles exit through the bottom perfusion outlet.
- Attach an empty suction vessel to the main suction line and turn on the suction source. Ensure that both the top and bottom suction inlets are open and working.
- Ensure that all computer displays are covered by red filter screens to avoid unintentional visual stimulation of the retina.
3. Wholemount Retinal Preparation
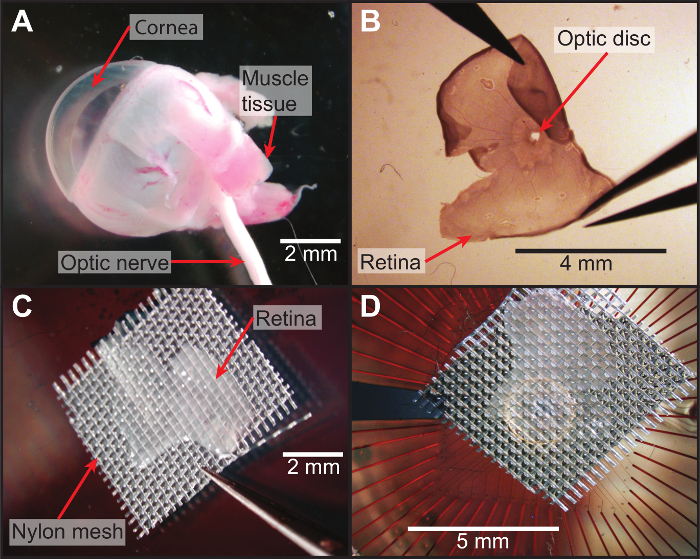
Figure 4: Dissection and wholemount preparation of retina. (A) Photograph of an intact eyecup taken from a photoreceptor-degenerated animal. (B) Photomicrograph of the retina with longitudinal cuts to flatten it out. (C) After flattening the retina, it is placed onto a mesh grid with the photoreceptor side contacting the mesh and flattened in air (outside of perfusion medium) to ensure there are no folds or curled edges. (D) The mesh and retina are quickly transferred to the pMEA with the ganglion cell side contacting the electrodes and immediately perfused with oxygenated Ames medium. Please click here to view a larger version of this figure.
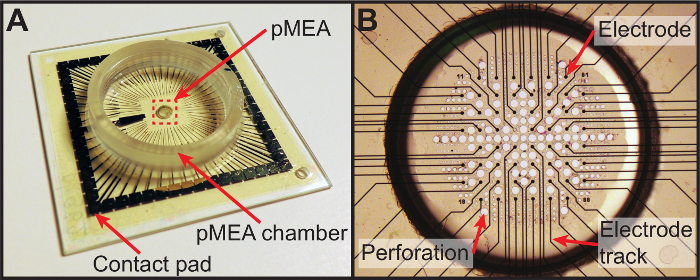
Figure 5: Perforated multielectrode array. (A) Photograph of the perforated multielectrode array used in the protocol. The retina is placed on the electrode array (indicated by the red rectangle, which is shown in greater detail in B) within the pMEA chamber to allow continual perfusion with oxygenated Ames medium. (B) A photomicrograph of the electrode array itself illustrating the arrangement of perforations between electrodes. Please click here to view a larger version of this figure.
NOTE: See Figure 4 and Figure 5
- Using a handheld red LED flashlight to provide dim red illumination, euthanize animal via carbon dioxide asphyxiation followed by cervical dislocation or another chosen method, according to IACUC protocols.
- Enucleate both eyes using a jeweler's #5 forceps and place enucleated eyes in a 60 mm diameter petri dish with approximately 3 - 4 mL of fresh, oxygenated Ames medium solution.
- While observing the eye through a dissection stereomicroscope with top and bottom illuminators covered with red filter screen, make a small incision in the corneal face using a scalpel or a pair of sharp scissors.
- Cut from this small incision to edge of the cornea then extend the cut in a circumferential section around entire edge of cornea. Remove the now detached cornea along with the lens, translucent aqueous and vitreous humors.
- While gently holding the eyecup with one pair of forceps, carefully make two small incisions on opposite sides of the eyecup. Next, use two pairs of forceps to gently pull apart the eyecup at each of the incisions and separate the retina from the sclera. Slowly lift the entire retina from the sclera and eyecup. Cut the optic nerve, if it is still attached.
- Make longitudinal cuts in the retina to obtain half or quarter sections using scissors, and then gently spread one retinal section onto a nylon mesh (100 µm thread diameter with 350 µm opening) with the ganglion cells (concave side of retina) facing away from the mesh.
- Place the mesh and retina onto a perforated multielectrode array (pMEA) with the ganglion cells in contact with the pMEA surface. Then gently place a weighted slice grid on top of the mesh to hold the retina in place.
4. MEA and Data Acquisition Setup
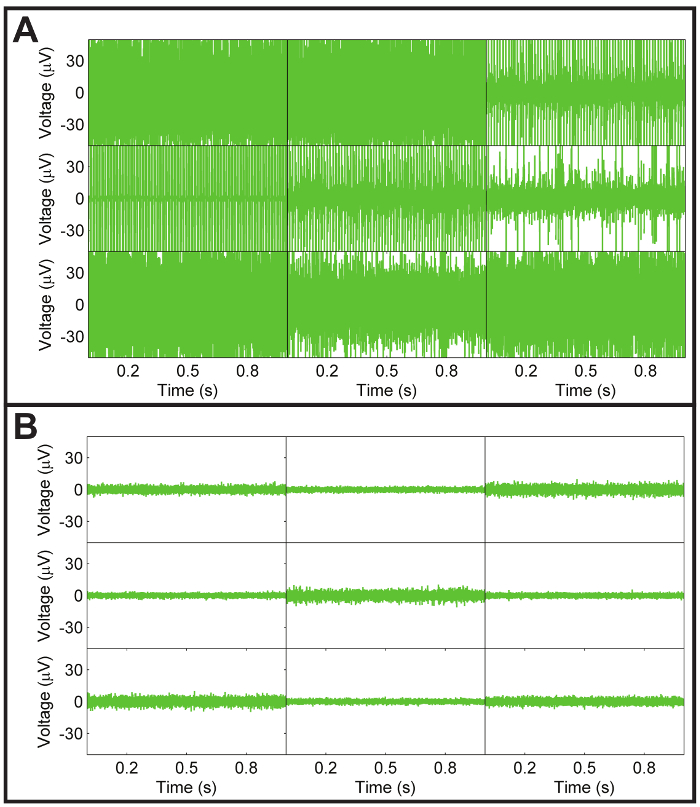
Figure 6: Noise levels of pMEA. (A) Representative recording of a subset of pMEA electrodes exhibiting high persistent noise. This noise is usually due to a lack of proper contact between the pMEA contact pads and the pins of the MEA amplifier as a result of normal wear of the thin perforated polyimide layer over the pMEA, especially at the contact pads. The other possible source of noise is typically solution leaked onto the pMEA amplifier contact pads. Persistent noise due to poor pin contact and/or leaked solution on the contact pads can usually be corrected by shifting the position of the pMEA within the amplifier to obtain better contact and cleaning and drying the pads, respectively. If noise cannot be eliminated by cleaning or shifting the pMEA position, the pMEA may need to be replaced entirely. (B) Representative recording of noise levels from a subset of pMEA electrodes from a clean pMEA with good contact between the pMEA and amplifier. Typically, the average noise level is within ±16 µV. Please click here to view a larger version of this figure.
NOTE: See Figure 6
- Under dim red illumination, place pMEA in MEA amplifier and close amplifier latches.
- If reference marks are not already present on the pMEA chamber ring, etch two 'X'-shaped marks spaced approximately 5 mm apart in an area easily visible from above with the boom-stand mounted microscope.
- Position the top perfusion outlet inside the pMEA chamber and turn on the top perfusion valve to achieve a perfusion rate of approximately 3 mL per minute. Position the top suction inlet at the desired perfusate level (~5 mm deep) and ensure that it is working.
- Open the data acquisition software on the data acquisition computer and click the 'play' button to start receiving data. Ensure that all pMEA channels are noise-free and recording neural signals. If not, reposition the pMEA within the amplifier to obtain better contact between the amplifier pins and the pMEA contacts (see Figure 5).
- Ensure that the bottom perfusion line is clear of any air bubbles and, if it is bubble-free, turn on the bottom perfusion valve to ensure the bottom of the retina is supplied with oxygen and nutrients.
- Turn on the high-speed camera attached to the inverted optical microscope (10X magnification with N.A. of 0.45) and open imaging software. Ensure that the inverted microscope illuminator is covered by a red filter sheet to emit only red light and then set the illuminator to a low light level to avoid photobleaching the retina.
- By looking at a live digital image of the inverted microscope field of view on a monitor, observe the bottom surface of the pMEA for evidence that solution is flowing through the bottom perfusion plate.
- Once bottom perfusion is confirmed to be flowing, slowly ramp up the bottom suction by manually turning the vacuum pressure knob on the vacuum waste kit while observing the retina through the inverted microscope. Cease increasing the suction once an observable suction force acts on the retina. Be careful to avoid too much or too little suction.
- After ensuring the bottom suction holds the retina in place, take the weighted slice grid off the retina using forceps and gently remove the nylon mesh by peeling one corner carefully from the retina. It should separate easily leaving the retina firmly attached to the bottom of the pMEA with the subretinal surface exposed on top. Keep perfusion running for approximately 30 min to allow retina to stabilize from surgical trauma.
5. Glutamate Stimulation Preparation
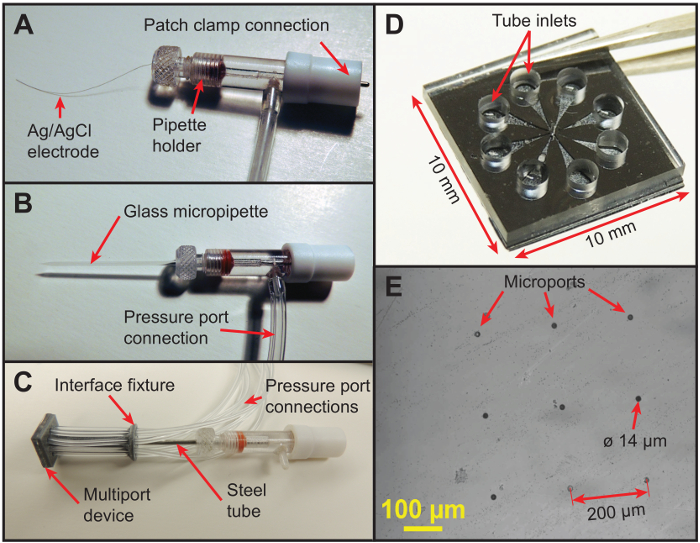
Figure 7: Glass micropipette and multiport microfluidic device. (A) A pipette holder before inserting a micropipette or device. The silver/silver chloride electrode (50 µm diameter) is electrically coupled to the adapter on the end to interface with the patch clamp headstage. (B) A photograph of the glass micropipette interfaced with the pipette holder showing the location of the pressure port used to initiate pneumatic injections. (C) A custom multiport microfluidic device (1 cm 1 cm 0.134 cm) attached to a custom 3D-printed fixture and interfaced with the pipette holder through a stainless-steel tube. The device, which was fabricated in two layers, has eight microports (diameter 14 µm) in the bottom layer (340 µm thick) and eight on-chip reservoirs (diameter 1.6 mm) for storing glutamate in the top layer (1 mm thick). Each of the eight microports in the bottom layer of the device is independently connected to an on-chip reservoir in the top layer via an in-plane microchannel, and each on-chip reservoir in turn is connected to a pressure port of the 8-channel pressure injector via a flexible tube to allow independent actuation of the microports for patterned multisite injections. (D) A close-up of the multiport device held by tweezers before attaching the tubing interface fixture showing the arrangement of the eight independently-addressable on-chip reservoirs and tubing inlets. (E) A photomicrograph of the bottom surface of the device showing the eight 14 µm-diameter microports arranged in a 3 x 3 configuration with 200 µm spacing to align with the electrodes of the pMEA. The eight outside microports are utilized for multisite injections, while the central port was used strictly for alignment during fabrication of the device. Please click here to view a larger version of this figure.
NOTE: See Figure 7.
- Prepare glutamate solution by mixing stock glutamate solutionwith oxygenated Ames medium solution to obtain a 0.5 mL sample at a working concentration of 1 mM glutamate.
- Carefully insert a pre-pulled 10 µm-diameter micropipette or the stainless steel rod connected to the multiport microfluidic device into a standard pipette holder containing a 50 µm-diameter silver/silver chloride wire electrode.
NOTE: If impedance detection is not available, the silver/silver chloride wire electrode may be omitted. - Interface the pipette holder with the patch-clamp headstage and connect the pressure port luer connection of the pipette holder to channel 1 of the pressure injection system, if utilizing a glass micropipette, or connect the pressure port luer connections of each of the 8 injection ports with channels 1 - 8 of the pressure injection system, if using the multiport device.
- Manually turn on the pressure injection system and turn on channel 1 (or channels 1 - 8, as applicable). Ensure that the system is vented to atmosphere and set the injection pressure to 0.1 psi.
- Turn on micromanipulator and calibrate it by pressing the 'Calibrate' button on the manipulator controller. Position the micromanipulator so that the micropipette tip (or the bottom of the device, as applicable) is approximately 30 mm above the MEA amplifier.
- Fill a small petri dish with glutamate solution (1 mM glutamate in standard Ames medium) and place it underneath the micromanipulator. Lower micropipette tip (or the device) into the solution and fill by pressing the 'Fill' button on the pressure injection system (suction pressure of -13 in H2O) until there is approximately 20 mm of solution visible in the glass micropipette or the multiport device tubing.
- If using the multiport device, turn channel 1 of the pressure injector off and repeat the protocol for channels 2 - 8. Lift the micropipette tip or device out of solution, remove the petri dish, and position the micromanipulator above the pMEA chamber.
- Using a boom-stand-mounted stereomicroscope, align the micropipette tip or the corners of the device with the reference marks etched into the pMEA chamber ring. Store the manipulator positions into the control software using the 'Store Reference A' and 'Store Reference B' buttons (or simply note the manipulator coordinates manually) to map the coordinate system of the manipulator with the pMEA electrodes.
- Using the manipulator control software, select a target pMEA electrode with robust spontaneous activity and click the 'Move to Channel' button to align the glass micropipettewith the target electrode. If using the multiport device, align the device microports with target pMEA electrodes with robust spontaneous activity using the same process.
6. Interface with Retina
- If impedance measurement is available, turn on patch clamp amplifier and initiate the impedance visualization software by clicking the 'Start' button to visualize the impedance of the silver/silver chloride electrode inside the pipette holder. While observing the real-time impedance signals, slowly lower the micropipette or device until it contacts the retinal surface as indicated by a rapid increase in the impedance signal (see Figure 8). Save or make note of the position of the retinal surface.
- If impedance measurement is unavailable, detect contact with the retinal surface through visual observation, though this will be less precise. Lower the pipette or device until it visibly contacts the top surface of the Ames medium solution in the MEA chamber.
- Then, while observing the top of the retina with an inverted microscope, slowly lower the pipette or device until the top surface of the retina is visibly distorted, which indicates that contact has been made with the retinal surface. Save or make note of the position of the retinal surface.
- For subsurface stimulation, lower the pipette a further 40 µm (for S334ter-3 retinas) or 70 µm (for wild-type retinas).
- Perform a few short duration (10 - 30 ms) injections using the pressure injection (0.1 psi) system to determine if the cells near the micropipette tip or device microports are receptive to glutamate stimulation by observing the neural signals with data acquisition software.
NOTE: Successful injections will elicit a clearly visible spike rate burst or spike inhibition (see Figure 9). If no response is observed, reposition the micropipette or device at a different electrode.
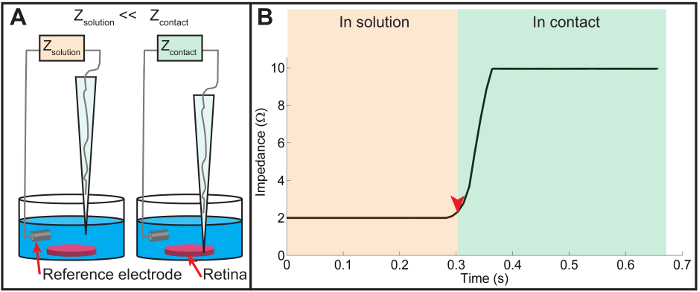
Figure 8: Impedance measurement. (A) A schematic of the impedance measurement technique. Using the patch clamp amplifier, the impedance of the micropipette is continuously monitored as it is slowly lowered towards the retinal surface. When the micropipette is above the retina, the relatively high ionic conductivity of Ames medium results in a low impedance reading. As the micropipette makes contact with the retinal surface, the ionic conductivity through the silver/silver chloride wire is reduced, causing a rapid increase in measured impedance. (B) A plot displaying the impedance change recorded just before and after the contact of the pipette tip with the retinal surface. The measured impedance is relatively low when the micropipette tip is in solution just prior to contact (indicated by the orange region on the left). Once contact is made (indicated by the red arrowhead and the green region on right), the impedance rapidly increases due to reduced ionic conductivity upon contact with the retinal tissue. In practice, the retinal surface is registered as the height corresponding to the onset of the steep rise of the measured impedance (the location of the red arrowhead). Please click here to view a larger version of this figure.
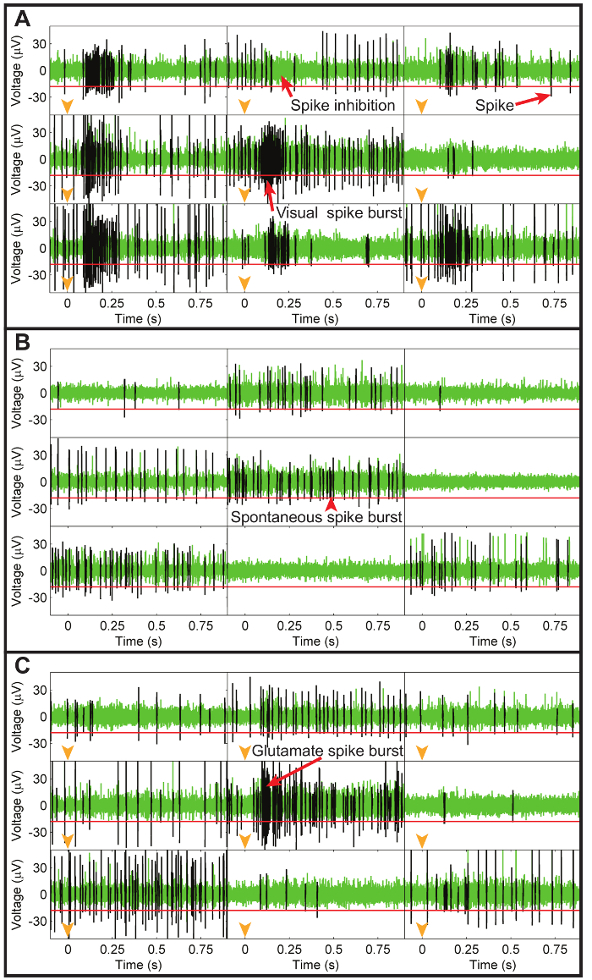
Figure 9: Electrode recordings of neural activity during visual, spontaneous, and glutamate injection recordings. (A) Representative recordings from nine pMEA electrodes showing the high-pass filtered electrode data during visual light stimulation with a green LED where each rectangle shows the neural data from a unique electrode. Each electrode recording illustrates data collected in the first second after turning on the green LED (timing shown with orange arrowheads in each plot) with a common voltage scale shown in the left y-axes. Spikes were identified using a threshold voltage of -18 µV (horizontal red line in each electrode plot) and are represented by the black traces over the green electrode data. Visual stimulation caused a burst of spikes (excitation) in all electrodes except the top center one, which possessed an inhibitory response to light. (B) A similar plot for the same electrodes showing spontaneous neural activity without visual or injection stimulation. Although smaller bursts were present, the patterns of spikes were very different from those recorded in response to visual stimulation. (C) Representative recordings from the same subset of electrodes recorded immediately after a glutamate injection at the central electrode (timing indicated by orange arrowheads in each plot). The injected glutamate elicited a burst of spikes in the central electrode that was very similar to the visually-evoked spike bursts. All other electrodes were unaffected by the glutamate injection, which demonstrates the fine spatial resolution of the chemical stimulation technique. Please click here to view a larger version of this figure.
7. Initiate Retinal Recording and Stimulus Program
- Orient the green LED toward the top surface of the retina. Begin recording using the data acquisition software on the dedicated recording computer by typing the filename and clicking the "record" button.
- Once recording has started, open the stimulus control program and load the default stimulus file by clicking the "Read Stimulus File" button. Next, click on the "Run Stimulus File" button to initiate the default stimulus file consisting of the stimuli and data acquisition protocol described in the note below.
NOTE: (i) 30 trials of 2 s ON and 2 s OFF full field flash (5 lm/m2 intensity) using the green LED. (ii) 120 s of data without using the green LED to record the spontaneous activity of the retina over a similar timescale. (iii) 1 or more sets of glutamate injections consisting of 30 trials of glutamate injections at 0.1 psi with 10 - 30 ms injection times (approximately 100 - 300 pL per injection) and 3 s interpulse durations. In the case of multi-site injections, select 2 or more ports to inject simultaneously. (iv) 90 s of spontaneous activity. - Once the stimulus file has been completed, stop the recording (by pressing the "Stop" button) to save the file for future spike sorting and data analysis (see Figure 10 for example).
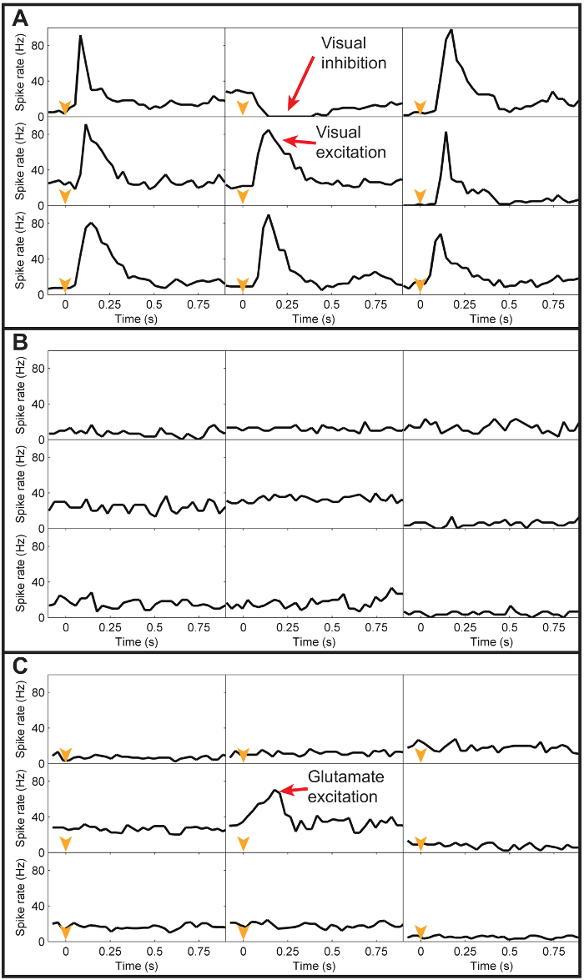
Figure 10: Peristimulus histograms of visual, spontaneous, and glutamate responses. (A) Representative peristimulus histograms (30 ms binwidth) of the spike data from the subset of electrodes in Figure 9A, averaged across 20 trials of visual light stimulation. A common spike rate scale was applied to all electrodes and is shown on the left y-axes. The black line in each electrode plot represents the average spike rate for all spikes recorded during the first second after turning the green LED on. As can be seen, visual stimulation caused a transient excitatory spike rate response at all electrodes except the top center electrode, which had a transient inhibitory response to light. (B) The average spontaneous spike rate responses recorded at the same electrodes without any visual or chemical stimulation. Without stimulation, the spike rates for each electrode are relatively constant. (C) The average spike rate responses recorded at the same electrodes in response to a glutamate injection at a location above the central electrode. The only transient response evident is the excitatory response at the electrode directly under the injection site. Please click here to view a larger version of this figure.
Access restricted. Please log in or start a trial to view this content.
Results
This protocol can be used to chemically stimulate both normal, wild-type retinas as well as photoreceptor degenerated retinas, despite the substantial cellular remodeling caused by the loss of the photoreceptors. Before beginning experiments with either photoreceptor degenerated or wild-type retinas, the recording and stimulation equipment (Figure 1 and Figure 2) need to be readied and the pMEA (Figure 5
Access restricted. Please log in or start a trial to view this content.
Discussion
The method presented here demonstrates a unique neural stimulation paradigm, wherein retinal neurons are chemically stimulated by injecting native neurotransmitter chemicals into the subsurface of the retina in vitro. This chemical stimulation technique offers several benefits over the conventional electrical stimulation technique, including selectivity and high focal specificity of target neurons. The protocol above details how small volume pneumatic injections of the neurotransmitter glutamate delivered near t...
Access restricted. Please log in or start a trial to view this content.
Disclosures
The authors have nothing to disclose.
Acknowledgements
The work presented in the paper was supported by the National Science Foundation, Emerging Frontiers in Research and Innovation (NSF-EFRI) program grant number 0938072. The contents of this paper are solely the responsibility of the authors and do not necessarily represent the official views of the NSF. The authors also wish to thank Dr. Samsoon Inayat for his work designing and testing the initial experimental setup for chemical stimulation and Mr. Ashwin Raghunathan for his work designing, fabricating, and evaluating the multiport microfluidic device used in this study.
Access restricted. Please log in or start a trial to view this content.
Materials
| Name | Company | Catalog Number | Comments |
|---|---|---|---|
| Microelectrode array, perforated layout | Multi Channel Systems, GmbH | 60pMEA200/30iR-Ti-pr | http://www.multichannelsystems.com/products/microelectrode-arrays/60pmea20030ir-ti |
| MEA amplifier | Multi Channel Systems, GmbH | MEA1060-Inv | http://www.multichannelsystems.com/products/mea1060-inv |
| Bottom perfusion groundplate for pMEA | Multi Channel Systems, GmbH | MEA1060-Inv-(BC)-PGP | http://www.multichannelsystems.com/products/mea1060-inv-bc-pgp |
| 3-axis Motorized Micromanipulator | Sutter Instruments, Novato, CA | MP-285 | https://www.sutter.com/MICROMANIPULATION/mp285.html |
| Micromanipulator Control System | Sutter Instruments, Novato, CA | MPC-200 | https://www.sutter.com/MICROMANIPULATION/mpc200.html |
| Gantry style micromanipulator stand with linear slide | Sutter Instruments, Novato, CA | MT-75/LS | https://www.sutter.com/STAGES/mt75.html |
| 8-channel Programmable Multichannel Pressure Injector | OEM: MicroData Instrument, S. Plainfield, NJ Vendor: Harvard Apparatus UK | PM-8000 or PM-8 | OEM: http://www.microdatamdi.com/pm8000.htm Vendor: https://www.harvardapparatus.co.uk/webapp/wcs/stores/servlet/product_11555_10001_39808_-1 _HAUK_ProductDetail |
| Axopatch 200A Integrating Patch Clamp Amplifier | Molecular Devices, Sunnyvale, CA | Axopatch 200A | Axopatch 200A has been replaced with a newer model Axopatch 200B: https://www.moleculardevices.com/systems/axon-conventional-patch-clamp/axopatch-200b-amplifier |
| Patch clamp headstage | Molecular Devices, Sunnyvale, CA | CV 201A | http://mdc.custhelp.com/app/answers/detail/a_id/16554/~/axopatch-200a%3A-selection-cv-headstage |
| Vacuum waste kit | ALA Scientific Instruments, Farmingdale, NY | VMK | http://alascience.com/product/vacuum-waste-kit/ |
| Pipette holder | Warner Instruments, Hamden, CT | QSW-A10P | https://www.warneronline.com/product_info.cfm?id=915 |
| Pre-pulled 10 μm tip diameter glass micropipettes | World Precision Instruments, Sarasota, FL | TIP10TW1 | https://www.wpiinc.com/products/laboratory-supplies/make-selection-pre-pulled-glass-pipettes-plain/ |
| Zoom stereomicroscope | Nikon, Tokyo, Japan | SMZ-745T | https://www.nikoninstruments.com/Products/Stereomicroscopes-and-Macroscopes/Stereomicroscopes/SMZ745 |
| Microscope boom stand with dual linear ball bearing arm | Old School Industries, Inc., Dacono, CO | OS1010H-16BB | http://www.osi-incorp.com/productdisplay/dual-linear-ball-bearing-arm |
| Zoom Stereo Microscope with C-LEDS Hybrid LED Stand | Nikon, Tokyo, Japan | SMZ-445 | https://www.nikoninstruments.com/Products/Stereomicroscopes-and-Macroscopes/Stereomicroscopes/SMZ445 |
| Inverted microscope system | Nikon, Tokyo, Japan | Eclipse Ti-E | https://www.nikoninstruments.com/Products/Inverted-Microscopes/Eclipse-Ti-E |
| Ames medium | Sigma-Aldrich, St. Louis, MO | A1420 | http://www.sigmaaldrich.com/catalog/product/sigma/a1420 |
| L-Glutamic Acid (Glutamate) | Sigma-Aldrich, St. Louis, MO | G5667 | http://www.sigmaaldrich.com/catalog/product/mm/100291 |
| Sodium bicarbonate | Sigma-Aldrich, St. Louis, MO | S8761 | http://www.sigmaaldrich.com/catalog/product/sigma/s8761 |
| 60 mm Petri dish (10 mm tall) | Fischer Scientific, Waltham, MA | FB0875713A | 60 mm clear petri dish; https://www.fishersci.com/shop/products/fisherbrand-petri-dishes-clear-lid-12/fb0875713a |
| Jewelers #5 Forceps | World Precision Instruments, Sarasota, FL | 555227F | https://www.wpiinc.com/products/laboratory-supplies/555227f-jewelers-5-forceps-11cm-straight-titanium/ |
| Standard Scalpel Blad #24 | World Precision Instruments, Sarasota, FL | 500247 | https://www.wpiinc.com/products/laboratory-supplies/500247-standard-scalpel-blade-24/ |
| Scalpel Handle #4 | World Precision Instruments, Sarasota, FL | 500237 | https://www.wpiinc.com/products/laboratory-supplies/500237-scalpel-handle-4-14cm/ |
| Vannas Tubingen Dissection Scissors | World Precision Instruments, Sarasota, FL | 503378 | https://www.wpiinc.com/products/laboratory-supplies/503378-vannas-tubingen-scissors-8cm-straight-german-steel/ |
| Nylon mesh kit | Warner Instruments, Hamden, CT | NYL/MESH | https://www.warneronline.com/product_info.cfm?id=1173 |
| Harp slice grid | ALA Scientific Instruments, Farmingdale, NY | HSG-5AD | http://alascience.com/product/standard-harp-slice-grids/ |
| Ag/AgCl reference electrode pellet | Multi Channel Systems, GmbH | P1060 | http://www.multichannelsystems.com/products/p1060 |
| 4 Channel Valve Controlled Gravity Perfusion System | ALA Scientific Instruments, Farmingdale, NY | VC3-4xG | http://alascience.com/product/4-channel-valve-controlled-gravity-perfusion-system/ |
| Zyla 5.5 sCMOS microscope camera | Andor Technology, Belfast, UK | Zyla 5.5 sCMOS | http://www.andor.com/scientific-cameras/neo-and-zyla-scmos-cameras/zyla-55-scmos |
| Silver wire (50 μm diameter) | Fischer Scientific, Waltham, MA | AA44461G5 | https://www.fishersci.com/shop/products/silver-wire-0-05mm-0-002-in-dia-annealed-99-99-metals-basis-3/aa44461g5 |
| Tygon microbore tubing (1.6 mm diameter) | Cole Parmer, Vernon Hills , IL | EW-06419-01 | https://www.coleparmer.com/i/tygon-microbore-tubing-0-020-x-0-060-od-100-ft-roll/0641901 |
| Tilting Tool Holder with Steel Cannula | ALA Scientific Instruments, Farmingdale, NY | TILTPORT | One each of these were utilized for top perfusion and suction; http://alascience.com/product/tilting-tool-holder-with-steel-cannula/ |
| Roscolux #26 Light Red Filter Sheet | Rosco Laboratories Inc., 52 Harbor View, Stamford, CT | R2611 | Manufacturer: http://us.rosco.com/en/products/catalog/roscolux Vendor: https://www.bhphotovideo.com/c/product/43957-REG/Rosco_RS2611_26_Filter_Light.html |
| Smith & Wesson Galaxy Red Flashlight | Smith & Wesson, 2100 Roosevelt Avenue, Springfield, MA | 4588 | Manufacturer: https://www.smith-wesson.com/ Vendor: http://www.mypilotstore.com/mypilotstore/sep/4588 |
| MC_Rack Software | Multi Channel Systems, GmbH | MC_Rack | http://www.multichannelsystems.com/software/mc-rack |
| Labview Software | National Instruments, Austin, TX | LabVIEW | http://www.ni.com/labview/ |
| NIS-Elements: Basic Research Software | Nikon, Tokyo, Japan | NIS-Elements BR | https://www.nikoninstruments.com/Products/Software/NIS-Elements-Basic-Research |
References
- Pascolini, D., Mariotti, S. P. Global estimates of visual impairment: 2010. Br J Ophthalmol. , (2011).
- Fritsche, L. G., Fariss, R. N., Stambolian, D., Abecasis, G. R., Curcio, C. A., Swaroop, A. Age-Related Macular Degeneration: Genetics and Biology Coming Together. Annu Rev Genomics Hum Genet. 15, 151-171 (2014).
- Marc, R. E., et al. Neural reprogramming in retinal degeneration. Invest Ophthalmol Vis Sci. 48, 3364-3371 (2007).
- Jones, B. W., Kondo, M., Terasaki, H., Lin, Y., McCall, M., Marc, R. E. Retinal remodeling. Jpn J Ophthalmol. 56, 289-306 (2012).
- Soto, F., Kerschensteiner, D. Synaptic remodeling of neuronal circuits in early retinal degeneration. Front Cell Neurosci. 9, (2015).
- Trenholm, S., Awatramani, G. B. Origins of spontaneous activity in the degenerating retina. Front Cell Neurosci. 9, (2015).
- Euler, T., Schubert, T. Multiple Independent Oscillatory Networks in the Degenerating Retina. Front Cell Neurosci. 9, (2015).
- Boye, S. E., Boye, S. L., Lewin, A. S., Hauswirth, W. W. A Comprehensive Review of Retinal Gene Therapy. Mol Ther. 21, 509-519 (2013).
- Schwartz, S. D., et al. Human embryonic stem cell-derived retinal pigment epithelium in patients with age-related macular degeneration and Stargardt's macular dystrophy: follow-up of two open-label phase 1/2 studies. The Lancet. 385, 509-516 (2015).
- Reh, T. A. Photoreceptor Transplantation in Late Stage Retinal Degeneration. Invest Ophthalmol Vis Sci. 57, (2016).
- Zrenner, E. Fighting blindness with microelectronics. Sci Transl Med. 5, (2013).
- Humayun, M. S., de Juan, E. Jr, Dagnelie, G. The Bionic Eye: A Quarter Century of Retinal Prosthesis Research and Development. Ophthalmol. 123, S89-S97 (2016).
- Cruz, L., et al. The Argus II epiretinal prosthesis system allows letter and word reading and long-term function in patients with profound vision loss. Br J Ophthalmol. 97, 632-636 (2013).
- Zrenner, E., et al. Subretinal electronic chips allow blind patients to read letters and combine them to words. P R Soc B. 278, 1489-1497 (2011).
- Stronks, H. C., Dagnelie, G. The functional performance of the Argus II retinal prosthesis. Expert Rev Med Devices. 11, 23-30 (2014).
- Stingl, K., et al. Artificial vision with wirelessly powered subretinal electronic implant alpha-IMS. P R Soc B. 280, (2013).
- Rizzo, J. F. Update on retinal prosthetic research: the Boston Retinal Implant Project. J Neuroophthalmol. 31, 160-168 (2011).
- Ayton, L. N., et al. First-in-Human Trial of a Novel Suprachoroidal Retinal Prosthesis. PLoS ONE. 9, e115239(2014).
- Chuang, A. T., Margo, C. E., Greenberg, P. B. Retinal implants: a systematic review. Br J Ophthalmol. 98, 852-856 (2014).
- Cai, C., Twyford, P., Fried, S. The response of retinal neurons to high-frequency stimulation. J Neural Eng. 10, 036009(2013).
- Eiber, C. D., Lovell, N. H., Suaning, G. J. Attaining higher resolution visual prosthetics: a review of the factors and limitations. J Neural Eng. 10, 011002(2013).
- Humayun, M., Propst, R., de Juan, E., McCormick, K., Hickingbotham, D. Bipolar surface electrical stimulation of the vertebrate retina. Arch Ophthalmol. 112, 110-116 (1994).
- Zrenner, E., et al. Can subretinal microphotodiodes successfully replace degenerated photoreceptors? Vision Res. 39, 2555-2567 (1999).
- Majji, A. B., Humayun, M. S., Weiland, J. D., Suzuki, S., D'Anna, S. A., de Juan, E. Long-Term Histological and Electrophysiological Results of an Inactive Epiretinal Electrode Array Implantation in Dogs. Invest Ophthalmol Vis Sci. 40, 2073-2081 (1999).
- Peterman, M. C., Noolandi, J., Blumenkranz, M. S., Fishman, H. A. Localized chemical release from an artificial synapse chip. PNAS. 101, 9951-9954 (2004).
- Finlayson, P. G., Iezzi, R. Glutamate stimulation of retinal ganglion cells in normal and s334ter-4 rat retinas: a candidate for a neurotransmitter-based retinal prosthesis. Invest Ophthalmol Vis Sci. 51, 3619-3628 (2010).
- Inayat, S., Rountree, C. M., Troy, J. B., Saggere, L. Chemical stimulation of rat retinal neurons: feasibility of an epiretinal neurotransmitter-based prosthesis. J Neural Eng. 12, 016010(2015).
- Rountree, C. M., Inayat, S., Troy, J. B., Saggere, L. Differential stimulation of the retina with subretinally injected exogenous neurotransmitter: A biomimetic alternative to electrical stimulation. Sci Rep. 6, 38505(2016).
- Ray, A., Sun, G. J., Chan, L., Grzywacz, N. M., Weiland, J., Lee, E. -J. Morphological alterations in retinal neurons in the S334ter-line3 transgenic rat. Cell Tissue Res. 339, 481-491 (2010).
- Martinez-Navarrete, G., Seiler, M. J., Aramant, R. B., Fernandez-Sanchez, L., Pinilla, I., Cuenca, N. Retinal degeneration in two lines of transgenic S334ter rats. Exp Eye Res. 92, 227-237 (2011).
- Sigma Aldrich. Sigma Aldrich Ames Medium Product Information Sheet. , Available from: https://www.sigmaaldrich.com/content/dam/sigma-aldrich/docs/Sigma/Product_Information_Sheet/1/a1420pis.pdf (2017).
- Reinhard, K., et al. Step-By-Step instructions for retina recordings with perforated multi electrode arrays. PLoS ONE. 9, e106148(2014).
- Izumi, Y., Kirby, C. O., Benz, A. M., Olney, J. W., Zorumski, C. F. Müller cell swelling, glutamate uptake, and excitotoxic neurodegeneration in the isolated rat retina. Glia. 25, 379-389 (1999).
- Tunnicliff, G. Glutamate uptake by chick retina. Biochem J. 150, 297-299 (1975).
- Schwartz, E. A., Tachibana, M. Electrophysiology of glutamate and sodium co-transport in a glial cell of the salamander retina. J Physiol (Lond). 426, 43-80 (1990).
- Muller, A., Maurin, L., Bonne, C. Free radicals and glutamate uptake in the retina. Gen Pharmacol- Vasc S. 30, 315-318 (1998).
- Dhingra, N. K., Kao, Y. -H., Sterling, P., Smith, R. G. Contrast threshold of a brisk-transient ganglion cell in vitro. J of Neurophysiol. 89, 2360-2369 (2003).
- Ahlers, M. T., Ammermüller, J. A system for precise temperature control of isolated nervous tissue under optical access: Application to multi-electrode recordings. J of Neurosci Methods. 219, 83-91 (2013).
- Feke, G. T., Tagawa, H., Deupree, D. M., Goger, D. G., Sebag, J., Weiter, J. J. Blood flow in the normal human retina. Invest Ophthalmol Vis Sci. 30, 58-65 (1989).
- The Retina. Neuroscience. Purves, D., et al. , 2nd edition, Sinauer Associates. (2001).
Access restricted. Please log in or start a trial to view this content.
Reprints and Permissions
