Here we present a protocol for controlled production of protein microcrystals. The process uses an automated device allowing controlled manipulation of several crystallization parameters. The protein crystallization is carried-out by controlled and automated addition of crystallization solutions while monitoring and investigating the radius distribution of particles in the crystallization droplet.
Method Article
Growing Protein Crystals with Distinct Dimensions Using Automated Crystallization Coupled with In Situ Dynamic Light Scattering
Opens in a new tab
In This Article
Summary
Loading...
$$\rightleftharpoonup{xx}$$
$$\longleftharp{xx}$$,
$$\longrightharp{xx}$$,
Abstract
Loading...
$$\rightleftharpoonup{xx}$$
$$\longleftharp{xx}$$,
$$\longrightharp{xx}$$,
The automated crystallization device is a patented technique1 especially developed for monitoring protein crystallization experiments with the aim to precisely maneuver the nucleation and crystal growth towards desired sizes of protein crystals. The controlled crystallization is based on sample investigation with in situ Dynamic Light Scattering (DLS) while all visual changes in the droplet are monitored online with the help of a microscope coupled to a CCD camera, thus enabling a full investigation of the protein droplet during all stages of crystallization. The use of in situ DLS measurements throughout the entire experiment allows a precise identification of the highly supersaturated protein solution transitioning to a new phase – the formation of crystal nuclei. By identifying the protein nucleation stage, the crystallization can be optimized from large protein crystals to the production of protein microcrystals. The experimental protocol shows an interactive crystallization approach based on precise automated steps such as precipitant addition, water evaporation for inducing high supersaturation, and sample dilution for slowing induced homogeneous nucleation or reversing phase transitions.
Introduction
Loading...
$$\rightleftharpoonup{xx}$$
$$\longleftharp{xx}$$,
$$\longrightharp{xx}$$,
Over the last few years, the growth of protein micro- and nanocrystals has captured the attention of the protein-crystallography community, especially with the continuous development of Serial Femtosecond Crystallography (SFX). Due to the brilliance of the novel X-ray radiation sources and based on the successful results obtained so far, the production of protein micro- and nanocrystals has become of high relevance, posing a high demand on the preparation of such crystalline suspensions2,3. Due to the small crystal size-range required for data collection at free electron lasers (XFELs) and the limited availability of experimental beamtime, sample characterization prior to data collection is essential. The most common techniques to characterize protein micro- or nanocrystal suspensions are until now electron microscopy and X-ray powder diffraction.
So far, several approaches have been adapted from common crystallization methods with the aim to produce bulk amounts of protein crystals with dimensions in the small micrometer range. The batch method is used for fast mixing of high concentrated protein and precipitant solutions, thus forcing the sample solution to a highly supersaturated phase where nanocrystallization might be favored4. Other methods include crushing large protein crystals to form a crystal slurry, which can serve as nanocrystalline suspensions to be used for data collection5. However, the outcomes might sometimes result in decreased diffraction quality, as deteriorated crystals have lower internal order. Nanocrystallization based on free interface diffusion is also an available alternative, where protein solution is added in small amounts to a highly concentrated precipitant solution3. However, among all techniques, the most efficient methods appear to be the batch crystallization and more innovative manipulative techniques using vapor-diffusion methods in sitting drops6.
In general, for crystallization of a protein an energy barrier must be crossed to support nucleation - the first thermodynamic step in crystal formation. In order to move the protein solution from a thermodynamically stable state to supersaturation and finally to induce a phase-transition, some variables related to the protein solution need to be modified. Such variables are usually the concentration of the protein solution, environmental changes (e.g., temperature, humidity), solvent characteristics (e.g., pH, ionic strength), concentration and buffer properties, etc.7,8 An overview of sample parameters which can be changed is usually represented by means of phase diagrams, which allow different modes of presentation, such as solubility diagrams, nucleation phase diagrams, or even more detailed descriptions where three-dimensional or more complex diagrams can come into consideration8,9,10. The most appealing types of phase diagrams are usually two-dimensional, where the main variable is the protein concentration as a function of another parameter, while the remaining parameters are kept constant6,11. Once one or a few nuclei are formed, larger crystals can grow by taking up additional protein from the bulk solution. When aiming for micro- and nanocrystal production, such a conventional crystallization approach is not feasible anymore due to the small number of crystals that are present in solution. Nanocrystalline suspensions usually have to be rich in crystalline entities, thus the crystallization pathway has to be readjusted, such that there is a maxima of nucleation events present in the sample. In consequence, this requires the investigation of some new, until now unexplored nucleation pathways for proteins, which are also yet not fully understood12,13. Based on the phase diagram fundamentals mentioned previously, the classical theory has been extended to a new hypothesis, where nucleation is described as a two-step mechanism: at first, a transition to a higher protein concentration takes place (dense liquid phase) and second, a transition from a dense-rich phase to a higher internal order (crystal nuclei with lattice architecture)14,15,16. Protein crystallization is sensitive to many factors, and therefore when crystallization recipes are readjusted to result in different sized crystals, the recipes cannot always rely on previous knowledge. New insights need to be established for each individual protein target: adjustment of buffer composition, purity and stability of the sample, precise knowledge of protein solubility, etc.
Dynamic light scattering is today a well-established method for analysis and optimization of protein crystallization processes, due to a wide size-range of particles that can be investigated: from monomeric proteins to nanocrystals and small microcrystals. The method exploits that particles in solution undergo Brownian motion and that the average velocity of this motion is determined by the particle size, their thermal energy and by the viscosity of the medium and the particle geometry. At first, the liquid medium is illuminated by a coherent light source with the use of a laser. The light scattered by particles is forming an interference pattern. Because the particles are in permanent motion the interference pattern also changes permanently. When looking in a certain direction, intensity fluctuations can be observed. These fluctuations are now showing the particle movement caused by the Brownian motion. From the measured intensity fluctuations an autocorrelation function (ACF) is calculated. An analysis of the ACF will give a measure for the velocity distribution (more precisely the diffusion coefficient) of particles and by using the Stokes-Einstein equation, is converted into a particle radius distribution17. Additional information related to DLS functionality and working principle can be found in various publications and books18,19.
Here we apply and describe a unique automated crystallization device, the XtalController900, an upgraded version of the XtalController technology6, precisely developed for monitoring interactive protein crystallization experiments. This technique shows a high potential for identification and tracking of nucleation events in real-time, allowing a precise maneuvering through the crystallization phase diagram. The aim of this particular crystallization procedure is to optimize protein crystallization to obtain high quality protein micro- and nanocrystals that are suitable for applications utilizing micro-focused synchrotron X-ray sources, electron diffraction, or SFX.
Protocol
Loading...
$$\rightleftharpoonup{xx}$$
$$\longleftharp{xx}$$,
$$\longrightharp{xx}$$,
NOTE: Throughout the entire protocol, the micro-dosage system used for addition of water will be referred to as Pump0 while the micro-dosage system used for addition of precipitant will be called Pump1. The results of this experiment will be further discussed and referred to as THM2_micro-crystals.
1. Parameters and Solution Setup
- Filter 16 mL of Na-Tartrate solution (1.2 M) and 16 mL of distilled water using a 0.2 µm sterile syringe filter.
NOTE: The Na-tartrate solution represents the precipitant solution for the crystallization experiment. - Fill the precipitant and water bottles with 5 mL of the filtered solutions.
NOTE: The bottles have a maximum capacity of 5 mL. - Mount the bottles in the pump holders of the experimental chamber.
- Set the experimental parameters in the software window to the following values: temperature at 20 °C, relative humidity at 20, and solvent as water.
NOTE: Figure 2 shows the display window where the user can insert the correct values for each parameter such as temperature, relative humidity, and solvent. The software window shows also some additional parameters such as additives. This is only important for experiments where additives are present in the precipitant solution. - Open the front door of the experimental chamber and remove the coverslip carrier.
- Place a clean and siliconized coverslip on the carrier and place it back in the device.
NOTE: The coverslip has a size of 2.2 cm. - Close the experimental chamber to secure the environmental conditions from step 1.4.
NOTE: The protocol can be paused here.
2. Micro-dosage Systems Adjustment
- Switch ON Pump0 using the main pump characteristics in Figure 3 and create a water stream.
NOTE: The water stream trajectory is created based on some pump characteristics that can be adjusted. Figure 3 shows the main pump characteristics and the optimal values that should be used for this experiment. - Adjust the water stream aiming position towards the center of the coverslip by manually operating its designated adjustment screw. Switch OFF Pump0.
- Switch ON Pump1 and create a liquid stream as previously done in step 2.1. Adjust the stream position of Pump1 towards the position fixed for Pump0. Switch OFF Pump1.
- Replace the used coverslip with a new and clean one for the crystallization experiment.
NOTE: Soft wipes are usually recommended for cleaning the new coverslip from residual dust, prior to being used in the crystallization experiment.
3. Setting a Thaumatin Drop in the Experimental Chamber
- Create a new experimental file using the software package. Enter the following information in the experimental file: protein (thaumatin from Thaumatococcus daniellii), protein concentration (14 mg/mL), precipitant (Na-Tartrate), and precipitant concentration (1.2 M).
NOTE: This information will serve for automated calculations of precipitant and protein concentration during the crystallization experiment. - Load the new experiment file to activate all information from step 3.1.
- Mark the position of the protein droplet by adding a small water drop using Pump0.
NOTE: The aim is to create a small water drop that will serve as a landmark on which the protein sample will be placed. - Press the button Tare to set the weight given by the microbalance to zero.
NOTE: This will remove the weight of the coverslip and the extra weight added by the small water landmark created in step 3.3. - Open the top lid of the experimental chamber and pipette 8 µL of thaumatin solution on the water landmark.
- Register the new thaumatin drop by following the next commands.
- Press the button New drop to attribute the initial conditions from the experimental file.
- Press the button Const to compensate the natural evaporation of water from the droplet.
- Check with the CCD camera if Pump0 is aiming in the protein drop. Readjust the position of Pump0 if the water stream is aiming outside the drop.
NOTE: From this moment onwards, the protein droplet will remain at a constant weight, by automated water addition which compensates for natural water evaporation from the protein droplet. The weight of the protein droplet, as well as the other parameters such as temperature and relative humidity can be monitored in real-time using the display window. The experiment can be paused here.
4. In Situ DLS Measurements
- Switch ON the DLS laser and place the laser beam in the protein drop by manually using the adjustment screws.
- Enter the following DLS parameters: measurement duration (60 s), waiting time between two measurements (10 s), and number of measurements (300).
NOTE: The first 30 measurements will serve as reference measurements for protein stability-check. The rest of the measurements will serve as a full investigation of the protein droplet during the total length of the crystallization process. - Press the button Start to initiate the DLS measurements. Check the quality of the sample by selecting one of the DLS graphic representations.
NOTE: The sample should show a high degree of mono-dispersity, without any aggregates in the solution. The DLS results can be shown and read as: radius distribution, radius histogram, radius plot, measurements summary, or as an overview of the count rate intensity.
5. Sample Evaporation Step
- Enter the conditions for the evaporation step in the schedule table using the data shown in Table 1.
NOTE: The sign "-" introduced in the column "Molarity/Percentage" in the second row represents a loss of water from the protein droplet, while the value "25" means that the droplet volume will suffer a reduction of 25%. This means that the protein concentration of the droplet will increase with 25%. - Activate the sample evaporation step by pressing the button Autom. Press the button Stop when the sample evaporation step has finished.
- Activate the button Const to keep the drop constant after stopping the sample evaporation.
6. Precipitant Addition Step
- Enter the conditions for the precipitant addition step in the schedule table shown in Figure 4 using the data provided in Table 2.
NOTE: The first row of the table represents a calibration step, during which the software calculates the natural evaporation rate of the protein droplet based on the amount of precipitant that has to be added to the protein droplet. The software extrapolates this value and automatically adjusts the shooting frequency for Pump0 in order to automatically compensate the water evaporation for the next precipitant addition step. - Activate the precipitant addition step by pressing the button Autom.
NOTE: The addition of precipitant is an automated process, following the input from the schedule table.
7. Tracking the Evolution of the Crystallization Droplet Over Time
- Check the appearance of the thaumatin crystals by using the CCD camera.
- Check the particle size distribution by using the DLS graphic representations.
- Check the evolution of weight and experimental parameters by using the display window.
NOTE: When the Na-tartrate solution reaches a concentration of 0.74 M in the protein drop, the droplet becomes rich in thaumatin micro-crystals as seen in Figure 7.
8. Recovery of Crystallization Droplet
- Coat a clean standard Terasaki plate with paraffin oil.
- Add 3 mL of paraffin oil to the plate.
- Disperse the paraffin oil on the plate wells by gently moving the plate at different angles so that the oil covers all the 72 wells of the plate.
- Remove the excess of paraffin oil by pouring out the oil that floats on the plate.
- Press the button Stop to finish the crystallization experiment. Carefully take out the sample carrier containing the crystallization droplet.
- With the use of a pipette, place a volume of 2 µL aliquots of the crystallization drop in the wells of the Terasaki plate.
NOTE: By recovering the crystallization droplet in a plate under oil, the sample can be periodically checked for stability and crystal growth with the use of a microscope or other DLS techniques that work with standard Terasaki plates.
Results
Loading...
$$\rightleftharpoonup{xx}$$
$$\longleftharp{xx}$$,
$$\longrightharp{xx}$$,
The results obtained by DLS measurements during the crystallization experiment show a detailed evolution of the hydrodynamic particle radii resulting in two main particle distribution fractions, which develop over time. In the first part of the experiment, the sample was slowly evaporated, in order to achieve a higher protein concentration. As shown in Figure 5B, the protein drop was concentrated from 14 mg/mL to 19.5 mg/mL. During this time, according to the radius distribution pattern in Figure 5A, the protein shows a monomeric behavior in solution with a constant particle size of approximately 2.5 nm. As the sample is being further evaporated, the monomeric protein remains stable in solution, without any signs of denaturation or sample aggregation.
The addition of precipitant solution to the protein drop is immediately initiated after sample evaporation and highlighted with grey in the radius distribution pattern and balance curves for better visualization (Figure 5). Based on the calculations derived from the sample weight, the highlighted particle fraction is attributed to initiation of crystal nucleation, resulting in a radius size of approximately 200 - 400 nm. This phenomenon (known as nucleation) is initiated at a precipitant concentration of 0.6 M in the protein droplet, at a time period of approximately 66 min from the initiation of the experiment and approximately 23 min in respect to the initiation of precipitant addition. As the concentration of the precipitant increases, the radius distribution shows a broad distribution of particles in solution. As more nuclei form, the initial crystalline entities are growing in size, reaching a radius distribution between 800 - 1,300 nm. It can be concluded that at this stage, the crystal nuclei continue to grow, and the protein fraction is gradually becoming poorer as the protein molecules are taken-up by microcrystals. As the precipitant concentration in the protein drop slowly increases, the formation of microcrystals is easily identified after 75 min, when the radius distribution continues to develop between 500 and 1,500 nm. The evolution of the radius distribution is also confirmed by CCD camera images, where protein microcrystals are visible at a precipitant concentration of 0.7 M in solution (Figure 7). As the precipitant addition is finished and the crystallization drop is kept constant, the radius distribution shows a predominant phase between 1,000 and 3,000 nm, while the fraction of nucleation events diminishes over time. At this moment, the crystallization drop is fully saturated with microcrystals and no further nucleation events are present in solution.
Using as experimental input the feedback data given by the microbalance, a crystallization phase diagram was drawn for a comprehensive understanding of the thaumatin crystallization process. In Figure 6, the experimental phase diagram shows three independent crystallization experiments, where the production of thaumatin T. danielli microcrystals is labeled as THM_2 Micro-crystals (Protocol). Two additional crystallization experiments labeled THM_1 Macro-crystals and THM_3 Macro-crystals have been used as input data in order to have a correct mapping of the different areas in the phase diagram (e.g., solubility or metastable region). Since the protocols for these experiments follow different crystallization pathways, the identification of the nucleation region becomes easier, and hence more accurate. For each experiment, the crystallization path is highlighted by numbers of order to emphasize the different approaches and number of crystallization steps that were used for a specific outcome, while the grey arrows represent an estimation of the final protein concentration when crystal growth uptakes protein molecules from solution in the formation of well-defined stable protein crystals.
The three thaumatin experiments presented in Figure 6 show different conditions when entering the nucleation region, and hence different final crystallization outcomes as it can be seen from the pictures below the phase diagram. In the case of THM1 and THM3, the protein solution passes the nucleation phase and re-enters the metastable region, where it rests until crystals form. Consequently, the experiments lead to large, well-defined shaped crystals surrounded by mother liquor. However, for the experiment presented in the protocol section, THM2_micro-crystals, the crystallization path follows a particular approach. In a previous section we mentioned that for a sample to give microcrystals, the protein solution has to be located deep in the nucleation phase, so that the nucleation events can form at a maximum rate. In the case of THM2_micro-crystals, the ratio of protein to precipitant concentration was adjusted in such a fashion that the sample not only enters the nucleation region, but as a precipitant is further added to the protein solution, and the conditions do not move to another region in the phase diagram, but remain in a highly supersaturated state within the nucleation region. As a result, the entropy of the solution decreases drastically as the protein droplet becomes immediately saturated with small crystalline entities.

Figure 1. Schematic representation of the crystallization experiment. The drawing shows an overview of the crystallization experimental chamber with all the technical parts required for conducting an automated crystallization experiment. Please click here to view a larger version of this figure.
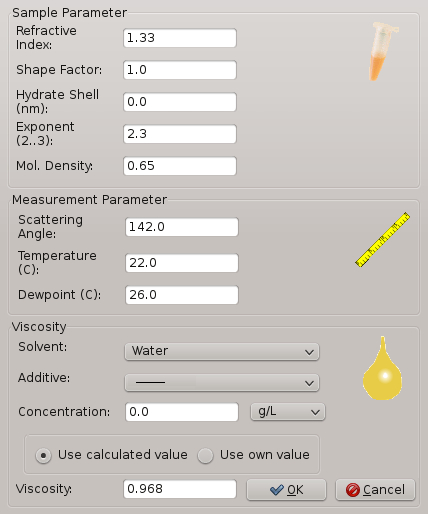
Figure 2: Software window for DLS and sample parameters that are relevant for a crystallization experiment. Parameters include temperature, relative humidity, viscosity, etc.
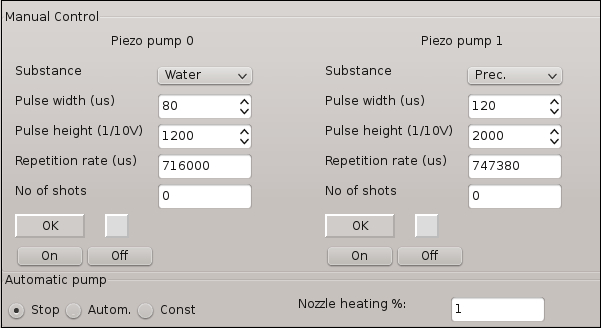
Figure 3: Software control window for the micro-dosage systems involved in the crystallization experiment. The features allow adjustment of specific parameters for the generation of droplets or solution stream.
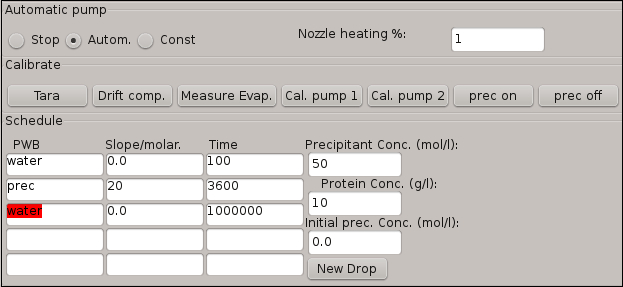
Figure 4: Software window for the schedule table describing the crystallization steps involved in the experiment. The initial conditions of the crystallization droplet are also integrated in this window.
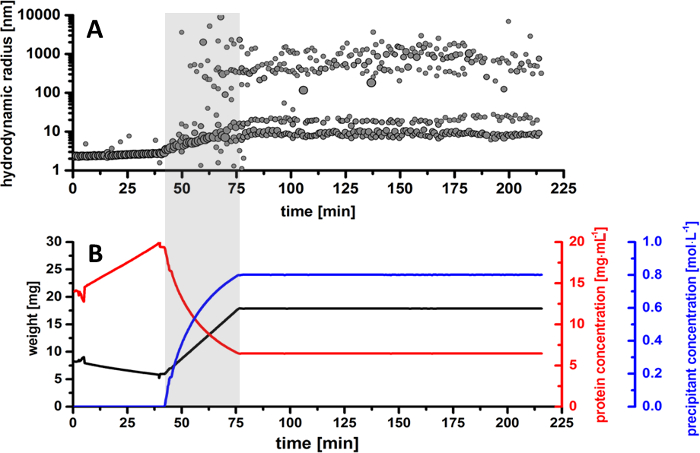
Figure 5. Overview of thaumatin T. daniellii microcrystals production. (A) Radius distribution of particle size in the protein drop during the entire crystallization process. (B) Monitored overview of experimental parameters. The plots represent the evolution over time for the weight of the protein droplet (black curve) together with the calculated protein concentration (red curve) and precipitant concentration (blue curve). Please click here to view a larger version of this figure.

Figure 6: Experimental crystallization phase diagram for thaumatin T. danielli together with the resulting outcomes. All plots are derived from experimental data, based on the feedback information given by the microbalance. The numbers attributed to each experiment that are visible between brackets represent the order and the number of steps taken during a crystallization protocol. Please click here to view a larger version of this figure.

Figure 7: Recorded photograph for THM2_Micro-crystals (Protocol) showing an abundant number of microcrystals saturated in solution. The picture was taken at 4 h (240 min) after setting the protein droplet in the experimental chamber for crystallization. Please click here to view a larger version of this figure.
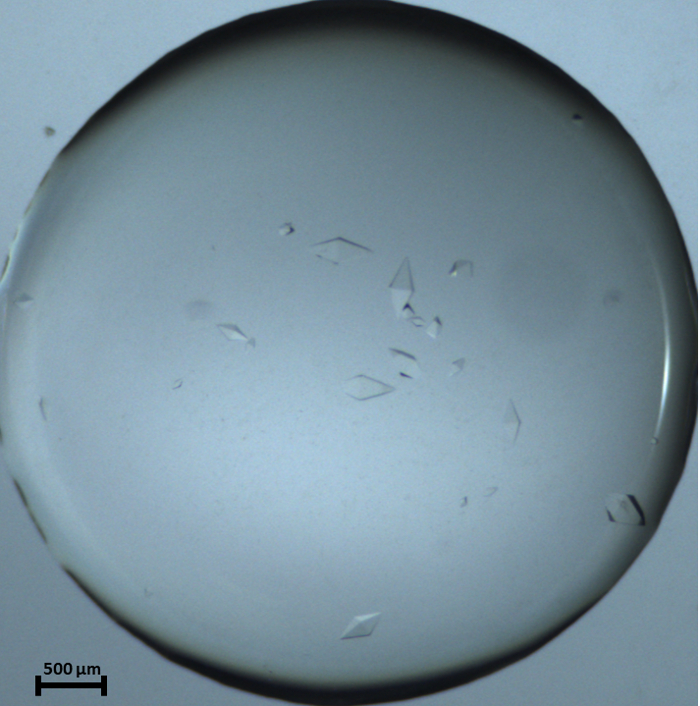
Figure 8: Recorded photograph for THM_1 Macro-crystals showing a few large thaumatin crystals stable in solution. The picture was taken 20 h after setting the protein droplet in the experimental chamber for crystallization. Please click here to view a larger version of this figure.

Figure 9: Recorded photograph for THM_3 Macro-crystals showing various sizes of thaumatin crystals in solution. The picture was taken 20 h after setting the protein droplet in the experimental chamber for crystallization. Please click here to view a larger version of this figure.
| Substance | Molarity/Percentage | Time (s) |
| water | 0 | 100 |
| water | -25 | 2100 |
| water | 0 | 2100 |
Table 1: Automated schedule input for the sample evaporation step in the production of thaumatin microcrystals.
| Substance | Molarity/Percentage | Time (s) |
| water | 0 | 100 |
| prec | 0.8 | 1800 |
| water | 0 | 18000 |
Table 2: Automated schedule input for the precipitant addition step in the production of thaumatin microcrystals.
Discussion
Loading...
$$\rightleftharpoonup{xx}$$
$$\longleftharp{xx}$$,
$$\longrightharp{xx}$$,
The crystallization device is designed to monitor and manipulate crucial parameters during a crystallization experiment based on a modified vapor-diffusion method. This technique allows monitoring and scoring a protein crystallization experiment at all stages, enabling the user to have precise knowledge and control of the protein solution throughout the crystallization phase diagram, based on in situ DLS analysis of the sample suspension.
The crystallization device comprises an experimental chamber (Figure 1) connected to a CCD camera that allows real-time monitoring of the crystallization droplet. The camera is adapted to a microscope equipped with different magnification lenses, providing a maximal spatial resolution of approximately 2.5 µm. The core of the experimental chamber is an ultrasensitive microbalance for tracking the evolution of the sample weight over time. The crystallization procedure corresponds to a sitting-drop vapor-diffusion experiment, where the protein drop is placed on a siliconized coverslip, which is placed on the microbalance. Based on weight changes of the droplet, which are caused by precipitant addition, water/additive addition, or sample evaporation, the microbalance gives a precise input to an algorithm for immediate calculation of protein and precipitant concentration over time. In addition, important crystallization parameters such as temperature and relative humidity are precisely monitored and controlled.
In order to perform a crystallization experiment, the device is equipped with two micro-dosage systems (contact free piezoelectric pumps) that work at a picoliter scale for precipitant and water addition. By working with such small amounts of substance, the concentration gradients and the convection phenomenon within the protein droplet are minimized. The main role of the piezoelectric pumps is the addition of precipitant or water, the latter for example being used as compensation for natural evaporation of the protein droplet. The micro-dosage systems have a set of features, which can dictate the addition of a substance. Such features include: the repetition rate for adding a substance, the number of droplets added per second, the width and height of the substance stream trajectory, etc. Moreover, the position of the pumps can be manually adjusted, enabling the user to have a precise position for addition of substances into the protein droplet.
The unique feedback controlled manipulation of the crystallization drop is achieved by in situ DLS data, which can show possible changes in the protein oligomeric state throughout the entire experimental procedure. The technique allows constant evaluation of particle size distribution over time, thus revealing unknown protein-related mechanisms. The DLS optics equipment is placed strategically below the coverslip area, allowing the detector and laser beam to pass through the coverslip and further through the protein droplet in an in situ fashion; therefore, only changes within the droplet are recorded from the DLS path. To allow easy handling, the device has two openings: a front door for an optimal positioning of the coverslip and a top lid which can be removed, so that the user can adjust the shooting position of the micro-dosage systems as well as setting with accuracy a new protein droplet on the coverslip.
The interactive crystallization method using the aforementioned device is a reliable technique for size-controlled production of protein crystals. Although many crystallization methods are currently available, inside information about the crystallization mechanism itself is not easily achievable. In general, applying conventional crystallization methods allows only limited control of a solution in the crystallization phase diagram, with only a few possibilities of changing its course once an experiment has started. While performing a crystallization experiment and applying such an automated crystallization technology coupled with in situ DLS, a great deal of knowledge is gained about transitions in the phase diagram. In general, the regions resulting in amorphous precipitate and the induction of homogeneous nucleation are close to each other in the phase diagram. Therefore, by manipulating the course of a crystallization droplet based on real-time information about its particle distribution, it is possible to avoid precipitation of a protein by gradually adjusting the crystallization conditions towards nucleation and crystal formation.
Nowadays, many crystallization conditions include precipitant solutions where polyethylene glycol (PEG) derivatives are widely present. Such compounds usually have a high viscosity which can possess difficulties for pipetting or dispensing. In the present case study, the micro-dosage systems that are used for the precipitant dispensing apply very thin capillaries that make the addition of picolitre increments possible. As a consequence, there are some limitations in working with highly viscous substances. Within a series of past experiments, the system has given positive results using the following PEG derivates: PEG200 50%, PEG3000 20%, PEG6000 10%, PEG800010%. Although so far only the aforementioned solutions were tested, the micro-dosage systems contain a special heating mechanism which can be used in order to decrease the viscosity of a solution. Another factor is salt solutions that have to be considered when used as protein precipitant. When working with highly concentrated salts, a small amount can crystallize at the nozzle of the micro-dosage system, causing superficial blocking of the micro-dosage pump during precipitant addition; even when a very high relative humidity is present in the experimental chamber. To overcome this issue, the experiment needs to be put on hold so that the salt from the nozzle can be removed. This might require special handling and might produce errors in the precipitant addition phase.
Based on the valuable information that can be achieved when performing such automated crystallization experiments, this technique can also be extended to studies investigating the physical chemistry aspects of protein crystallization. The nucleation and crystal growth reaction rates are kinetic phenomena which can be derived and calculated based on the time-dependence information depicted from an experiment such as temperature, growth of particle size, and protein and precipitant concentration.
Disclosures
Loading...
$$\rightleftharpoonup{xx}$$
$$\longleftharp{xx}$$,
$$\longrightharp{xx}$$,
We hereby declare that the authors Arne Meyer, Karsten Dierks, and Christian Betzel are shareholders of the company Xtal-Concepts GmbH, producer of the XtalController900 technology.
Acknowledgements
Loading...
$$\rightleftharpoonup{xx}$$
$$\longleftharp{xx}$$,
$$\longrightharp{xx}$$,
The authors acknowledge funding from the European Union's Horizon 2020 Research and Innovation program under the Marie Sklodowska-Curie Acronym "X-Probe" Grant Agreement No. 637295 and support via BMBF grant 05K16GUA, and the "The Hamburg Centre for Ultrafast Imaging – Structure, Dynamics and Control of Matter at the Atomic Scale" excellence cluster of the Deutsche Forschungsgemeinschaft (DFG).
Materials
| Name | Company | Catalog Number | Comments |
|---|---|---|---|
| Thaumatin from Thaumatococcus daniellii | Sigma-Aldrich | 1002365940 | Protein for protocol |
| Bis-Tris 14880 | Sigma-Aldrich | 2302377 | Buffer for protein solution |
| di-Sodium tartrate dihydrate | AppliChem | A0451,0500 | Precipitant for protein solution |
| Silliconized coverslips | Heinz Herenz Medizinalbedarf GmbH | 1051203 | Coverslips for crystallization |
| Syringe filter | Starstedt | 831826001 | Filter pore 0.2 µm |
| Syringe | Omnifix | 4617207V | Luer Lock Solo 20 mL |
| Paraffin oil | Sigma-Aldrich | 2323842 | Oil for coating the plate |
| Standard Terakasi plate | Sigma-Aldrich | M5812270EA | Plate for recovering the crystallization droplet |
| Soft wipes | KIMTECH Science | ||
| XtalController900 | Xtal-Concepts GmbH | XTC900 | Crystallization device |
References
Loading...
$$\rightleftharpoonup{xx}$$
$$\longleftharp{xx}$$,
$$\longrightharp{xx}$$,
- Xtal Concepts GmbH, Germany . Patent "Vorrichtung und Verfahren zur Kontrolle der Kristallisation". , EP 2 588 649 (11754824.8) and US 9,284,659 B2 (2010).
- Chapman, H. M., et al. Femtosecond X-ray protein nanocrystallography. Nature. 470 (7332), 73-77 (2011).
- Kupitz, C., Grotjohann, I., Conrad, C. E., Roy-Chowdhury, S., Fromme, R., Fromme, P. Microcrystallization techniques for serial femtosecond crystallography using photosystem II from Thermosynechococcuselongatus as a model system. Philos. Trans. R. Soc. Lond. B Biol. Sci. 369 (1647), 20130316(2014).
- Schlichting, I. Serial femtosecond crystallography: the first five years. IUCrJ. 2 (2052-2525), 246-255 (2015).
- Stevenson, H. P., et al. Use of transmission electron microscopy to identify nanocrystals of challenging protein targets. Proc. Natl. Acad. Sci. U.S.A. 111 (23), 8470-8475 (2014).
- Meyer, A., et al. Single-drop optimization of protein crystallization. Acta. Crystallogr. Sect. F. Biol. Cryst. Commun. 68 (Pt 8), 994-998 (2012).
- Ferré-D'Amaré, A. R. Crystallization of Biological Macromolecules. 5 (7), Cold Spring Harbor Laboratory Press. 847-848 (1999).
- Asherie, N. Protein crystallization and phase diagrams. Methods. 34 (3), 266-272 (2004).
- Sauter, C., Lorber, B., Kern, D., Cavarelli, J., Moras, D., Giege, R. Crystallogenesis studies on yeast aspartyl-tRNAsynthetase: use of phase diagram to improve crystal quality. Acta. Cystallogr. D. Biol. Crystallogr. 55 (Pt 1), 149-156 (1999).
- Ewing, F., Forsythe, E., Pusey, M. Orthorhombic lysozyme solubility. Acta. Crystallogr. D. Biol. Crystallogr. 50 (Pt 4), 424-428 (1994).
- Saridakis, E. E. G., Steward, P. D. S., Lloyd, L. F., Blow, D. M. Phase diagram and dilution experiments in the crystallization of carboxypeptidase G2. Acta. Crystallogr. D. Biol. Crystallogr. 50 (Pt 3), 293-297 (1994).
- McPherson, A., Cudney, B. Optimization of crystallization conditions for biological macromolecules. Acta. Crystallogr. F. Struct. Biol. Commun. 70 (Pt 11), 1445-1467 (2014).
- Sleutel, M., Van Driessche, A. E. S. Role of clusters in nanoclassical nucleation and growth of protein crystals. Proc. Natl. Acad. Sci. USA. 111 (5), 546-553 (2014).
- Schubert, R., Meyer, A., Baitan, D., Dierks, K., Perbandt, M., Betzel, C. Real-time observation of protein dense liquid cluster evolution during nucleation in protein crystallization. Cryst. Growth Des. 17 (3), 954-958 (2017).
- Vekilov, P. G. The two-step mechanism of nucleation of crystals in solution. Nanoscale. 2 (11), 2346-2357 (2010).
- Vekilov, P. G. Dense liquid precursor for the nucleation of ordered solid phases from solution. Crystal Growth & Design. 4 (4), 671-685 (2004).
- Dierks, K., Meyer, A., Einspahr, H., Betzel, C. Dynamic light scattering in protein crystallization droplets: adaptations for analysis and optimization of crystallization processes. Cryst. Growth Des. 8 (5), 1628-1634 (2008).
- Schubert, R., et al. Reliably distinguishing protein nanocrystals from amorphous precipitate by means of depolarized dynamic light scattering. J. Appl. Cryst. 48, 1476-1484 (2015).
- Brown, W. Dynamic light scattering: the method and some applications. , Clarendon Press: Oxford. ISBN-13: 978-0198539421 978(1993).
Reprints and Permissions
Request permission to reuse the text or figures of this JoVE article
Request Permission