Preparing and testing Pt/C fuel cell catalysts is subject to continuous discussion in the scientific community with respect to reproducibility and best practice. With the presented work, we intend to present a step-by-step tutorial to make and test Pt/C catalysts, which can serve as benchmark for novel catalyst systems.
Method Article
On the Preparation and Testing of Fuel Cell Catalysts Using the Thin Film Rotating Disk Electrode Method
Opens in a new tab
In This Article
Summary
Loading...
$$\rightleftharpoonup{xx}$$
$$\longleftharp{xx}$$,
$$\longrightharp{xx}$$,
Abstract
Loading...
$$\rightleftharpoonup{xx}$$
$$\longleftharp{xx}$$,
$$\longrightharp{xx}$$,
We present a step-by-step tutorial to prepare proton exchange membrane fuel cell (PEMFC) catalysts, consisting of Pt nanoparticles (NPs) supported on a high surface area carbon, and to test their performance in thin film rotating disk electrode (TF-RDE) measurements. The TF-RDE methodology is widely used for catalyst screening; nevertheless, the measured performance sometimes considerably differs among research groups. These uncertainties impede the advancement of new catalyst materials and, consequently, several authors discussed possible best practice methods and the importance of benchmarking.
The visual tutorial highlights possible pitfalls in the TF-RDE testing of Pt/C catalysts. A synthesis and testing protocol to assess standard Pt/C catalysts is introduced that can be used together with polycrystalline Pt disks as benchmark catalysts. In particular, this study highlights how the properties of the catalyst film on the glassy carbon (GC) electrode influence the measured performance in TF-RDE testing. To obtain thin, homogeneous catalyst films, not only the catalyst preparation, but also the ink deposition and drying procedures are essential. It is demonstrated that an adjustment of the ink's pH might be necessary, and how simple control measurements can be used to check film quality. Once reproducible TF-RDE measurements are obtained, determining the Pt loading on the catalyst support (expressed as Pt wt%) and the electrochemical surface area is necessary to normalize the determined reaction rates to either surface area or Pt mass. For the surface area determination, so-called CO stripping, or the determination of the hydrogen underpotential deposition (Hupd) charge, are standard. For the determination of the Pt loading, a straightforward and cheap procedure using digestion in aqua regia with subsequent conversion of Pt(IV) to Pt(II) and UV-vis measurements is introduced.
Introduction
Loading...
$$\rightleftharpoonup{xx}$$
$$\longleftharp{xx}$$,
$$\longrightharp{xx}$$,
The increasing use of renewable energy sources like wind or solar power require the ability to store and re-convert large amounts of electrical energy. In this respect, the application of chemical energy carriers, such as hydrogen, is a promising pathway1. Water electrolysis can produce hydrogen from excess electrical energy, whereas PEMFCs efficiently re-convert the hydrogen into electricity. However, for large scale applications, such as automobiles, the precious group metal (PGM) content in PEMFCs needs to be significantly reduced to lower the costs. In the scientific literature, several catalyst systems2 are presented, which are reported to exhibit the potential to meet these requirements based on TF-RDE half-cell testing3.
TF-RDE measurements became extremely popular in PEMFC research and are now used as a standard method to compare different PEMFC catalysts. However, for similar catalysts, significant differences in oxygen reduction reaction (ORR) activity or electrochemical surface areas (ECSA) are often reported by different research groups4. As a consequence, several research groups worked on improving experimental procedures and defining best practice procedures of how to test PEMFC catalysts5. At first, factors like catalyst loading, contaminations from the reference electrode, iR compensation, etc. were highlighted6,7,8; whereas, in recent years, the influence of the catalyst film's properties on performance came into focus9,10. For example, it could be shown that both ORR activity and ECSA depend on the catalyst ink composition, which in turn influences the homogeneity of the catalyst film on the glassy carbon (GC) electrode used as substrate. The observed increase in the measured Pt surface area upon the addition of isopropanol to the catalyst ink is especially surprising at first sight, but these results point towards the importance of carbon support wetting. Another important (and correlated) factor is mass transport. The TF-RDE is limited to low current densities due to the low gas solubility in the electrolyte11,12,13. Therefore, it is often assumed that in such extremely thin catalyst layers (ca. 1 µm), reactant mass transport plays a limited role. Nevertheless, in very recent work, it was shown that adjustment of the ink pH, leads to a considerable increase in ORR activity in home-made catalysts14. These examples highlight that in TF-RDE measurements, careful controls are necessary, and that depending on the catalyst, it might be difficult to define a single standard testing protocol/recipe.
Therefore, in the presented work, we discuss a step-by-step procedure for synthesizing and testing a standard Pt/C fuel cell catalyst. The procedure includes catalyst synthesis, its characterization, and the ink preparation and adjustment as well as the electrochemical TF-RDE measurements. The purpose of the procedure is to enhance consciousness concerning certain sources of errors and experimental pitfalls, as well as to provide a recipe for a possible Pt/C benchmark catalyst.
Protocol
Loading...
$$\rightleftharpoonup{xx}$$
$$\longleftharp{xx}$$,
$$\longrightharp{xx}$$,
1. Synthesis of 50 wt% Pt/C Catalysts
- Colloidal synthesis of Pt nanoparticles (NPs)
- To obtain a colloidal suspension of 2 nm Pt NPs, mix 4 mL of a solution of NaOH at 0.4 M in ethylene glycol (EG) with 4 mL of H2PtCl6·6H2O at 40 mM in EG in a microwave reaction vessel.
- Heat the mixture for 3 min at 160 °C with the microwave reactor (dynamic mode, heating power: 100 W, stirring: low).
- Immobilization of Pt NPs onto carbon supports
- Add 30 mL of 1 M HCl solution to 7.3 mL of the colloidal Pt NPs suspension for precipitation. Centrifuge the mixture at a relative centrifugal force of 2,900 x g (5,000 rotations per minute (rpm)) for 5 min and discard the supernatant solvent. Repeat these washing/centrifugation steps twice.
NOTE: All chemicals should be collected and disposed of according to the rules at the local institution. - Re-disperse the Pt NPs in 7 mL of acetone. Disperse 27.5 mg of carbon black in 1 mL of acetone. Mix both acetone dispersions and evaporate the acetone in a rotary evaporator (40 °C, 200 mbar) or Schlenk line (40 °C, 200 mbar) until completely dried.
- Dry the obtained Pt/C catalyst powder in an oven (120 °C) over night.
- Add deionized (DI) water to the Pt/C catalyst powder and sonicate (35 kHz, 160 Watt) it in an ultrasonic bath filled with cold water (<5 °C) for 3 min. Filter out and wash the catalyst with DI water on filter paper (4-7 µm). Dry the catalyst powder in a vacuum oven (100-120 °C, 10 kPa).
NOTE: This procedure leads to 55 mg of a Pt/C catalyst with a Pt wt% of 50 and a Pt particle size of ca. 2 nm. To prepare larger amounts of Pt/C catalyst, scale up the respective amounts in a ratio of 1:1. By varying the amount of Pt NPs to carbon black, the Pt loading can be adjusted between 10 and 70-80 wt% without significant NP agglomeration. - To make a catalyst ink, mix 6.3 mg of 50 wt% Pt/C catalyst powder with 6 mL of DI water and 2 mL of isopropanol (IPA). Add a small amount of 1 M KOH solution (~10 µL) to adjust the pH of the ink to be around 10. Place the glass vial containing the mixture in an ultrasonic bath filled with cold water (<5 °C) and sonicate (35 kHz, 160 Watt) it for 15 min.
NOTE: Do not add IPA to the catalyst first. If alcohol is added to a dried Pt/C catalyst powder, the catalyst catches fire.
- Add 30 mL of 1 M HCl solution to 7.3 mL of the colloidal Pt NPs suspension for precipitation. Centrifuge the mixture at a relative centrifugal force of 2,900 x g (5,000 rotations per minute (rpm)) for 5 min and discard the supernatant solvent. Repeat these washing/centrifugation steps twice.
2. Characterization of Pt NPs and Pt/C Catalysts
- Transmission electron microscope (TEM) characterization of Pt NPs
- Add 30 mL of 1 M HCl solution to 7.3 mL of the colloidal Pt NPs suspension for precipitation. Centrifuge the mixture at a relative centrifugal force of 2,900 x g (5,000 rotations per minute (rpm)) for 5 min and discard the supernatant solvent. Repeat these washing/centrifugation steps twice.
- Take a drop (ca. 100 µL) of the Pt NP suspension and re-disperse it in 1 mL of acetone.
- Put a drop of the diluted, re-dispersed NPs on a TEM grid (with a normal carbon film) placed on a filter paper to absorb excess solvent and let the grid dry in air.
- Analyze the particle size distribution by imaging at least 5 different areas of the grid, using at least 3 different magnifications (e.g., 100,000X, 300,000X, 400,000X). Measure the size (and related size distribution) of at least 300 NPs from the micrographs.
- TEM characterization of Pt/C catalyst
- Dilute the catalyst ink (described above) twice with 100% IPA. Put a drop of the diluted catalyst ink on a TEM grid (with a holey or lacey carbon film) placed on a filter paper to absorb the excess of solvent and let the grid dry in air.
- Analyze the particle size distribution by imaging at least 5 different areas of the grid, using at least 3 different magnifications (e.g., 100,000X, 300,000X, 400,000X). Measure the size (and related size distribution) of at least 300 NPs from the micrographs.
NOTE: TEM images with better contrast are obtained by observing the Pt/C catalyst particles, which do not overlap with a carbon film of the grid. This is the advantage of using TEM grids with a holey or lacey carbon film here.
- Digestion of Pt NPs by aqua regia
- Dry the Pt/C catalyst in a vacuum oven (80 °C, 10 kPa) overnight. Weigh the catalyst powder in a ceramic crucible.
- Heat the catalyst powder in the crucible of a muffle furnace (air, 900 °C, 30 min) to burn off the carbon support. Put a lid on the crucible to prevent the catalyst powder from flying during the heating.
- Add 4 mL of aqua regia (mixture of 30% HCl and 65% HNO3 in a volume ratio of 3:1) into the crucible and heat the mixture on a hot plate at ca. 80 °C for 2 h.
CAUTION: Aqua regia is an aggressive acid and should be handled with care. - Adjust the final volume to 10 mL with DI water.
- Determine the concentration of Pt in the aqua regia solution by an inductively coupled plasma-mass spectrometry (ICP-MS)15 or an ultraviolet-visible spectroscopy (UV-Vis, described below).
- Determination of Pt loading via UV-Vis
- Mix 0.75 mL of 2 M HCl with 0.25 mL of 1 M SnCl2 prepared in 4 M HCl in a quartz cuvette and add 1 mL of the aqua regia sample.
- Measure the UV-vis spectrum of a mixture of 1.75 mL of 2 M HCl and 0.25 mL of 1 M SnCl2 in 4 M HCl as a baseline.
- Measure the UV-Vis spectrum of the sample mixture (700 nm - 350 nm).
- Add 5 µL of Pt standard solution (1,000 ppm) to the sample solution, stir it well, and measure the UV-Vis spectrum. Repeat the addition of the Pt standard solution and the measurement 4 times.
- Subtract the absorbance at 680 nm (baseline) from the absorbance at 402 nm (peak top), and plot it against the concentration of the added Pt. Determine the concentration of Pt in the aqua regia sample from the x-intercept of the calibration curve.
3. Rotating Disc Electrode (RDE) Measurement of Pt/C Catalysts
- Characterization of the catalyst ink via light scattering measurements
- Measure the pH of the catalyst ink with a pH meter.
- Dilute the catalyst ink 50 times by adding IPA/H2O (1:3, v:v) mixed solvent. Add acid or base to keep the pH of the catalyst ink constant.
- Measure the zeta potential of the 50X diluted sample using the electrophoretic light scattering (ELS)16 mode of the light scattering device.
- Measure the size of aggregates in the diluted sample using dynamic light scattering (DLS)17 of the light scattering device.
- Catalyst thin film fabrication
- Polish a glassy carbon (GC) disk electrode (5 mm in diameter) to mirror finish using alumina paste (first 0.3 µm, then 0.05 µm), and clean it ultrasonically in DI water.
- Pipette a 5 µL aliquot of the catalyst ink onto the GC electrode leading to a Pt loading of 10 µgPt cm-2. Dry the ink under Ar gas flow humidified with a mixture of IPA and DI water (17:3, v:v) in a bubbler.
NOTE: The drying condition can be optimized by changing the ratio between IPA and DI water in the bubbler. - Confirm that the surface of the GC electrode is uniformly covered with the catalyst thin film by a CCD camera.
- Electrochemical measurements
- Employ an electrochemical glass or polytetrafluoroethylene (PTFE) cell based on a three-compartment configuration in all electrochemical measurements. Use the modified GC disk electrode, platinum mesh, and a trapped hydrogen/saturated calomel electrode (SCE) as working electrode, a counter electrode, and a reference electrode, respectively.
NOTE: A sub-compartment of the cell for the reference electrode needs to be separated from a main compartment by a perfluorinated membrane (e.g., nafion membrane) when a SCE is used to avoid the diffusion of chloride ions. - Soak the cell and components in mixed acid (H2SO4:HNO3 = 1:1, v:v) overnight. Subsequently, rinse the cell and other components thoroughly with DI water, and boil them in DI water twice.
NOTE: Clean the cell with the mixed acid at least once a month (depending on the frequency of use).
CAUTION: Handle the mixed acid with care. Between electrochemical experiments, boil and keep the cell in DI water covered by a lid. - Pour 0.1 M HClO4 electrolyte solution into the electrochemical cell. Place the 3 electrodes (the working electrode, the counter electrode, and the reference electrode) in each compartment of the cell, and connect the electrodes to the potentiostat.
- Measure the resistance in the electrolyte between the working electrode and the Luggin capillary (iR-drop; ~30 Ω), and compensate it during the whole measurement process by using the analog positive feedback scheme of the potentiostat. The resulting effective solution resistance is less than 3 Ω.
NOTE: If the potentiostat does not have an analog feedback scheme, apply a software based iR-drop compensation. - Calibrate the reference electrode. Purge the electrolyte with H2 gas and scan the potential at a scan rate of 50 mV s-1. Determine the potential where the current density is equal to 0 mA cm-2 as 0 V versus reversible hydrogen electrode (RHE).
- Purge the electrolyte with Ar gas (ca. 0.3 L min-1). Clean the catalysts by potential cycles between 0.05 and 1.20 V at a scan rate of 0.05 V s-1, until a stable cyclic voltammogram is observed (~50 cycles).
- Perform background measurements.
- Record a cyclic voltammogram (CV) as a background measurement. Purge the electrolyte with Ar gas (ca. 0.3 L min-1). Sweep the potential between 0.05 and 1.10 V at a scan rate of 0.05 V s-1.
- Perform ORR activity measurement.
- Record a cyclic voltammogram in the O2-purged electrolyte (ca. 0.3 L min-1). Sweep the potential between 0.05 and 1.10 V at a scan rate of 0.05 V s-1 and a rotation speed of 1,600 rpm.
- Perform CO stripping voltammetry.
- Hold the working electrode at 0.05 V during a CO purge (ca. 0.3 L min-1) through the electrolyte for 5 min followed by an Ar purge (ca. 0.3 L min-1) for 10 min. Subsequently sweep the potential from 0.05 V to 1.10 V at a scan rate of 0.05 V s-1.
CAUTION: Check if the use of CO gas is allowed; if so, this work must be done in a fume hood and safety measures need to be followed.
- Hold the working electrode at 0.05 V during a CO purge (ca. 0.3 L min-1) through the electrolyte for 5 min followed by an Ar purge (ca. 0.3 L min-1) for 10 min. Subsequently sweep the potential from 0.05 V to 1.10 V at a scan rate of 0.05 V s-1.
- After the electrochemical measurements, transfer the catalyst films on the GC electrode onto a tissue paper by pressing the electrodes on the paper wetted with water and photograph the transferred catalyst films.
- Employ an electrochemical glass or polytetrafluoroethylene (PTFE) cell based on a three-compartment configuration in all electrochemical measurements. Use the modified GC disk electrode, platinum mesh, and a trapped hydrogen/saturated calomel electrode (SCE) as working electrode, a counter electrode, and a reference electrode, respectively.
- Data analysis
- Calculate the electrochemical surface area (ECSA) of the catalyst from the charge QCO of the CO oxidation peak, taking into account the scan speed
 , the Pt loading L, and using a conversion coefficient of 390 µC cm-2Pt (two electron process)6.
NOTE: Alternatively, the ECSA can be calculated from the Hupd (QH) area of a cyclic voltammogram recorded in Ar-purged electrolyte using a conversion coefficient of 195 µC cm-2Pt (one electron process).
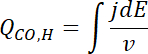

- Correct the nonfaradaic background by subtracting the cyclic voltammogram recorded in Ar-purged electrolyte from the voltammogram recorded in O2-purged electrolyte. Determine the ORR kinetic current density, jk, using the anodic scan of the corrected voltammogram and Koutecky-Levich equation:
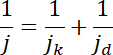
NOTE: Here j and jd are representative of the measured current density and diffusion limiting current density, respectively.
- Calculate the electrochemical surface area (ECSA) of the catalyst from the charge QCO of the CO oxidation peak, taking into account the scan speed
Results
Loading...
$$\rightleftharpoonup{xx}$$
$$\longleftharp{xx}$$,
$$\longrightharp{xx}$$,
A dark brown, colloidal suspension of Pt NPs is obtained from the protocol section 1.1 (Figure 1, left). The colloidal suspension is so stable that it can be stored for more than 1 month without any precipitation. Larger Pt NPs are synthesized by decreasing the NaOH concentration18. However, the colloidal suspension becomes less stable by decreasing the NaOH concentration. As an extreme example, completely agglomerated Pt NPs are obtained when the Pt precursor is heated in EG without NaOH (Figure 1, right).
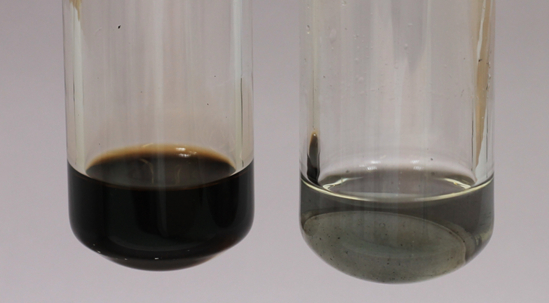
Figure 1: Photograph of the colloidal suspensions of Pt NPs in EG. (Left) Well-dispersed Pt NPs were obtained by following the protocol 1.1. (Right) Agglomerated Pt NPs obtained by heating the Pt precursor in EG without NaOH.
Well-dispersed Pt/C catalyst is obtained from the protocol section 1.2, as shown in Figure 2a. When a less stable colloidal suspension, e.g., of larger Pt NPs is used, significant agglomeration of Pt NPs on the carbon support might be observed (Figure 2b).
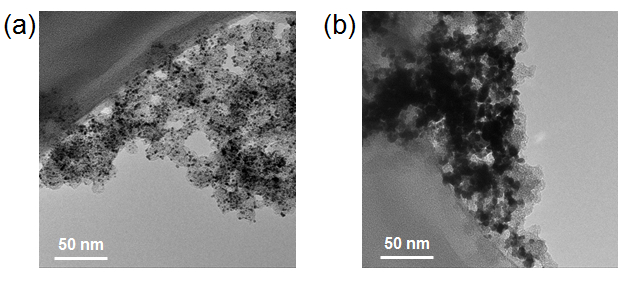
Figure 2: TEM images of 50 wt.% Pt/Vulcan catalysts. (a) 2 nm Pt NPs are well-dispersed on the carbon supports. (b) 4 nm Pt NPs are agglomerated on the carbon supports.
Representative results of the UV-Vis measurement for the determination of the Pt concentration in aqua regia (protocol 2.4) are shown in Figure 3a. When SnCl2 is added to the aqua regia sample, the Pt in the aqua regia is reduced from Pt(IV) to Pt(II), leading to a yellow colored solution. Figure 3b is the calibration curve obtained from the spectra in Figure 3a. From this calibration curve, the Pt concentration in the sample mixture is determined to be 3.68 ppm.
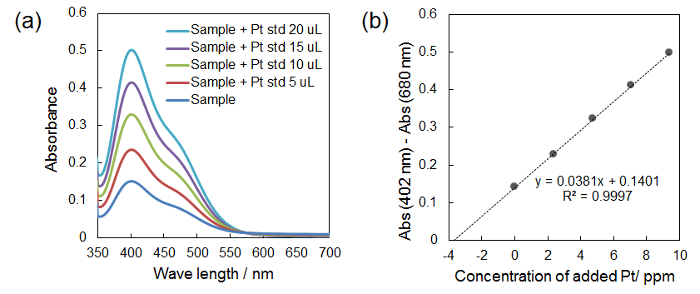
Figure 3: Representative results of the UV-Vis measurement for determination of Pt concentration in aqua regia. (a) UV-vis spectra of aqua regia sample with SnCl2 before and after adding the Pt standard solution (5-20 µL). (b) Calibration curve obtained by plotting differences between the absorbance at 402 nm and the absorbance at 680 nm against the concentration of the added Pt. The Pt concentration in the sample solution is determined from the x-intercept of the calibration curve. Please click here to view a larger version of this figure.
Figures 4a-b are representative examples of a homogeneous catalyst thin film fabricated on a GC electrode by following the protocol 3.2. The whole surface of the GC electrode is covered by the catalyst film uniformly without any significant agglomeration. Figure 4c-d are typical inhomogeneous catalyst thin films fabricated by drying the catalyst ink in air. The catalyst agglomerates on the edge of the GC electrode and forms a so-called coffee ring19.
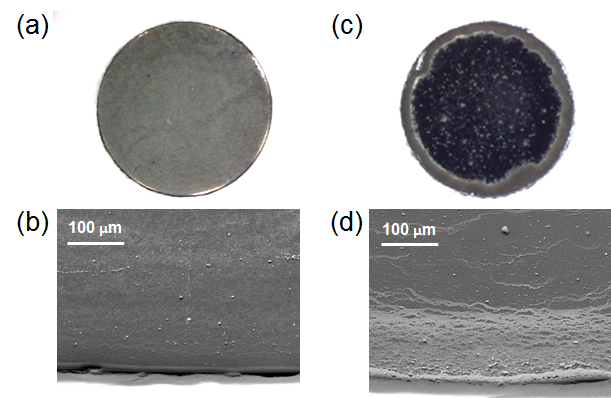
Figure 4: Photographs and SEM images of homogeneous and inhomogeneous catalyst thin film fabricated on a GC electrode. (a,b) Homogeneous catalyst thin film fabricated by following the protocol. (c,d) Inhomogeneous catalyst thin film with a "coffee ring" fabricated by drying the catalyst ink in air. (a) and (c) are whole pictures of the catalyst thin films. (b) and (d) are SEM images of the catalyst thin films taken at the edge of the GC disks.
Figure 5 is an example of a cyclic voltammogram measured in H2 saturated electrolyte for calibration of the reference electrode potential against RHE (protocol 3.3.5). The average of the potentials where the current density is 0 mA cm-2 both in the positive going scan and the negative going scan is defined as '0 V vs. RHE'.
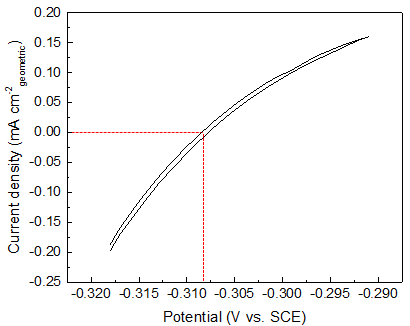
Figure 5: Cyclic voltammogram in H2 saturated electrolyte for the calibration of the potential the reference electrode against RHE (50 mV s-1, 1600 rpm). The average of the potentials where the current density is 0 mA cm-2 both in the positive going scan and the negative going scan is defined as 0 V vs. reversible hydrogen electrode (RHE) (see dotted red lines).
Shown in Figure 6 are cyclic voltammograms in Ar saturated electrolyte and linear sweep voltammograms (LSV) in O2 saturated electrolyte for the 50 wt% Pt/Vulcan catalyst obtained from the RDE measurement (protocol 3.3.7 and 3.3.8). After sufficient cleaning cycles in the protocol step 3.4.6, the red CV in Figure 6a is obtained. When the catalyst is not sufficiently cleaned, the shoulder of the Pt oxidation peak around 0.8 V is less sharp than that of the well-cleaned catalyst (Figure 6a, gray CV). The shape of the LSV in the O2 saturated electrolyte is highly sensitive to the quality of the catalyst thin film (Figure 6b). When the catalyst thin film is homogeneous like in Figure 4a, the O2 diffusion limiting current density (below 0.8 V) is observed around -6 mA cm-2, and the shoulder of the LSV curve around 0.8 V is sharp (Figure 6b, red). On the other hand, the O2 diffusion limiting current density is smaller and the shoulder of the LSV curve is less sharp when the catalyst thin film is nonhomogeneous, as in Figure 4c, or the surface of the GC electrode is not fully covered with the catalyst thin film.
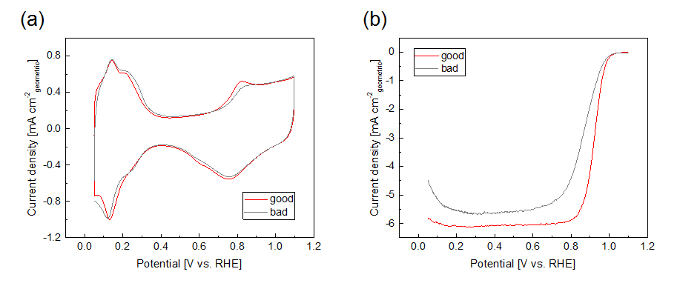
Figure 6: Representative examples for "good" and "bad" voltammograms for the 50 wt% Pt/Vulcan catalyst. (a) Cyclic voltammograms in Ar saturated electrolyte (50 mV s-1). (b) LSVs in O2 saturated electrolyte (1,600 rpm, 50 mV/s, positive going scan, background subtracted, iR compensated). Please click here to view a larger version of this figure.
Shown in Figure 7 are a cyclic voltammogram recorded in Ar-saturated electrolyte with the Hupd area indicated (a) and a CO stripping voltammogram with the stripping charge indicated (b). Both measurements were obtained for a 50 wt% Pt/Vulcan catalyst. From the area under the peaks, the Pt surface area (ECSA) is calculated, see step 3.4.1.
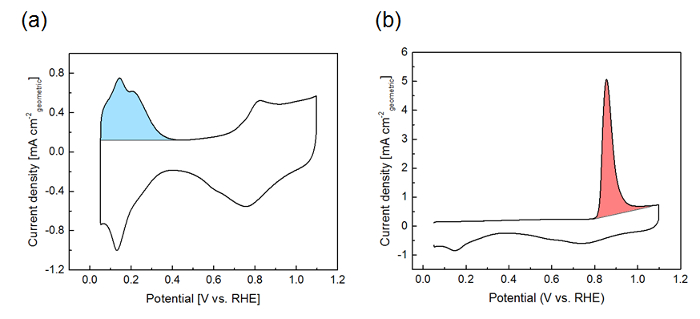
Figure 7: Representative cyclic voltammogram (a) and CO stripping voltammogram (b) for the 50 wt% Pt/Vulcan catalyst (50 mV s-1). The Hupd charge and the CO stripping charge are highlighted in sky blue and pink, respectively. Please click here to view a larger version of this figure.
Results of the RDE measurement of the 50 wt% Pt/Vulcan catalyst (ECSA, ORR specific activity and mass activity at 0.9 VRHE) are summarized in Table 1. The results for the commercial Pt/C catalyst with similar Pt particle size and similar Pt loading are shown in the table as well.
| Pt particle size | ECSA | ORR specific activity | ORR mass activity | |
| [nm] | [m2 g-1Pt] | [µA cm-2Pt] | [A g-1Pt] | |
| 50 wt.% Pt/Vulcan | 2 | 102 ± 3 | 852 ± 66 | 879 ± 82 |
| 46 wt.% Pt/C (TKK) | 2-3 | 93 ± 3 | 738 ± 30 | 683 ± 31 |
Table 1: Summary of results of the TF-RDE measurements for the 50 wt% Pt/Vulcan catalyst and the commercial 46 wt% Pt/C catalyst. The measured values are shown with standard deviation. ECSA = electrochemical surface area, ORR = oxygen reduction reaction, TKK = Tanaka Kikinzoku Kogyo.
Discussion
Loading...
$$\rightleftharpoonup{xx}$$
$$\longleftharp{xx}$$,
$$\longrightharp{xx}$$,
It is well known that the ORR activity of high surface area catalysts measured by the TF-RDE technique highly depends on the uniformity of the catalyst thin film6,9,10,14,19. Several groups have reported fabrication methods for homogeneous catalyst thin films on GC electrodes and researchers should carefully optimize their drying method when entering this research area20. Using rotational methods19 allows more flexibility in coating of thicker catalyst films, whereas stationary methods have the advantage that multiple electrodes can be prepared at the same time. As an example of a stationary drying method, Shinozaki et al. recently reported that uniform catalyst thin films are fabricated by drying the catalyst ink in an IPA atmosphere10. The fabrication of the catalyst thin films in this protocol is based on their method. However, the catalyst inks are dried in a humidified gas flow instead of a stationary atmosphere (protocol 3.3.2). The advantage of this modified method is that the drying condition can easily be adjusted by changing the ratio between IPA and water in the bubbler. Figure 8 indicates that the uniformity of the catalyst thin film is optimized by changing the condition of the humidification.
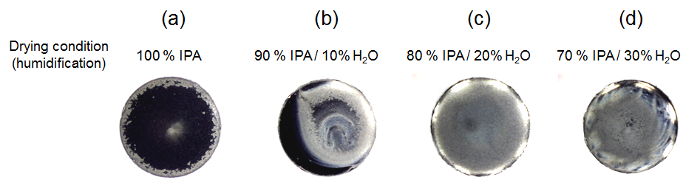
Figure 8: Photographs of the catalyst thin film fabricated on GC electrodes with various drying conditions. The ratio between isopropanol (IPA) and H2O in the bubbler was changed to optimize drying conditions. (a) 100% IPA, (b) 90% IPA / 10% H2O, (c) 80% IPA / 20% H2O, (d) 70% IPA / 30% H2O. (c) features the best drying conditions in this case, as the most homogeneous catalyst thin film is fabrication on the GC electrode. Please click here to view a larger version of this figure.
We also found that the pH of the catalyst inks is an important parameter to be optimized to obtain homogeneous catalyst thin films, as reported in the literature14. Figure 9 demonstrates the varying stability of catalyst inks with different pH. Since HCl is used for the washing of Pt NPs in the protocol 1.3.3, the catalyst ink usually becomes acidic without the addition of KOH. The acidic catalyst ink is not particularly stable and most of the Pt/C catalyst particles settle to the bottom 1 week after the sonication. The neutral ink is more stable than the acidic ink, even though some precipitates are seen in the bottom. The alkaline ink is the most stable and no precipitate is seen 1 week after the sonication. This pH dependence of the catalyst ink stability is explained by the magnitude of the zeta potential, which becomes larger with increasing pH14.
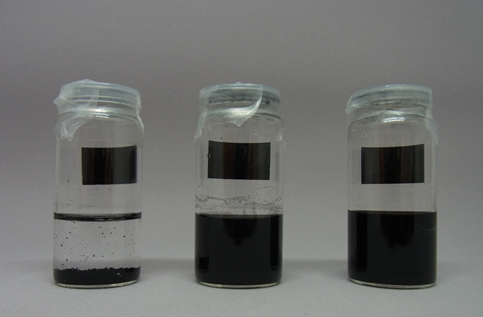
Figure 9: Photographs of the catalyst inks with different pH: (left) pH ≈ 4, (middle) pH ≈ 7, (right) pH ≈ 10. The photographs are taken 1 week after the sonication. The dispersion of the acidic ink is much less stable than the neutral and the alkaline ink.
Not only the stability of the catalyst inks, but also the uniformity of the obtained catalyst thin film depends on the pH of the catalyst ink. Highly agglomerated catalyst thin films are obtained when acidic inks are used (Figure 10a,d). Although there is no significant difference visible to the eye between the catalyst thin films fabricated from the neutral ink and from the alkaline ink (Figure 10b,c), SEM images reveal that there are some agglomerates in the catalyst thin film obtained from the neutral ink, whereas no significant agglomerates are seen in the catalyst thin film obtained from the alkaline ink (Figure 10e,f).
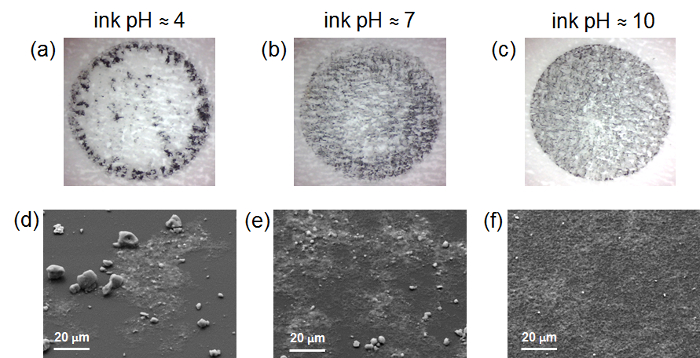
Figure 10: Photographs of the catalyst films transferred on a paper (a-c) and SEM images of the catalyst films on GC electrodes (d-f). (a,d) Catalyst film fabricated from acidic (pH ≈ 4) ink, (b,e) Catalyst film fabricated from neutral (pH ≈ 7) ink, and (c,f) Catalyst film fabricated from alkaline (pH ≈ 10) ink. Please click here to view a larger version of this figure.
In addition to the catalyst film quality, the scan rate4 and the compensation of the cell resistance influences the ORR activity determination8. In our measurement setup, the cell resistance without iR-compensation is usually around 30 Ω. It is decreased to be less than 3 Ω by using the iR-compensation of the potentiostat (Figure 11a,b). The LSVs measured in O2 saturated electrolyte with and without iR-compensation are compared in Figure 11c. A noticeable potential shift due to the cell resistance is seen at around 0.9 VRHE, where ORR activity is evaluated. As a scan rate for the LSV, we chose 50 mV s-1, while other groups5 prefer 20 mV s-1 and membrane electrode assemblies (MEAs) are often tested under steady state conditions4. In general, it can be stated for TF-RDE studies that the lower the scan rate, the more the measurement becomes susceptible to possible contaminations. In MEA testing, considerably higher currents are applied. In particular for automotive applications, high power performance is particularly interesting21. Scanning the potential would lead to significant errors if no online iR compensation is applied.
Due to these differences, direct predictions of MEA performance based on TF-RDE measurements should be taken with caution. The TF-RDE should be seen as a fast method to screen test the intrinsic ORR activity of PEMFC catalysts, rather than an alternative to MEA testing.
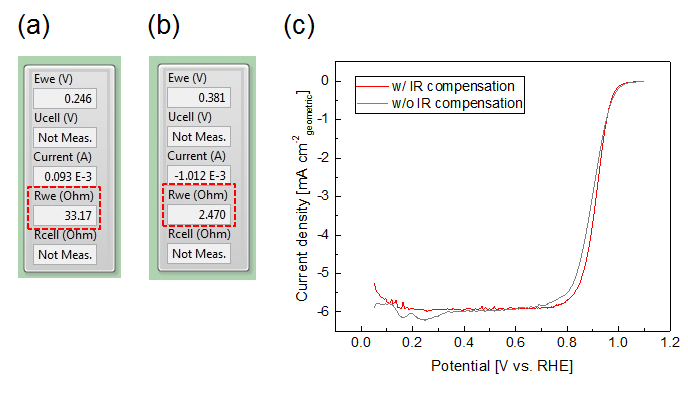
Figure 11: Influence of iR-compensation on the measurement. (a,b) Screenshots of the interface of "EC4 DAQ" program with and without iR-compensation. (c) LSVs measured in O2 saturated electrolyte with iR-compensation (red) and without iR-compensation (gray) (50 mV s-1, 1,600 rpm, back ground subtracted). Please click here to view a larger version of this figure.
The overall procedure is summarized in Figure 12. In addition to the discussed standard characterization methods, the obtained colloidal Pt NPs suspension and Pt/C catalyst can also be investigated by more advanced methods such as small angle X-ray scattering (SAXS)22 or X-ray absorption spectroscopy (XAS)23.
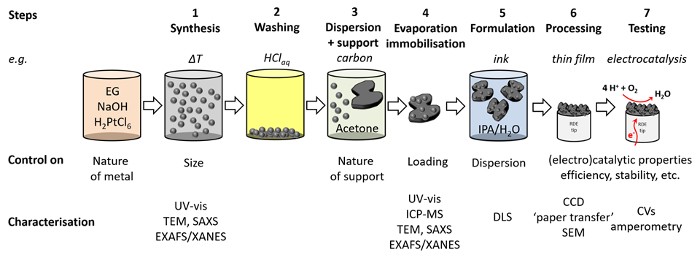
Figure 12: Overview of the experimental steps. Corresponding characterization methods and controllable parameters for each experimental step in this protocol are shown. TEM = transmission electron microscopy, SAXS = small angle X-ray scattering, EXAFS = extended X-ray absorption fine structure, XANES = X-ray absorption fine structure, ICP-MS = inductively coupled plasma mass spectrometry, DLS = dynamic light scattering, CCD = charge-coupled device, SEM = scanning electron microscopy. Please click here to view a larger version of this figure.
Disclosures
Loading...
$$\rightleftharpoonup{xx}$$
$$\longleftharp{xx}$$,
$$\longrightharp{xx}$$,
The authors have nothing to disclose.
Acknowledgements
Loading...
$$\rightleftharpoonup{xx}$$
$$\longleftharp{xx}$$,
$$\longrightharp{xx}$$,
J.Q. and M.A. acknowledge support from the Villum Foundation in form of a block stipend. M.I. and M.A. acknowledge support from Toyota Central R&D Labs., Inc. J.Q. has received funding from the European Union's Horizon 2020 research and innovation program under the Marie Skłodowska-Curie grant agreement No 703366.
Materials
| Name | Company | Catalog Number | Comments |
|---|---|---|---|
| Ethylene glycol | Sigma-Aldrich | 293237-1L | 99.8% |
| Sodium hydroxide | Fisher Chemical | AC134070010 | 98% |
| Hexachloroplatinic(IV) acid hexahydrate | Alfa Aesar | 11051 | 99.9% |
| Hydrochloric acid | Merck | 1003171000 | 37% |
| Nitric acid | Any | 60% | |
| Sulfuric acid | Any | 96% | |
| Perchloric acid | Merck | 1005170250 | 70%, Suprapur |
| Potassium hydroxide hydrate | Merck | 1050020500 | 99.995%, Suprapur |
| Tin(II) chloride dihydrate | Sigma-Aldrich | 31669-100G | >98% |
| Platinum standard for AAS | Sigma-Aldrich | 47037-100ML | 1000 mg/L ±4 mg/L |
| Acetone | Alfa Aesar | 30698 | 99.5+% |
| Isopropanol | Alfa Aesar | 36644 | 99.5% |
| Carbon black | Cabot | Vulcan XC 72R | |
| 46 wt.% Pt/C | Tanaka Kikinzoku Kogyo | TEC10E50E | |
| Ar gas | Air Liquide | 99.999% | |
| O2 gas | Air Liquide | 99.999% | |
| CO gas | Air Liquide | 99.97% | |
| H2 gas | Air Liquide | 99.999% | |
| Microwave reactor | CEM | Discover SP | |
| Centrifuge | Corning | 6759 | |
| Rotary evaporator | KNF | RC600 | |
| Ultrasonic bath | Qualilab | USR 54 H | 35 kHz, 160/320 W |
| Filter paper | Albet | DP595 055 | Retention rate 4-7 µm, φ55 mm |
| Crucible | VWR | 459-0202 | 12 mL |
| Lid for crucible | VWR | 459-0216 | φ35 mm |
| pH meter | VWR | Symphony SP70P | |
| Glass electrode (for pH meter) | Mettler Toledo | InLab Routine | |
| Light scattering | Anton Paar | Litesizer | |
| TEM microscope | FEI | Tecani Spirit | |
| TEM grid | Quantifoil | N1-C73nCu20-01 | Classic carbon film, Cu 200 mesh |
| TEM grid | Quantifoil | Classic holey carbon film, Cu 200 mesh | |
| TEM grid | Quantifoil | N1-C74nCu20-01 | Classic lacey carbon film, Cu 200 mesh |
| UV-vis spectrophotometer | Varian | CARY 5E | |
| Saturated calomel electrode | Schott | B3510+ | |
| Perfluorinated membrane | Fuel Cell Store | 591239 | Nafion 117 |
| RDE rotator | Raiometer Analytical | EDI101 | |
| Potentiostat | Nordic Electrochemisty | ECi 200 | |
| Control and data acquisition program | Nordic Electrochemisty | EC4 DAQ | |
| Data analysis program | Nordic Electrochemisty | EC4 VIEW |
References
Loading...
$$\rightleftharpoonup{xx}$$
$$\longleftharp{xx}$$,
$$\longrightharp{xx}$$,
- Stephens, I. E. L., Rossmeisl, J., Chorkendorff, I. Toward sustainable fuel cells. Science. 354 (6318), 1378-1379 (2016).
- Chen, C., et al. Highly Crystalline Multimetallic Nanoframes with Three-Dimensional Electrocatalytic Surfaces. Science. 343 (6177), 1339-1343 (2014).
- Schmidt, T. J., et al. Characterization of high-surface area electrocatalysts using a rotating disk electrode configuration. J. Electrochem. Soc. 145 (7), 2354-2358 (1998).
- Gasteiger, H. A., Kocha, S. S., Sompalli, B., Wagner, F. T. Activity benchmarks and requirements for Pt, Pt-alloy, and non-Pt oxygen reduction catalysts for PEMFCs. Appl. Catal. B-Environm. 56 (1-2), 9-35 (2005).
- Kocha, S. S., et al. Best Practices and Testing Protocols for Benchmarking ORR Activities of Fuel Cell Electrocatalysts Using Rotating Disk Electrode. Electrocatalysis. 8 (4), 366-374 (2017).
- Mayrhofer, K. J. J., et al. Measurement of oxygen reduction activities via the rotating disc electrode method: From Pt model surfaces to carbon-supported high surface area catalysts. Electrochim. Acta. 53 (7), 3181-3188 (2008).
- Mayrhofer, K. J. J., Ashton, S. J., Kreuzer, J., Arenz, M. An Electrochemical Cell Configuration Incorporating an Ion Conducting Membrane Separator between Reference and Working Electrode. Intern. J. Electrochem. Sci. 4 (1), 1-8 (2009).
- Nesselberger, M., et al. The Particle Size Effect on the Oxygen Reduction Reaction Activity of Pt Catalysts: Influence of Electrolyte and Relation to Single Crystal Models. J. Am. Chem. Soc. 133 (43), 17428-17433 (2011).
- Ke, K., Hiroshima, K., Kamitaka, Y., Hatanaka, T., Morimoto, Y. An accurate evaluation for the activity of nano-sized electrocatalysts by a thin-film rotating disk electrode: Oxygen reduction on Pt/C. Electrochim. Acta. 72, 120-128 (2012).
- Shinozaki, K., Zack, J. W., Richards, R. M., Pivovar, B. S., Kocha, S. S. Oxygen Reduction Reaction Measurements on Platinum Electrocatalysts Utilizing Rotating Disk Electrode Technique. J. Electrochem. Soc. 162 (10), F1144-F1158 (2015).
- Zalitis, C. M., Sharman, J., Wright, E., Kucernak, A. R. Properties of the hydrogen oxidation reaction on Pt/C catalysts at optimised high mass transport conditions and its relevance to the anode reaction in PEFCs and cathode reactions in electrolysers. Electrochim. Acta. 176, 763-776 (2015).
- Wiberg, G. K. H., Fleige, M. J., Arenz, M. Design and test of a flexible electrochemical setup for measurements in aqueous electrolyte solutions at elevated temperature and pressure. Rev. Sci. Instr. 85 (8), 085105(2014).
- Wiberg, G. K. H., Fleige, M., Arenz, M. Gas diffusion electrode setup for catalyst testing in concentrated phosphoric acid at elevated temperatures. R Rev. Sci. Instr. 86 (2), 024102(2015).
- Inaba, M., Quinson, J., Arenz, M. pH matters: The influence of the catalyst ink on the oxygen reduction activity determined in thin film rotating disk electrode measurements. J. Power Sources. 353, 19-27 (2017).
- Cherevko, S., et al. Dissolution of Platinum in the Operational Range of Fuel Cells. ChemElectroChem. 2 (10), 1471-1478 (2015).
- Ware, B. R. Electrophoretic light scattering. Adv. Colloid Interface Sci. 4 (1), 1-44 (1974).
- Berne, B. J., Pecora, R. Dynamic Light Scattering, with applications to Chemistry, Biology and Physics. , Dover Publication Inc. (2000).
- Baranova, E. A., Bock, C., Ilin, D., Wang, D., MacDougall, B. Infrared spectroscopy on size-controlled synthesized Pt-based nano-catalysts. Surf. Sci. 600 (17), 3502-3511 (2006).
- Garsany, Y., Singer, I. L., Swider-Lyons, K. E. Impact of film drying procedures on RDE characterization of Pt/VC electrocatalysts. J. of Electroanal. Chem. 662 (2), 396-406 (2011).
- Garsany, Y., Baturina, O. A., Swider-Lyons, K. E., Kocha, S. S. Experimental Methods for Quantifying the Activity of Platinum Electrocatalysts for the Oxygen Reduction Reaction. Anal. Chem. 82 (15), (2010).
- Kongkanand, A., Mathias, M. F. The Priority and Challenge of High-Power Performance of Low-Platinum Proton-Exchange Membrane Fuel Cells. J. Phys. Chem. Lett. 7 (7), 1127-1137 (2016).
- Speder, J., et al. Pt based PEMFC catalysts prepared from colloidal particle suspensions - a toolbox for model studies. Phys. Chem. Chem. Phys. 15 (10), 3602-3608 (2013).
- Neumann, S., et al. Nanoparticles in a box: a concept to isolate, store and re-use colloidal surfactant-free precious metal nanoparticles. J. Mat. Chem. A. 5 (13), 6140-6145 (2017).
Reprints and Permissions
Request permission to reuse the text or figures of this JoVE article
Request Permission