This protocol describes in detail how to fabricate and operate microfluidic devices for X-ray diffraction data collection at room temperature. Additionally, it describes how to monitor protein crystallization by dynamic light scattering and how to process and analyze obtained diffraction data.
Method Article
Microfluidic Chips for In Situ Crystal X-ray Diffraction and In Situ Dynamic Light Scattering for Serial Crystallography
* These authors contributed equally
In This Article
Summary
Abstract
This protocol describes fabricating microfluidic devices with low X-ray background optimized for goniometer based fixed target serial crystallography. The devices are patterned from epoxy glue using soft lithography and are suitable for in situ X-ray diffraction experiments at room temperature. The sample wells are lidded on both sides with polymeric polyimide foil windows that allow diffraction data collection with low X-ray background. This fabrication method is undemanding and inexpensive. After the sourcing of a SU-8 master wafer, all fabrication can be completed outside of a cleanroom in a typical research lab environment. The chip design and fabrication protocol utilize capillary valving to microfluidically split an aqueous reaction into defined nanoliter sized droplets. This loading mechanism avoids the sample loss from channel dead-volume and can easily be performed manually without using pumps or other equipment for fluid actuation. We describe how isolated nanoliter sized drops of protein solution can be monitored in situ by dynamic light scattering to control protein crystal nucleation and growth. After suitable crystals are grown, complete X-ray diffraction datasets can be collected using goniometer based in situ fixed target serial X-ray crystallography at room temperature. The protocol provides custom scripts to process diffraction datasets using a suite of software tools to solve and refine the protein crystal structure. This approach avoids the artefacts possibly induced during cryo-preservation or manual crystal handling in conventional crystallography experiments. We present and compare three protein structures that were solved using small crystals with dimensions of approximately 10-20 µm grown in chip. By crystallizing and diffracting in situ, handling and hence mechanical disturbances of fragile crystals is minimized. The protocol details how to fabricate a custom X-ray transparent microfluidic chip suitable for in situ serial crystallography. As almost every crystal can be used for diffraction data collection, these microfluidic chips are a very efficient crystal delivery method.
Introduction
Knowing the 3D structure of a protein is essential to understand its functionality. Near-atomic resolution structures are so far most commonly obtained by X-ray crystallography. This technique exposes protein crystals to X-ray radiation and the resulting diffraction patterns are then analyzed for structure determination and refinement. In traditional X-ray crystallography, a complete diffraction dataset is recorded from a single, ideally large, crystal at cryogenic temperatures. Such crystals, however, are mostly not trivial to grow, and to identify suitable cryo-preservation conditions can become challenging in itself and may sometimes also cause deviations from the native protein structure5.
Recent technological advances in X-ray free-electron laser (FEL) and synchrotron beamlines have allowed to solve structures from smaller crystals, as new micro-focusing beamlines, increased X-ray beam brilliance, and improved X-ray detectors became available6,7. Typically, small crystals are easier to grow than large and defect free crystals8,9. However, small crystals suffer from X-ray radiation damage much faster than large crystals. This is because compared to a large crystal, a higher X-ray dose must be projected into a smaller crystal volume to diffract to comparable resolution. Therefore, even cryogenic protection is often not sufficient to record a complete diffraction data set from a single microcrystal.
To overcome this hurdle, serial crystallography has become the method of choice to collect and merge diffraction patterns from many randomly oriented microcrystals to obtain a complete dataset. Radiation induced crystal damage is minimized by spreading the total X-ray dose used to solve a protein structure over a high number of crystals5,10. In a 'diffract before destroy' FEL experiment, each crystal is only used for one exposure using femto-second X-ray pulses. Micro-focus beamlines at third generation synchrotron sources in turn can perform serial crystallography with a few millisecond short X-ray exposures11,12,13,14. Without a crystal oscillation or rotation during data collection, however, only partial Bragg reflections can be recorded and hence tens of thousands or more diffraction patterns are typically required for the structure determination15. To date, a diverse set of sample delivery methods has been developed for serial crystallography, as recently reviewed14,16,17,18,19. Amongst those, several fixed-target based sample delivery strategies were successfully combined with crystal rotation during X-ray exposures such that significantly fewer diffraction patterns can provide equally complete datasets while also consuming less sample compared to classical serial crystallography experiments where still images are recorded7,16,20,21,22,23,24.
We present a protocol to fabricate microfluidic devices with low X-ray background. The devices are patterned from 5-min epoxy glue using soft lithography and are suitable for in-situ X-ray diffraction experiments at room temperature that benefit from integrating the sample preparation directly into the X-ray set-up, as the case with time-resolved studies that follow mixing-induced kinetics18,19. Microfluidic channels are lidded on both sides with polymeric polyimide foil, resulting in X-ray windows with a combined thickness of about 16 µm that allow for low X-ray background imaging. All used materials provide good solvent resistance. This fabrication method is comparably simple and inexpensive. After the sourcing of a SU-8 master wafer, all fabrication can be completed outside of a cleanroom in a typical research lab setting.
In an application example, we describe chips for goniometer based fixed target serial crystallography. First, the design and fabrication considerations for using capillary valving to microfluidically split an aqueous reaction into a selected number of nanoliter sized droplets are discussed. This loading mechanism avoids the sample loss from channel dead-volume and splitting can easily be performed manually without using pumps or other equipment for fluid actuation. Such isolated nanoliter sized drops of protein solution are monitored in situ using dynamic light scattering (DLS) to control protein crystal nucleation and growth. It has previously been demonstrated that DLS measurements can be performed in microfluidic devices consisting of a polydimethylsiloxane (PDMS) structure bonded to a glass slide25,26. Because the polyimide layer has a high transmission for wavelengths longer than 550 nm, the approach can be extended to measurements in X-ray transparent chips as well, when using an appropriate laser wavelength27,28. Based on the DLS results, initial nucleation can be observed, and further droplet evaporation can be stopped to obtain fewer but larger protein crystals.
After sufficient crystals are grown, complete X-ray diffraction datasets can then be collected using goniometer based in situ fixed target serial X-ray crystallography at room temperature. Diffraction datasets are processed using a suite of software tools and custom scripts to solve the protein crystal structure. This technique avoids artefacts often induced during cryo-preservation used in conventional crystallography experiments.
We compare three protein target structures that were solved using about 10-20 µm small crystals grown in chip to better then 2 Å resolution. By crystallizing and diffracting in situ, handling and hence mechanical disturbances of fragile crystals is minimized. This protocol can be applied for protein crystals which diffract to high resolution as well as low resolution (1.7 Å to 3.0 Å). As almost every crystal can be used for diffraction, little sample is wasted, making this a very efficient crystal delivery method.
This protocol provides a detailed guide on how to prepare X-ray transparent microfluidic chips for in situ protein crystallization and diffraction data collection. The procedure was carefully designed to benefit from microfluidic precision without requiring sophisticated equipment in the lab. Also, data collection at the synchrotron beamline can be performed without requiring a specialized goniometer or humidifier to ease reproducing the results by non-experts. The presented technique can be applied for serial millisecond crystallography data collection at room-temperature while keeping the radiation damage minimal and without introducing stress to the crystals after growth by cryo-protection or crystal handling. Hence, the described method is suitable for any protein crystallization project.
Protocol
1. Chip Design and Master Fabrication
- Mask design
- Outline desired channel geometries using a suitable CAD drawing program. For each photoresist layer, prepare an individual mask. All designs used in this protocol are discussed in detail in the results section and are available as AutoCad '.DWG' format in the Supplementary File 1.
NOTE: For building all-PDMS devices, the channel height-to-width aspect ratio should not exceed 1:10 to prevent channel collapse. Both polyimide foil and cured epoxy resin are sturdier and in principle should allow also higher aspect ratios. However, we purposely did not exceed the 1:10 ratio, so that initial designs could be prototyped as traditional PDMS devices. - Translate CAD-files into emulsion film photomasks. Use a nominal 64k DPI resolution to allow accurate features down to about 5 µm size.
NOTE: This can be done through a commercial service. Imaging services may prefer different drawing conventions to streamline file conversion for mask imaging. Please inquire about the preferred drawing conventions upfront to avoid laborious trouble shooting during the conversion. Masks with transparent features on black background will pattern SU8 photoresist features onto the wafer to yield functional PDMS microchannels during replica molding. In turn, black features on transparent background masks are needed to prepare PDMS molds suitable for X-ray chip fabrication. We recommend ordering both mask polarities to allow for early prototyping and design validation to fabricate PDMS devices before translating the design into X-ray chips.
- Outline desired channel geometries using a suitable CAD drawing program. For each photoresist layer, prepare an individual mask. All designs used in this protocol are discussed in detail in the results section and are available as AutoCad '.DWG' format in the Supplementary File 1.
- SU8 master fabrication
NOTE: This is the only process that needs to be performed in a cleanroom. If critical cleanroom equipment is not available, the complete step can be outsourced to MEMS foundry service companies that deliver ready patterned SU8 masters. Process SU8 according to the data sheet instruction. Steps 1.2.1 to 1.2.4 summarize the general SU8 master fabrication workflow, with the complete parameters for the three-layer X-ray chip design listed in Table 1. An introduction to multi-layer SU8 alignment has been published previously29.- Pour about 1 mL of SU8 resist onto the 3 inch wafer and spin coat the SU8 down to the desired thickness using appropriate spin speed and time as specified in Table 1 (Figure 1, step 1). Pre-bake the photoresist according to the layer thickness at 65 °C and 95 °C for a few minutes each. Perform the pre-bake to solidify SU8 to prevent it sticking to the photomask and to improve resist adhesion to the substrate (Figure 1, step 2).
- Expose the photoresist to UV-light as specified in Table 1 followed by a post-exposure-bake at 95 °C to catalytically complete the photoreaction that is initiated during the exposure (Figure 1, step 3).
- Repeat these steps for each subsequent layer. Then align the photomasks of the subsequent layer with the master using a mask aligner and Vernier caliper alignment marks29.
- Wash away all unexposed SU8 resist by developing the wafer in propylene glycol methyl ether acetate (PGMEA), until isopropanol rinsing no longer reveals milky precipitation (Figure 1, step 4). Dry the wafer with pressurized nitrogen.
NOTE: Isopropanol is a poor solvent for SU8 and its precipitation indicates residual uncured remains.
- PDMS mold fabrication
- Place a piece of aluminum foil (15 × 15 cm) into a Petri dish (10 cm) and place the SU8 master onto the aluminum foil into the Petri dish for easy removal of the master after PDMS curing.
- Mix silicone base with curing agent (10:1), resulting in a total amount of 25 g, vigorously with a spatula in a jar or a mechanical mixer. A 3 inch wafer in a Petri dish (10 cm) consumes about 25 g of PDMS to result in a 5 mm thick slab.
- Pour pre-mixed PDMS onto the SU8-master (Figure 1, step 5) to a height of 4 mm. Desiccate the PDMS for 5 min to remove air-bubbles until no, or only few bubbles remain on the PDMS surface.
- Cure the PDMS in an oven at 70 °C for 1 h. Then cut out the cured PDMS with a scalpel and gently peel the PDMS mold from the SU8 master (Figure 1, Step 6). Cut all the way down to the master to prevent PDMS cracks during peeling.
- Optional: Prepare cross-sectional slices of the PDMS molds to confirm that all SU8-layers on the master have the desired thicknesses (Figure 1). Early microfluidic channel layout testing can be performed in all PDMS chips.
NOTE: A replica-molded PDMS can be bonded directly to a glass substrate after punching access ports (step 3.3) into the PDMS through O2 plasma activation using 20 s, 0.4 mbar O2, 50 W, 13.56 MHz. As noted in Section 1.2., this requires opposite mask polarity and hence wafer outline for X-ray chip fabrication.
2. In Situ X-ray Chip Fabrication
- Dilute both epoxy resin precursors in ethanol to a final ethanol concentration of 40 wt%. A total mass of 0.25 g of each epoxy resin precursor in ethanol is sufficient for one 1 cm2 chip.
NOTE: This reduces the viscosity of the resulting 5 min epoxy to simplify bubble-free mixing and replica-mold casting, and to minimize the thickness of the final cured epoxy layer. The ethanol evaporates through the PDMS during the curing step. - Degas the PDMS mold in a vacuum desiccator for 30 min, so that it can absorb small air bubbles from the epoxy resin during the molding step.
- Cut the polyimide foil to about 70 × 70 mm and span it around a 75 × 50 mm glass slide using tape to obtain a flat and rigid surface with the tape on the backside. Plasma activate the foil with 50 W, 13.56 MHz, 0.4 mbar O2 plasma for 20 s, then incubate the complete foil-slide in an aqueous solution of 1 vol% (3-aminopropyl)trimethoxysilane (APTS) or (3-glycidyloxypropyl)trimethoxysilane (GPTS) for 5 min at 20 °C.
- Thoroughly mix both ethanol diluted epoxy precursor solutions to ensure optimal curing behavior. Retrieve PDMS-molds from the vacuum chamber and place them onto a flat surface. Then quickly dispense a droplet of mixed resin onto each microstructure on the mold using a micropipette (about 10 µL per 1 cm2 of microstructures) (Figure 1, step 7a).
- Retrieve the polyimide foil-slide sandwich from the aqueous silane (APTS or GTPS) solution. Dry the foil with pressurized air or nitrogen.
- Place the prepared polyimide foil-glass-slide sandwich onto the deposited epoxy resin (Figure 1, step 7b). Firmly press the glass slide attached to the polyimide foil against the PDMS mold. Place a metal sheet onto the glass slide and then deposit weights to apply up to 1.4 N/cm2 pressure for 1 h, while the epoxy resin cures at room temperature.
NOTE: Ideally, no resin remains on the foil in the areas where the structures in the mold have the maximal height. These correspond to the crystallization wells where the crystallization takes place afterwards.- Optional: If accurate molding of small features is critical, the PDMS mold can be reinforced with an aluminum frame during the molding step31.
- Remove the glass slide with the polyimide foil and the patterned epoxy by peeling it from the PDMS mold (Figure 1 step 8). Plasma activate the patterned epoxy side with 50 W, 13.56 MHz, 0.4 mbar O2 plasma for 20 s.
- After the removal of the polyimide foil from the plasma chamber, incubate the epoxy-patterned foil in a 1 vol% aqueous APTS (or GPTS) solution for 5 min at 20 °C. Similarly, prepare a second un-patterned polyimide foil with the complementary 1 vol% GPTS (or APTS) silane activation. After the incubation, dry both structured and unstructured foil with pressurized air.
- Position the epoxy side face up on a flat surface, using the surface tension of a drop of water underneath as a mediator to prevent curling of the foil and to ensure maximal flatness. Then place the second activated polyimide foil on top and gently streak with your finger from one corner to the opposite to make them bond and to avoid the formation of bubbles.
3. Access Ports for Fluid Delivery
- Prepare 4 mm thick PDMS slabs in a Petri dish according to steps 1.3.1 to 1.3.3 without using the SU8-master. Cut the slab into PDMS blocks of appropriate size to cover all inlet ports in the chip, without covering the individual crystallization compartments of the chip.
- Plasma activate both, the chip and the PDMS block in 50 W, 13.56 MHz, 0.4 mbar O2 plasma for 20 s. For chemical bonding, then incubate each part in a 1 vol% aqueous APTS or GPTS solution for 5 min at 20 °C. Dry each part with pressurized air and press the PDMS slab onto the foil chip.
- To improve bonding, place the chip on a flat PDMS slab, and cover it with a plastic foil, followed by a clean glass slide and a metal block. Finally, deposit weights to apply up to 1.4 N/cm2 pressure for about 1 h.
- Punch access holes with a 0.75 mm biopsy punch at each position where inlet and outlet ports are marked in the chip design and seal the back with tape. The chip is now accessible for any tubing with an outer diameter matching the diameter of the hole (as detailed in step 4.2).
4. Surface Treatment
- Prepare a 1:20 dilution of 9 wt% fluoropolymer stock in fluoro-solvent to a final concentration of 0.45 wt%. Store the stock solutions and dilutions in a fridge in the dark at 4 °C.
- Load the 1:20 fluoropolymer dilution into a 1 mL Luer-lock syringe. Attach a 27G × 5/8" needle to the syringe and then a PTFE tubing to the needle.
- Connect the tubing to the X-ray chip outlet and inject the fluoropolymer working solution prepared in step 4.1 until all channels are filled.
- Place the chip with the flat side down on a 190 °C hot plate for 5 min to evaporate all solvent to deposit the fluoropolymer into a thin film coating.
NOTE: When using a new geometry, check if channels were clogged with fluoropolymer during this coating process. If so, further dilute the stock solution.
5. Protein Preparation
- Weigh lyophilized thaumatin and dissolve it in a buffer solution listed in Table 2 to the appropriate volume to obtain a final protein concentration of 40 mg mL-1.
- Dialyze glucose isomerase against the buffer listed in Table 2 according to the manufacturer protocol.
- Prepare the protein thioredoxin as described previously by Schubert et. al.30.
- Verify the final protein concentrations photometrically using the extinction coefficients summarized in Table 2, calculated by the software ProtParam32.
- Prepare all solutions using ultrapure water and filter them with a 0.2 µm filter.
- Centrifuge the protein solutions at 20 °C for 15 min at 16100 x g, and take the supernatant for crystallization experiments.
6. Protein Crystallization in X-ray Chip
- To crystallize proteins in microfluidic chips, mix equal amounts of protein solution and precipitant solution. Protein concentration, buffer composition and precipitant composition are summarized in Table 2. Prepare a total volume of around 20 µL to fill a microfluidic chip.
- Immediately after mixing, inject the solution into the inlet port of the chip via a syringe, coupled to a 27G × 5/8" needle and PTFE tubing with 0.75 mm outer diameter (detailed in step 4.2).
NOTE: The filling procedure for the serial layout requires a prior priming of the chip with fluorinated oil, which is easiest done by loading the fluorinated oil from the outlet port before injecting the crystallization solution through the inlet port. All loading steps should be monitored using a microscope to control the applied syringe pressure and the corresponding flow rate.” - After the chip is filled, separate the individual crystallization compartments by injecting fluorinated oil into the inlet port of the chip. Seal the chip by blocking all inlet and outlet ports of the chip. This may be done by inserting a paperclip.
NOTE: Because the crystallization compartments are filled by protein/precipitant solution, the fluorinated oil only fills the inlet channel of the chip, without affecting the solution in the crystallization compartments. - To mimic vapor diffusion crystallization kinetics, place the sealed chip at ambient temperature and normal atmosphere to allow the droplet in the crystallization compartment to shrink by the evaporation of water through the polyimide foil.
- After crystal formation is observed via a microscope or DLS measurements (step 7), transfer the complete microfluidic chip into the appropriate precipitant solution, to stop further evaporation from the crystallization wells until the X-ray diffraction experiment is performed.
7. Dynamic Light Scattering Measurements in Crystallization Wells in Chip
NOTE: DLS measurements were performed with a laser output power of 100 mW, a wavelength of 660 nm and the scattered light was detected at a scattering angle of 142°. Because all investigated sample solutions were aqueous the refractive index of water (n = 1.33) was used in all calculations.
- Place the microfluidic chip in the in the SBS format plate holder of the DLS instrument by using the adapter described in step 8.1. Insert the adapter into the device.
- Carefully adjust the laser focus inside a compartment of the microfluidic chip by using the motorized x-,y-,z-stage. Because the microfluidic chip is very thin, adjust the z-level by applying small increment steps.
NOTE: A correct adjustment is confirmed by a high intercept and a smooth tail of the resulting autocorrelation function of the DLS measurement. A calibration file can be created to match the position of each individual crystallization well in the microfluidic chip, allowing automated DLS measurements in several compartments over time. - Perform each DLS measurement at 293 K for 30 s and repeat the measurement every 5 min until the end of the crystallization experiment.
NOTE: Initial nucleation can be followed by the radius distribution of the DLS measurements over time and successful crystal formation can in parallel be followed by the in-built microscope of the DLS plate reader.
8. Diffraction Data Collection
- Adapters for beamline goniometers
- Print the adapters for the plate goniometer to position and rotate the X-ray chips during crystallographic data collection.
- Fabricate the adapters for the base goniometer on a hobby-grade 3D printer using default parameter settings as recommended by the manufacturer.
NOTE: The adapters were designed using a 3D-CAD-System and the coordinate files of the adapters are attached in ‘.STL’-file format in the supplement. - Fix the X-ray chips to the adapter using double sided tape.
- in situ x-ray crystallography
- Collect diffraction data using a beam size of 10 × 5 µm (FWHM of Gaussian profile) at 296 K. Use X-rays with an energy of 12.8 keV and a flux of 2.2 · 1011 photons · s-1 in the attenuated beam and record diffraction patterns using a Pilatus 6M hybrid pixel detector.
NOTE: Microfluidic devices containing thaumatin, glucose isomerase or thioredoxin crystals are used for in situ X-ray crystallographic experiments at the EMBL beamline P14 of the PETRA III synchrotron. Available beam focus size and flux may differ at other X-ray sources. The number of exposed protein crystals, the number of diffraction patterns recorded from each crystal, the oscillation angle range per exposure, and the exposure time are summarized in Table 3. - Process sets of two consecutive diffraction pattern individually using the program XDS33. Use the bash script "xds.sh" found in the supplement.
- Create HKL files for each dataset from all crystals and scale them using the software XSCALE33. Use the bash script "xscale.sh" in the supplement to create an input file for XSCALE.
NOTE: Only datasets of crystals that have correlation coefficients larger than 90 %, which indicates a high degree of isomorphism, should be scaled. The conservative criterion ‹I/σ(I)› (>2) should be used to determine the highest resolution shell. Molecular Replacement using the program MOLREP34 from the CCP4 suite35 can be used to obtain the phases for further model building by using the 3D coordinates of the Protein Data Bank (PDB) shown in Table 3. - Refine all structures isotopically using Refmac535,36 and use COOT37 for visual inspection of the final model.
NOTE: Solvent molecules should be added automatically during the refinement process and need to be checked to confirm chemically reasonable positions. All models must be inspected to identify Ramachandran outliers.
- Collect diffraction data using a beam size of 10 × 5 µm (FWHM of Gaussian profile) at 296 K. Use X-rays with an energy of 12.8 keV and a flux of 2.2 · 1011 photons · s-1 in the attenuated beam and record diffraction patterns using a Pilatus 6M hybrid pixel detector.
9. Data Evaluation
- Radiation damage
- Analyze the decay of diffraction power over time using a method described by Owen et al38. For this, calculate the total sum of I/σ(I) (provided by XDS33) of all indexed reflections of each evaluated diffraction dataset (2 consecutive diffraction pattern), to use as a reference value. Use the bash script "ISigma.sh" from the supplement.
- Normalize the diffraction power of each dataset to the mean diffraction power of the first dataset.
- Analyze the change of the Rmeas values over time by taking the Rmeas values from the Correct.LP files obtained from XDS33 (bash script "Rmeas.sh" from the supplement).
- Crystal orientation
- Determine the Euler angles to obtain information about the distribution of the crystal lattice orientations in respect to the laboratory coordinate system. Calculate the Euler angles from the XDS orientation matrix given in the output file XPARM39 using the software Matlab. Use the bash script "rotation_matrix.sh" to extract the rotation matrix from each crystal from the XPARM file. Use the output file as input in Matlab to calculate the Euler angles using the Matlab function rotro2eu.m (supplementary file).
NOTE: A detailed description of the calculation has been published by Zarrine-Afsar et al40. - Convert the obtained Euler angles from radians to degrees. Group the obtained Euler angles for all three rotation planes (xy, xz and zy) in classes of 10° and plot them by using the software Origin9.
- Determine the Euler angles to obtain information about the distribution of the crystal lattice orientations in respect to the laboratory coordinate system. Calculate the Euler angles from the XDS orientation matrix given in the output file XPARM39 using the software Matlab. Use the bash script "rotation_matrix.sh" to extract the rotation matrix from each crystal from the XPARM file. Use the output file as input in Matlab to calculate the Euler angles using the Matlab function rotro2eu.m (supplementary file).
Results
Epoxy is an excellent filling material for X-ray chip fabrication. It is cheap, simple and robust to process without requiring specialized tools (Figure 1). Reducing epoxy viscosity by diluting it with 40 wt% ethanol facilitated the removal of excess resin above the crystallization well, resulting in defined X-ray windows. Higher ethanol dilutions resulted in defects in the cured resin. By analyzing X-ray chip cross-sections, we determined the total window thickness of both sides to be about 19 µm thick, which is very close to the nominal thickness of the used polyimide foils of 2 × 7.5 µm (Figure 2)
Crystallization trials were isolated into several nanoliter sized reaction compartments each, using a capillary valve mechanism as described previously41. This 'store-then-create' loading technique avoids the sample loss from channel dead-volume and can easily be performed manually, eliminating the need to use pumps or other equipment for fluid actuation42. The chip is primed with fluorinated oil before loading the aqueous sample. The surface tension at the oil-water interface between priming oil and aqueous sample results in a pressure difference across the interface. This Laplace pressure depends on both the radius of curvature and the surface tension of the interface. To minimize its energy, the interface must minimize its surface, which is equivalent to maximizing its main radii of curvature at constant volume. A low curvature interface in a wide channel has a lower Laplace pressure then a high curvature interface in a narrow channel segment. Therefore, the sample plug preferentially enters and flows through the wide bypass channel instead of flowing through the narrow capillary valve restrictions. Finally, the sample plug is followed by fluorinated oil to separate the sample wells into independent droplets.
Robust and reliable loading was achieved with flow rates of up to 1 mL/h in both, a serial and a parallel well arrangement (Figure 3). In the 'serial' layout, well inlet and capillary valve constrictions are sequentially connected through a bypass channel31. In contrast, in the 'parallel' layout, two separate main channels connect all well inlets or capillary valves only43. Both arrangement concepts have been previously combined with formulation control to screen composition, which is a useful aspect in protein crystallization43,44. The serial design has only two fluid ports, one inlet and one outlet. It has fewer liquid ports, and because of this, is simpler to build and operate. The parallel layout has 4 fluid ports, 2 for the main channel connecting the wells and 2 for linking up the capillary valves to let air or excess oil escape. Loading can hence proceed from both main channel sides. This layout has overall lower flow resistance for an equal number of wells due to its shorter bypass. It is hence better suited for up-scaled devices with a high number of wells. Also, the sample wells are oriented closer together, which offers advantages for automated imaging.
Complete sample well loading was observed for both layouts, if either built as a two-height or a three-height design. In a two-height design, both the sample well and the bypass channels are of equal height. The three-height design requires a third mask, an additional SU8 layer and an alignment step to further ensure that the sample wells become higher than the preceding bypass channels. This height-differential promotes entering of sample fluid into the well through the same capillary valving principle that stops flow at the constrictions. Here, the higher well ceiling corresponds to a lower Laplace pressure of the advancing meniscus and flow along the bypass direction is only favored after wells have filled completely such that the valve constrictions block further flow and divert it down the bypass. However, successful loading does not strictly require the wells to be higher than the bypass as appropriate capillary valving can also be achieved by adjusting channel widths accordingly. Nonetheless, in our experience, the higher wells performed significantly more robust and defect free loading was observed at up to ten times higher flow-rates in all three-height designs compared to their two-height equivalents. This effect was more pronounced in the parallel layout.
To mimic vapor diffusion crystallization kinetics, the finite permeability of the polyimide foil was exploited to control water evaporation over time. Experimental evaporation rates were quantified by monitoring the change of droplet volume over time by equating drop surface area and well height (Figure 4C). The evaporation from crystallization wells in the X-ray chip does not proceed in a linear fashion, as a shrinking surface area of the drop coinciding with increasing solute concentration results in a reduced evaporation rate over time45. The initial evaporation followed an approximately linear rate of about 0.5 nL h-1 in wells of the serial layout geometry.
To better understand the crystallization kinetics, DLS measurements were performed in the crystallization wells of the microfluidic chip. For initial DLS measurements, a PDMS chip bonded on a glass slide was used to provide better optical properties for the light scattering experiment. This chip had the same well dimensions as the X-ray chip. PDMS has a higher water vapor permeability than the polyimide of the polyimide windows in the X-ray chip45. Since flux scales linearly with distance, the evaporation trajectory of a polyimide windowed well can be matched with a corresponding PDMS window of appropriate thickness.
DLS results show that the radius distribution changes over time (Figure 4A-B), demonstrating that the DLS measurements allow to detect the initial nucleation before first crystalline particles are observed. This information can be used to nucleate and grow single crystals per well by externally adjusting the evaporation rate and hence supersaturation levels at an early stage of the nucleation46.
The X-ray chip was fixed on a 3D printed adapter for the SBS compatible plate goniometer at the EMBL beamline of the synchrotron P14 at PETRA III (Figure 5A). Alternatively, a smaller 3D printed frame may be used to mount X-ray chips to standard beamline goniometers21. Thaumatin crystals have a size of 10 - 20 µm (Figure 5B) and diffract up to a resolution of 2.0 Å (Figure 5C). As expected, the X-ray background contribution of the two thin polyimide foils windows from the X-ray chip is limited to polyimide polymer scattering rings at 11 Å (2θ ~ 5°) and 33 Å (2θ ~ 1.7°) for the X-ray wavelength of 0.97 Å. These two rings do not disturb data processing. A total dataset with 83 thaumatin crystals was collected and 10 diffraction patterns were recorded from each crystal with a 1° rotation during each frame. Data processing and refinement parameters, as well as the statistics of the thaumatin dataset are listed and compared with two other datasets of glucose isomerase and thioredoxin that were also collected in situ are listed in Table 3 and Table 4.
The intensity decay of the normalized diffraction power over time was investigated by splitting up the thaumatin dataset into five sub datasets (two diffraction patterns were used per subset to maintain complete datasets). As shown in Figure 6B, the diffraction power started to decrease after the first sub dataset and was below 50% in the fourth sub dataset. As a result, the Rmeas values of the sub datasets are also increasing over time, indicating X-ray radiation damage during the data collection. We hypothesize that free radicals generated during X-ray exposure quickly degrade neighboring crystals in the same reaction compartment. For example, such secondary X-ray damage was less pronounced in a related experimental approach, where crystals have been distributed over a significantly larger area in a polyimide sandwich21. To minimize overall X-ray damage, only a small number of diffraction patterns from a particular crystal should be collected at room temperature. Also, only one single protein crystal should be exposed per compartment of the microfluidic chip. Nevertheless, all structure models refined using the processed datasets show very good stereochemistry and suitable statistics (Table 4). In addition, all final electron density maps were of very good quality.
In previous crystallography approaches on X-ray transparent chips, the orientation and arrangement of the crystals had to be manipulated deliberately to obtain a random distribution of crystal orientations40 or was obtained by crystal movements within the liquid layer21. To evaluate the crystal orientation in the X-ray transparent microfluidic chips described in this protocol, the unit cell orientation of all exposed crystals with respect to the laboratory coordinate system was determined. For the bipyramidal thaumatin crystals, a slight preference was observed (Figure 7A), while we obtained a broad distribution for glucose isomerase crystals (Figure 7B). We reasoned that on the nanometer scale, most materials exhibit significant roughness. Hence, crystals could spontaneously nucleate on the surface in significantly less biased orientations spontaneously. Such a small crystal nucleus may be locked into an orientation, while continuing to grow to appropriate size without reorienting relative to the normal of the surface. In fact, surface mediated crystal nucleation has long been a nuisance to crystallographers trying to loop an attached crystal off the surface without damaging the crystal in the process. Here, we can directly utilize such crystals for diffraction data collection. However, system specific limitations exist, as the thioredoxin revealed a strong preference for certain orientations in the xy-,xz- and yz-planes (Figure 7C). The examples showed demonstrate that the orientation distribution does not only depend on the growth environment but also on the crystal shape. The thioredoxin crystals have elongated shapes which tend to grow in preferred orientation, while the tetragonal bipyramidal thaumatin crystals or the orthorhombic glucose isomerase crystals do not show this behavior. However, in all cases, even with preferred orientations the accessible range of crystal rotations resulted in sufficiently good coverage of reciprocal space and hence complete data sets for all investigated proteins. Thus, no additional measures had to be taken when selecting crystals for Xray exposure.
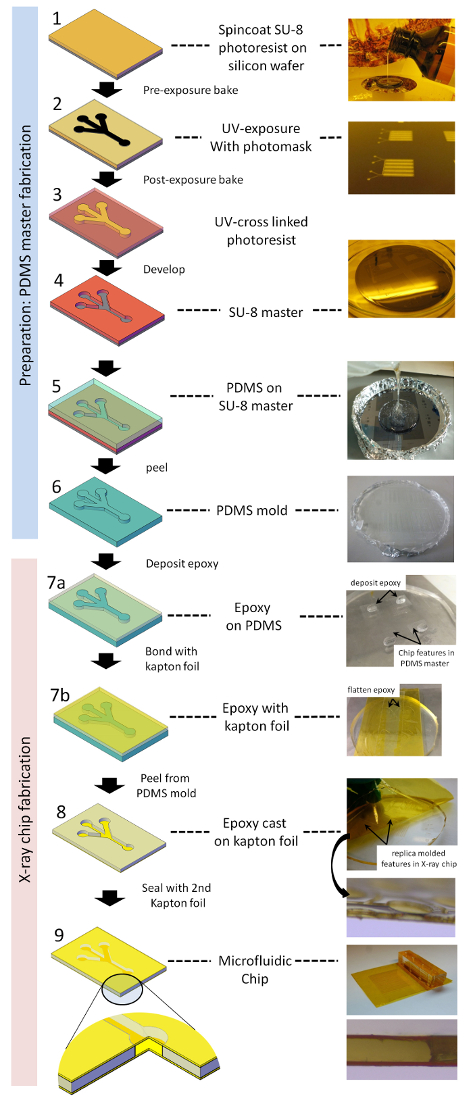
Figure 1: Scheme of microfluidic X-ray chip fabrication. (1) SU-8 is dispensed on a silicon substrate and spin coated to obtain the desired layer thickness. (2) Photoresist is exposed to UV-radiation through a mask. (3) Unexposed photoresist is then developed away by consecutively washing with PGMEA and isopropanol, resulting in (4) an SU-8 master for further casting steps. (5) PDMS is poured onto, and (6) after curing the PDMS mold, is peeled from the SU-8 master. (7a) Epoxy glue is dispensed on the PDMS mold and (7b) an activated polyimide foil is chemically bonded to the epoxy resin. (8) After curing, the polyimide foil with the patterned thin epoxy film is peeled from the PDMS mold. (9) In a final step, the device is lidded with a second polyimide foil to yield an enclosed low X-ray background microfluidic chip. Please click here to view a larger version of this figure.
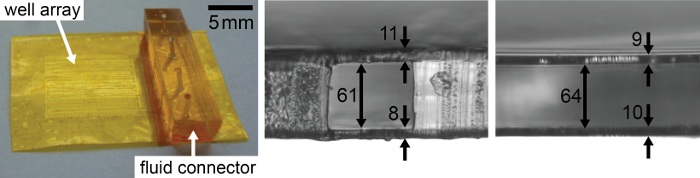
Figure 2: Photograph (left) and microscopy images of cross sections of the final chips. A representative channel segment (middle) and a crystallization well (right) from two separate chips are shown. Arrows indicate measured distances. All dimensions are in µm. Please click here to view a larger version of this figure.

Figure 3: Schematics of crystallization well designs with [A] parallel or [B] serial layout, as viewed from the top and from the side, with dimensions indicated in µm. Typical channel heights were: 50 µm bypass, 50-60 µm crystallization well, 5-10 µm capillary valve, corresponding to well volumes of about 2.5 nL (parallel layout) and 8 nL (serial layout). Representative well loading behavior is shown using food dyes. The chip was primed with 12 wt% 1H,1H,2H,2H-perfluoro-1-octanol in FC-43, before food dye was injected into the storage wells. White arrows indicate the direction of flow. Overview images of loaded devices show all wells loaded defect free, illustrating robust sample loading. The parallel layout is illustrated as a three-height design, with crystallization wells higher than the bypass, while the serial layout is depicted as a two-height design with wells and bypass having equal height. Typical flow rates were around 150 µL/h during loading, but defect free loading was observed for flowrates of up to 1 mL/h in a three height-design. Please click here to view a larger version of this figure.
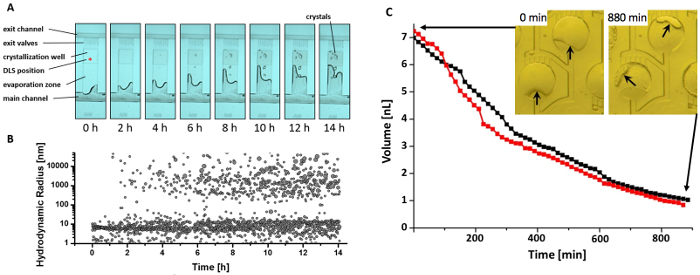
Figure 4: In situ Dynamic Light Scattering of a crystallization well over time. [A] Microscopic image series of the crystallization well. The stored droplet continuous shrinks as water vapor evaporates over time. First thaumatin microcrystals can be observed after 4 h. [B] Corresponding hydrodynamic radius distribution of the thaumatin particles measured by DLS during the same crystallization process photographed in [A]. The formation of a second radius fraction, indicating initial nucleation events can be seen after approximately 1-2 h. [C] Representative volume decrease of two reference droplet volumes due to evaporative water loss over time. Please click here to view a larger version of this figure.
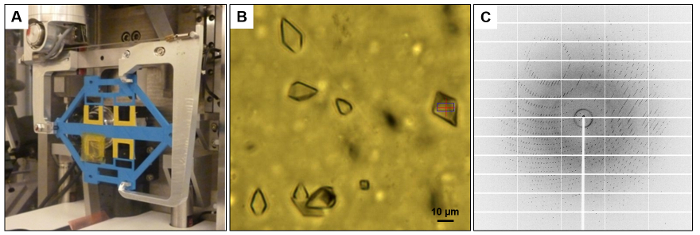
Figure 5: in situ diffraction data collection. [A] Individual microfluidic chips are mounted by a 3D printed adapter (blue) on a plate goniometer. [B] Thaumatin crystals in the microfluidic chip during X-ray exposure as imaged by the in-line microscope at beamline P14. [C] Diffraction of thaumatin crystals was recorded to a resolution of 2.0 Å, with a negligibly low background. Please click here to view a larger version of this figure.
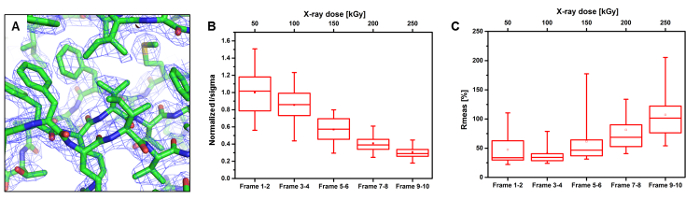
Figure 6: Data evaluation of diffraction data from thaumatin crystals in the microfluidic chip, recorded at the room-temperature. [A] Electron density of the refined thaumatin model using the frame 1-2 dataset only (blue contours at 1.5 σ). [B] Intensity decay of thaumatin crystals as a function of X-ray dose. [C] Evolution of the Rmeas value over X-ray dose. The box plots in [B] and [C] with quartiles (upper values 75%, median values 50%, lower values 25% and mean) and whiskers with 95% confidence intervals represent the decay of diffraction intensity and Rmeas of all exposed crystals (n = 83). Please click here to view a larger version of this figure.
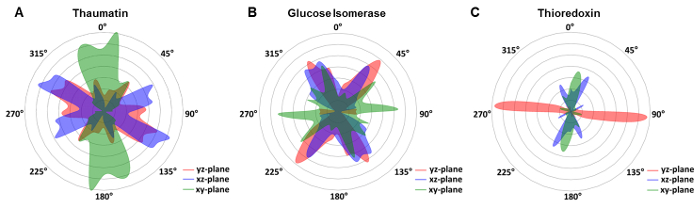
Figure 7: Distribution of unit cell orientations in the microfluidic chip foil with respect to the laboratory coordinate system. [A] The bipyramidal thaumatin crystals showed a broad distribution of orientations covering nearly 180° in the xy- (blue), xz-plane (green) and yz-(red) plane. [B] Glucose isomerase also shows a wide-ranging distribution, while [C] thioredoxin showed a strong preference for certain orientations. Please click here to view a larger version of this figure.
| SU8-Layer | Spin coat | Pre-bake | Expose | Post-bake |
| [65 / 95 °C] | [65 / 95 °C] | |||
| 1st layer: Wells | 1000 RPM | 0 / 10 min | 200 mJ/cm2 | 1 / 4 min |
| 15 µm SU8-3010 | ||||
| 2nd layer: Bypass | 2000 RPM | 0 / 16 min | 220 mJ/ cm2 | 1 / 5 min |
| 35 µm SU8-3025 | ||||
| 3rd layer: Valves | 3000 RPM | 0 / 3 min | 150 mJ/ cm2 | 1 / 2 min |
| 5 µm SU8-3005 |
Table 1: SU8 process example for three-layer parallel X-ray chip design. This layer ordering will allow for casting a PDMS mold for X-ray chip fabrication. To directly mold a PDMS during prototyping, reverse the layer ordering during master fabrication to start from the 3rd to finish with the 1st layer instead.
| Protein | Protein concentration | Protein buffer | precipitant | Space Group, PDB entry | Extinction coefficient [M-1 cm-1] |
| Thaumatin (Thaumatococcus daniellii) | 40 mg mL-1 | 50 mM Bis-Tris, pH 6.5 | 1.1 M sodium tartrate, 50 mM Tris, pH 6.8 | I4222, 1LR2 | 29420 |
| Glucose isomerase (Streptomyces rubiginosus) | 25 mg mL-1 | 10 mM HEPES, 1 mM MgCl2, pH 7.0 | 100 mM Bis-Tris, 2.7 M ammonium sulfate, pH 5.7 | I222, 4ZB2 | 46410 |
| Thioredoxin (Wuchereria bancrofti) | 34 mg mL-1 | 20 mM Tris-HCl, 5 mM EDTA, 150 mM NaCl, pH 8.0 | 27.5 % PEG1500, 100 mM SPG buffer, pH 6.3 | P41212, 4FYU | 24075 |
Table 2: Crystallization conditions and space groups of protein crystals prepared, including the extinction coefficient and pdb code.
| Protein | Number of exposed crystals | Number of diffraction pattern per crystal | Oscillation range per exposure [°] | Exposure time [ms] | PDB entry for MR |
| Thaumatin (Thaumatococcus daniellii) | 103 | 10 | 1 | 40 | 1LR2 |
| Glucose isomerase (Streptomyces rubiginosus) | 69 | 100 | 0.1 | 80 | 4ZB2 |
| Thioredoxin (Wuchereria bancrofti) | 68 | 10 | 1 | 40 | 4FYU |
Table 3: X-ray diffraction data collection parameter.
| Data collection statisticsa | thaumatin (Frame 1-20) | glucose isomerase (Frame 1-100) | thioredoxin (Frame 1-10) |
| Beamline | P14 | ||
| Wavelength [Å] | 0.96863 | ||
| Space group | P41212 | I222 | P42212 |
| Unit cell parameters: a = b, c [Å] | 58.62, 151.48 | 93.91, 99.60, 103.04 | 58.45, 151.59 |
| Number of crystals | 101 | 41 | 34 |
| Total oscillation [°] | 10 | 10 | 10 |
| Resolution [Å] | 30.1.1989 (1.95 – 1.89) | 30.1.1975 (1.80 – 1.75) | 30.3.2000 (3.20 – 3.00) |
| Temperature [K] | 296 | 296 | 296 |
| R p.i.m.b | 7.5 (25.5) | 8.8 (28.0) | 9.1 (33.2) |
| Measured reflections | 1553200 | 690000 | 1111196 |
| Unique reflections | 21850 | 48942 | 44449 |
| Average I/σ(I) | 6.07 (1.78) | 5.85 (1.66) | 4.08 (1.47) |
| Mn(I) half-set correlation CC(1/2) | 96.2 (72.2) | 95.8 (68.2) | 97.9 (75.3) |
| Completeness [%] | 99.8 (100.0) | 100.0 (99.9) | 99.9 (100.0) |
| Redundancy | 71.1 | 14.1 | 25 |
| Refinement statistics | |||
| Resolution range [Å] | 1/30/1989 | 1/30/1975 | 3/30/2000 |
| R/ Rfree [%] | 18.8/23.9 | 18.1/20.5 | 18.9/23.1 |
| Protein atoms | 1550 | 3045 | 1129 |
| Water molecules | 51 | 111 | 164 |
| Ligand molecules | 20 | 0 | 0 |
| Rms deviation | |||
| Bond-length [Å] | 0.02 | 0.026 | 0.01 |
| Bond angle [°] | 2.04 | 2.22 | 1.43 |
| B factor [Å2] | |||
| Protein | 22.6 | 20 | 50 |
| Water | 25.1 | 27.1 | 29.7 |
| Ligand | 20.4 | ||
| Ramachandran plot analysis | |||
| Most favored regions [%] | 97.67 | 95.32 | 96.13 |
| Allowed regions [%] | 2.44 | 4.16 | 3.64 |
| Generously allowed regions [%] | 0.49 | 0.52 | 0.23 |
| a: Values in parentheses are for the highest resolution shell. | |||
b: ( ), where I (hkl) is the mean intensity of the reflections hkl, Σhkl is the sum over all reflections and Σi is the sum over i measurements of reflection hkl. ), where I (hkl) is the mean intensity of the reflections hkl, Σhkl is the sum over all reflections and Σi is the sum over i measurements of reflection hkl. | |||
Table 4: Data collection statistics of datasets from thaumatin, glucose isomerase and thioredoxin.
Supplementry-File 1: chip_geometry.dwg. CAD-file of the chip geometries used. Please click here to download this file.
Supplementry-File 2: goniometer_adapter.stl. STL-file specifying the X-ray chip goniometer adapter. Please click here to download this file.
Supplementry-File 3: xds.sh. Bash script for creating input files to process wedges of diffraction data by XDS. Please click here to download this file.
Supplementry-File 4: xscale.sh. Bash script to merge diffraction data from subsets and create a HKL file. Please click here to download this file.
Supplementry-File 5: ISigma.sh. Bash script to extract the ISigma values from all individual subsets. Please click here to download this file.
Supplementry-File 6: Rmeas.sh. Bash script to extract Rmeas values from all individual subsets. Please click here to download this file.
Supplementry-File 7: rotation_matrix.sh. Bash script to prepare the input file for Matlab to calculate the Euler angles from the rotation matrix. Please click here to download this file.
Discussion
We fabricate microfluidic devices for in situ X-ray diffraction by patterning epoxy resin as filling material and polyimide foil as window material. Our procedure optimized various steps of the fabrication process over previous X-ray chip designs16,21. We reduced the window thickness and thereby the background scattering while also easing fabrication as fewer process steps are required. in situ crystallization using the described protocol has substantial benefits. It allows diffraction data collection at room-temperature and thereby excludes the need of cryo protection, which in some cases contains the risk of introducing artefacts in the protein structure. Furthermore, the crystals are not subject to physical stress, because the transfer of the crystals from their native environment can be avoided. Through this procedure, the crystals maintain their highest quality and do not suffer from any treatment.
In our experience, the most critical steps within the protocol revolve around controlling the crystallization process. The parameters to obtain X-ray suitable crystals with appropriate dimensions need to be identified empirically and cannot be taken directly from vapor diffusion experiments. Using identical concentrations of protein and precipitant did not always result in crystals in different chips, or at times in different wells within the same chip. This indicates that all factors influencing crystal nucleation and growth should be considered carefully, such as mother liquor composition or crystallization kinetics (through the evaporation trajectory). As larger crystals diffract to higher resolution, suitably large crystals are ideally grown. The process of crystal nucleation and growth may be followed with DLS measurements. Adjusting the laser focus inside the ~50 µm thin crystallization compartments of the chip can be challenging and may require careful manual alignment. By using wells deeper than 100 µm, laser auto-alignment was feasible and reliable, such that multiple wells could be monitored through automated acquisition schemes.
The polyimide based X-ray chips produce only a low background and we demonstrate the suitability of these devices for routine X-ray diffraction data collection by solving structures for three model proteins. The best resolution obtained in chip differed, compared with previously achieved resolutions, from significantly larger protein crystals and conventional X-ray data collection. This could be due to several factors and further crystallization condition optimization may further improve the diffraction. It was possible to collect in situ diffraction data up to 1.8 Å resolution applying crystal with dimensions smaller than 30 µm. The detailed analysis of thaumatin diffraction data provided insights about radiation damage. To limit the extend of radiation damage, only one single crystal should be exposed per compartment in the microfluidic device, as the diffusion of radicals to and in neighboring crystals can occur. To improve the speed of data collection, this should be automated in future.
Due to crystal morphology, in some cases a preferred orientation can occur. This was for example the case with the thioredoxin dataset, where the crystals had a strongly preferred orientation relative to the chip windows. Even here, we could collect a complete diffraction dataset. If crystals exhibit a preferred orientation in chip and in particular if the corresponding space group has also a low symmetry, then the completeness of the dataset should be monitored during the collection such that sufficient diffraction patterns cane be collected.
Time-resolved studies using these chips are directly possible when using light induced reactions with a pump-probe approach. The polyimide foil light transmission for the pump laser needs to be elucidated and alternatively, optically clear polyimide or COC could be used. The current microfluidic geometries do not allow for substrate mixing experiments after the crystals are grown. However, we expect the described X-ray chip fabrication protocol to also be suitable for such mixing designs for both time-resolved X-ray diffraction as well as scattering approaches19.
Disclosures
The authors have nothing to disclose.
Acknowledgements
This work was supported by the PIER seed fund PIF-2015-46, the BMBF grants 05K16GUA and 05K12GU3, and the 'The Hamburg Centre for Ultrafast Imaging – Structure, Dynamics and Control of Matter at the Atomic Scale' excellence cluster of the Deutsche Forschungsgemeinschaft (DFG). The work of authors affiliated with the Center for Free-Electron Laser Science was funded by the Helmholtz Association through programme oriented funds. The synchrotron MX data was collected at beamline P14 operated by EMBL Hamburg at the PETRA III storage ring (DESY, Hamburg, Germany).
Materials
| Name | Company | Catalog Number | Comments |
|---|---|---|---|
| SU-8 3000 Series | MicroChem Corp. | SU-8 3000 | Photoresist |
| PGMEA | Sigma-Aldrich | 484431 | Developer |
| Isopropyl alcohol | Solvent | ||
| Ethanol | Solvent | ||
| Epoxy glue | UHU | Plus Schnellfest 5 min | Epoxy glue |
| PDMS | Dow Corning | Sylgard 184 | Silicone |
| Kapton foil | Dupont/ American Durafilm | HN grade, gauge 30 (7.5 μm) | polyimide foil |
| APTS | Sigma-Aldrich | 440140 | Chemical |
| GPTS | Sigma-Aldrich | 440167 | Chemical |
| Cytop CTX-109AE | Asahi Glass Co. Ltd | Cytop CTX-109AE | Cytop fluoropolymer coating |
| CT-Solv 100E | Asahi Glass Co. Ltd | CT-Solv 100E | Cytop fluoro-solvent |
| HFE-7500 | 3M | Novec 7500 | Fluorinated oil |
| AutoCAD | AutoDesk Inc. | AutoCAD | CAD Software |
| Biopsy Punch | Harris | Uni-core 0.75 mm | |
| Photo mask | JD Photo Data | ||
| 3 inch wafer | University Wafer | Silicon wafer | |
| Mask aligner | SÜSS MicroTec | MJB4 | Mask aligner |
| PDMS mixer | Thinky | ARE-250 | |
| Plasma machine | Diener electronic | Zepto | |
| Thaumatin | Sigma Aldrich | T7638 | Protein |
| Glucose Isomerase | Hamton Research | HR7-102 | Protein |
| Bis-Tris | Sigma Aldrich | B9754 | Chemical |
| Sodium Tartrate | Merck | 106664 | Chemical |
| Tris-HCl | Sigma Aldrich | 10812846001 | Chemical |
| HEPES | Carl Roth | 6763.2 | Chemical |
| Magnesium Chloride | Sigma Aldrich | 208337 | Chemical |
| Ammonium Sulfate | Sigma Aldrich | A4418 | Chemical |
| EDTA | Sigma Aldrich | E6758 | Chemical |
| Sodium Chloride | Sigma Aldrich | 1064060250 | Chemical |
| PEG1500 | Molecular Dimensions | MD2-100-6 | Chemical |
| SPG buffer | Jena Bioscience | CSS-389 | Chemical |
| SpectroLight600 | XtalConcepts | DLS Instrument | |
| Nanodrop | Thermo Scientific | Spectrophotometer | |
| Zentrifuge | Eppendorf | ||
| Ultimaker2 | Ultimaker | 3D printer | |
| Form2 | Formlabs | 3D printer | |
| Amicon Filter | Sartorius Stedim | 0.2 µm filter | |
| Tubing | Adtech Polymer Engineering Ltd | Bioblock/05 | PTFE tubing 0.3 mm Inner Diameter x 0.76 mm Outer Diameter |
| Syringes | BD | 309628 | 1ml Luer-Lock Tip |
| Needle | Terumo Agani Needle | AN*2716R1 | 27Gx5/8" |
References
- Rasmussen, B. F., Stock, A. M., Ringe, D., Petsko, G. A. Crystalline ribonuclease A loses function below the dynamical transition at 220 K. Nature. 357 (6377), 423-424 (1992).
- Tilton, R. F. J. R., Dewan, J. C., Petsko, G. A. Effects of temperature on protein structure and dynamics: X-ray crystallographic studies of the protein ribonuclease-A at nine different temperatures from 98 to 320 K. Biochemistry. 31 (9), 2469-2481 (1992).
- Fraser, J. S., Clarkson, M. W., Degnan, S. C., Erion, R., Kern, D., Alber, T. Hidden alternative structures of proline isomerase essential for catalysis. Nature. 462 (7273), 669-673 (2009).
- Juers, D. H., Matthews, B. W. The role of solvent transport in cryo-annealing of macromolecular crystals. Acta Crystallogr. D. 60 (Pt 3), 412-421 (2004).
- Huang, C. Y., et al. In meso in situ serial X-ray crystallography of soluble and membrane proteins. Acta Crystallogr. D. 71 (Pt 6), 1238-1256 (2015).
- Gati, C., et al. Atomic structure of granulin determined from native nanocrystalline granulovirus using an X-ray free-electron laser. P. Natl. Acad. Sci. USA. 114 (9), 2247-2252 (2017).
- Gati, C., et al. Serial crystallography on in vivo grown microcrystals using synchrotron radiation. IUCrJ. 1 (Pt 2), 87-94 (2014).
- von Dreele, R. B. Multipattern Rietveld refinement of protein powder data. J. Appl. Crystallogr. 40 (1), 133-143 (2007).
- Cherezov, V. Lipidic cubic phase technologies for membrane protein structural studies. Curr. Opin. Struct. Biol. 21 (4), 559-566 (2011).
- Gati, C. Data processing and analysis in serial crystallography at advanced X-ray sources. , Dissertation, Hamburg (2015).
- Stellato, F., et al. Room-temperature macromolecular serial crystallography using synchrotron radiation. IUCrJ. 1 (Pt 4), 204-212 (2014).
- Botha, S., et al. Room-temperature serial crystallography at synchrotron X-ray sources using slowly flowing free-standing high-viscosity microstreams. Acta Crystallogr. D. 71 (Pt 2), 387-397 (2015).
- Nogly, P., et al. Lipidic cubic phase serial millisecond crystallography using synchrotron radiation. IUCrJ. 2 (Pt 2), 168-176 (2015).
- Martin-Garcia, J. M., Conrad, C. E., Coe, J., Roy-Chowdhury, S., Fromme, P. Review: Serial femtosecond crystallography: A revolution in structural biology. Arch. Biochem. Biophys. 602, 32-47 (2016).
- White, T. A., et al. CrystFEL: A software suite for snapshot serial crystallography. J Appl Crystallogr. 45 (2), 335-341 (2012).
- Perry, S. L., et al. A microfluidic approach for protein structure determination at room temperature via on-chip anomalous diffraction. Lab Chip. 13 (16), 3183-3187 (2013).
- Schlichting, I. Serial femtosecond crystallography: the first five years. IUCrJ. 2 (Pt 2), 246-255 (2015).
- Sui, S., Perry, S. L. Microfluidics: From crystallization to serial time-resolved crystallography. Struct. Dynam.-US. 4 (3), (2017).
- Ghazal, A., Lafleur, J. P., Mortensen, K., Kutter, J. P., Arleth, L., Jensen, G. V. Recent advances in X-ray compatible microfluidics for applications in soft materials and life sciences. Lab Chip. 16 (22), 4263-4295 (2016).
- Heymann, M., et al. Room-temperature serial crystallography using a kinetically optimized microfluidic device for protein crystallization and on-chip X-ray diffraction. IUCrJ. 1 (Pt 5), 349-360 (2014).
- Schubert, R., et al. A multicrystal diffraction data-collection approach for studying structural dynamics with millisecond temporal resolution. IUCrJ. 3 (Pt 6), 393-401 (2016).
- Weierstall, U., et al. Lipidic cubic phase injector facilitates membrane protein serial femtosecond crystallography. Nat. Commun. 5, 3309(2014).
- Conrad, C. E., et al. A novel inert crystal delivery medium for serial femtosecond crystallography. IUCrJ. 2 (Pt 4), 421-430 (2015).
- Cohen, A. E., et al. Goniometer-based femtosecond crystallography with X-ray free electron lasers. P. Natl. Acad. Sci. USA. 111 (48), 17122-17127 (2014).
- Erskine, D., YU, P. Y., Freilich, S. C. High-Pressure Visible Spectroscopy of Polyimide Film. J. Polym. Sci. Pol. Lett. 26 (11), 465-468 (1988).
- Tsai, C. -L., Yen, H. -J., Chen, W. -C., Liou, G. -S. Novel solution-processable optically isotropic colorless polyimidothioethers-TiO2 hybrids with tunable refractive index. J. Mater. Chem. 22 (33), 17236-17244 (2012).
- Destremaut, F., Salmon, J. -B., Qi, L., Chapel, J. -P. Microfluidics with on-line dynamic light scattering for size measurements. Lab Chip. 9 (22), 3289-3296 (2009).
- Chastek, T. Q., Iida, K., Amis, E. J., Fasolka, M. J., Beers, K. L. A microfluidic platform for integrated synthesis and dynamic light scattering measurement of block copolymer micelles. Lab Chip. 8 (6), 950-957 (2008).
- Heymann, M., Fraden, S., Kim, D. Multi-Height Precision Alignment With Selectively Developed Alignment Marks. J. Microelectromech. S. 23 (2), 424-427 (2014).
- Schubert, R., et al. Reliably distinguishing protein nanocrystals from amorphous precipitate by means of depolarized dynamic light scattering. J Appl Crystallogr. 48 (5), 1476-1484 (2015).
- Aghvami, S. A., et al. Rapid prototyping of cyclic olefin copolymer (COC) microfluidic devices. Sensor Actuat. B-Chem. 247, 940-949 (2017).
- Walker, J. M. The Proteomics Protocols Handbook. , Humana Press Inc. Totowa, NJ. (2005).
- Kabsch, W. XDS. Acta Crystallogr D. 66 (Pt 2), 125-132 (2010).
- Vagin, A., Teplyakov, A. Molecular replacement with MOLREP. Acta Crystallogr. D. 66 (Pt 1), 22-25 (2010).
- Winn, M. D., et al. Overview of the CCP4 suite and current developments. Acta Crystallogr. D. 67, 235-242 (2011).
- Murshudov, G. N., et al. REFMAC5 for the refinement of macromolecular crystal structures. Acta Crystallogr. D. 67 (Pt 4), 355-367 (2011).
- Emsley, P., Lohkamp, B., Scott, W. G., Cowtan, K. Features and development of Coot. Acta Crystallogr. D. 66 (Pt 4), 486-501 (2010).
- Owen, R. L., et al. Exploiting fast detectors to enter a new dimension in room-temperature crystallography. Acta Crystallogr. D. 70 (Pt 5), 1248-1256 (2014).
- Kabsch, W. Automatic-Indexing of Rotation Diffraction Patterns. J. Appl. Crystallogr. 21, 67-71 (1988).
- Zarrine-Afsar, A., et al. Crystallography on a chip. Acta Crystallogr. D. 68 (Pt 3), 321-323 (2012).
- Boukellal, H., Selimović, S., Jia, Y., Cristobal, G., Fraden, S. Simple, robust storage of drops and fluids in a microfluidic device. Lab Chip. 9 (2), 331-338 (2009).
- Aghvami, S. A., et al. Rapid prototyping of cyclic olefin copolymer (COC) microfluidic devices. Sens. Actuator B Chem. 247, 940-949 (2017).
- Shemesh, J., et al. Stationary nanoliter droplet array with a substrate of choice for single adherent/nonadherent cell incubation and analysis. Proc. Natl. Acad. Sci. USA. 111 (31), 11293-11298 (2014).
- Sun, M., Bithi, S. S., Vanapalli, S. A. Microfluidic static droplet arrays with tuneable gradients in material composition. Lab Chip. 11 (23), 3949-3952 (2011).
- Shim, J. -U., et al. Control and measurement of the phase behavior of aqueous solutions using microfluidics. J. Am. Chem. Soc. 129 (28), 8825-8835 (2007).
- Schubert, R., Meyer, A., Baitan, D., Dierks, K., Perbandt, M., Betzel, C. Real-Time Observation of Protein Dense Liquid Cluster Evolution during Nucleation in Protein Crystallization. Cryst. Growth Des. 17 (6), 3579(2017).
Reprints and Permissions
