A protocol for the matrix-assisted laser desorption ionization time of flight mass spectrometry (MALDI-TOF MS) characterization of synthetic polymers is described including the optimization of sample preparation, spectral acquisition, and data analysis.
Method Article
Characterization of Synthetic Polymers via Matrix Assisted Laser Desorption Ionization Time of Flight (MALDI-TOF) Mass Spectrometry
In This Article
Summary
Abstract
There are many techniques that can be employed in the characterization of synthetic homopolymers, but few provide as useful of information for end group analysis as matrix-assisted laser desorption ionization time of flight mass spectrometry (MALDI-TOF MS). This tutorial demonstrates methods for optimization of the sample preparation, spectral acquisition, and data analysis of synthetic polymers using MALDI-TOF MS. Critical parameters during sample preparation include the selection of the matrix, identification of an appropriate cationization salt, and tuning the relative proportions of the matrix, cation, and analyte. The acquisition parameters, such as mode (linear or reflector), polarization (positive or negative), acceleration voltage, and delay time, are also important. Given some knowledge of the chemistry involved to synthesize the polymer and optimizing both the data acquisition parameters and the sample preparation conditions, spectra should be obtained with sufficient resolution and mass accuracy to enable the unambiguous determination of the end groups of most homopolymers (masses below 10,000) in addition to the repeat unit mass and the overall molecular weight distribution. Though demonstrated on a limited set of polymers, these general techniques are applicable to a much wider range of synthetic polymers for determining mass distributions, though end group determination is only possible for homopolymers with narrow dispersity.
Introduction
With improvements in living polymerization techniques, precision polymers with quantitatively functionalized end groups are increasingly available1. The concurrent development of azide-alkyne and thiolene click chemistries has enabled the nearly quantitative coupling of macromolecules to other moieties, providing access to a range of hybrid materials2,3,4. However, precise analytical techniques are required to characterize both the starting materials and products of these polymer conjugation reactions. Matrix-assisted laser desorption/ionization time of flight mass spectrometry (MALDI-TOF MS) is a valuable soft ionization analytical technique for characterizing polymers because it can generate polymer ions in a single charge state with minimal fragmentation5,6. MALDI-TOF MS has major advantages over other conventional methods of polymer characterization because it can provide mass spectra with resolution of the individual n-mers within the polymer mass distribution. As a consequence, such mass spectra can provide precise information about the average molecular weight, repeat unit mass, and molecular weight dispersity7, which can in turn elucidate competing polymerization mechanisms such as chain transfer8. However, MALDI-TOF MS is particularly powerful at providing information about polymer end groups9,10, which can be used to confirm end group modifications10,11 and other transformations12 such as polymer cyclizations11,13. Equally important, the relatively small amount of analyte (sub-micrograms) required for mass spectrometric analysis makes this technique useful for characterization when only trace quantities of material are available.
The MALDI-TOF MS analysis of polymers can be divided into four distinct steps: sample preparation, instrument calibration, spectral acquisition, and data analysis. Sample preparation is the most essential step for generating optimized MALDI-TOF mass spectra and occurs before the sample is introduced into the instrument14,15. The selection of an appropriate matrix with similar solubility parameters as the polymer analyte is critical to obtain high quality MALDI-TOF mass spectra and guidelines for matrix selection have been reported elsewhere14,15,16,17. A database of polymer MALDI "recipes" for sample preparation has also been published online18. For novel polymers, matrix selection can be approached by first understanding the solubility of the polymer and selecting a matrix with similar solubility parameters14,19. Polymers with high proton affinity can be protonated by most matrices14 (which frequently contain carboxylic acid groups), but for other polymers, a cationization agent is required14. Alkali ions adduct well with oxygen-containing species (e.g. polyesters and polyethers), whereas unsaturated hydrocarbons (e.g. polystyrene) adduct with transition metals such as silver and copper ions14,19. Because the polymer samples in this experiment contained oxygen atoms in the backbone, sodium or potassium trifluoroacetate (TFA) were used as the cationization agent. Once the matrix and cationization agents have been selected, the relative proportions of analyte, cation agent, and matrix must be carefully optimized to ensure high signal to noise. In this procedure, the parameters for sample preparation have already been optimized, however an empirical sample optimization procedure (step 1.4.1., Figure 1) that systematically varies the concentrations of the three components (analyte, matrix and cation) is effective for rapidly determining their optimal ratios.
Data acquisition also requires the optimization of a number of parameters. The most important parameters include the positive or negative ion mode of the spectrometer, the instrument operation mode (linear versus reflector), the acceleration voltage, and the extraction delay time. Another way that resolution can be increased is through the utilization of "reflectron" mode20,21,22,23. Reflectron mode essentially doubles the flight path of the ions to the detector by reflecting the ions at the end of the flight tube back towards a detector near the source while refocusing ions with different momentums, and therefore increasing the resolution though decreasing signal strength. In addition, higher resolution spectra can be obtained by decreasing the laser power which minimizes the signal-to-noise ratio by decreasing the number and energy of collisions and therefore reducing the fragmentation and kinetic inhomogeneities24. By tuning all of these parameters, the ions can be focused to minimize the effect of any inhomogeneity in initial position or velocity that occurs during the laser desorption process. When the acquisition parameters are optimized, isotopic resolution can often be achieved for ions with masses in excess of 10,000 Da, though this is also dependent upon the length of the flight tube and the instrument design. Most organic compounds that contain at least one heteroatom are prone to complexing with alkali cations such as lithium, sodium, and potassium. Many of the alkali metals are monoisotopes or of limited isotopes and therefore do not broaden the distribution.
While the instrument parameters can be tuned to optimize data precision, data accuracy is only achieved with an appropriate calibration11. Proteins and peptides were originally used as calibrants due to their monodispersity and availability, but suffer from variable stability and the prevalence of impurities25. More cost-effective and stable alternatives have included inorganic clusters and polydisperse polymers26,27,28,29. Unfortunately, these alternatives feature disperse masses, which complicate mass assignments, as well as smaller masses overall, making them useful only for calibrations below 10,000 Da. To combat these issues, Grayson et al.25 developed a dendrimer-based, polyester MS calibration system that is monodisperse, and boasts both broad matrix and solvent compatibility, shelf-life stability (> 8 years), and lower production cost. Based upon the strengths of this system, it was selected as the calibrant for these experiments.
There are two main types of calibration: internal and external30. When calibrating externally, a standard with masses that bracket that of the analyte are placed on the MALDI target plate in a different sample position than the analyte to generate a separate mass spectrum from which a calibration file can be generated. On the other hand, increased accuracy can often be achieved with an internal calibration, which involves mixing the calibrant with the analyte to obtain a hybrid spectrum with both calibrant and analyte signals. In the procedure described below, an external calibration was implemented. After proper calibration of the mass scale, accurate analyte mass data can be acquired. To ensure the most accurate calibration, it is important that the data acquisition occurs soon after the calibration.
Finally, once the optimized, calibrated data sets were acquired, and the data were analyzed to provide structural information about the polymer samples. The spacing between n-mers within the polymer distribution can provide accurate measurement of the repeating unit mass. The number average molecular weight (Mn) and other mass distribution calculations (e.g., Mw (weight average molecular weight) and Đ (dispersity)) can also be determined from the signal distribution in the mass spectra (step 4.2 for calculations). Perhaps most uniquely, in the case of homopolymers, the sum of the end group masses can be confirmed by determining the offset of the polymer distribution with respect to the mass of the repeating units alone. The information-rich MALDI-TOF mass spectra provide valuable characterization data that are complementary to more traditional polymer characterization techniques such as size exclusion chromatography, Fourier-transform infrared spectroscopy, and nuclear magnetic resonance.
Protocol
Caution: All reactions were run in a fume hood. Please read all Material Safety Data Sheets (MSDS) for any chemical used and take appropriate precautions.
1. Sample Preparation
- Preparation of the matrix stock solutions
- Dissolve 20 mg of α-cyano-4-hydroxycinnamic acid (HCCA) in 1 mL of tetrahydrofuran- unstabilized (THF), and vortex until dissolved.
- Dissolve 20 mg of 2,5-dihydroxybenzoic acid (DHB) in 1 mL of THF, and vortex until dissolved.
- Preparation of the alkali cation stock solution
- Dissolve 2 mg of sodium trifluoroacetate (NaTFA) in 1 mL of THF, and vortex until dissolved.
- Dissolve 2 mg of potassium trifluoroacetate (KTFA) in 1 mL of THF, and vortex until dissolved.
- Preparation of analyte stock solutions
- Sample 1: Dissolve 2 mg of poly(ethylene glycol) 2-aminoethyl ether acetic acid (Mn = 5000) in 0.5 mL of THF, and vortex until dissolved.
- Sample 2: Dissolve 2 mg of polyoxyethylene bis(azide) (Mn = 2000) in 0.5 mL of THF, and vortex until dissolved.
- Sample 3: Dissolve 2 mg of poly(L-lactide), thiol terminated (Mn = 2500) in 0.5 mL of THF, and vortex until dissolved.
- Preparation of sample mixtures for analysis
- Prepare a series of solutions by mixing matrix, analyte and cation solution while varying the relative proportions of the components such that nine unique samples mixtures are made. For example, keeping the amount of added matrix stock solution constant (e.g., 10 µL), vary the amount of analyte solution by a factor of three (e.g., 45, 15, and 5 µL), while also varying the amount of cation solution by a factor of three (e.g., 9, 3, and 1 µL). These samples effectively yield a 3 x 3 grid of samples with the two different concentration variables on the x and y axes (Figure 1).
- For the representative example, combine 15 µL of the poly(L-lactide) solution, with 15 µL of the DHB solution, and 1 µL of the NaTFA solution.
- Pipette 1 μL of each solution mixture onto an individual sample well on the MALDI target plate (Figure 2). Add the samples incrementally in small portions to prevent the sample from flowing out of the sample well, allowing each aliquot to evaporate to dryness before adding additional sample.
NOTE: For higher boiling point solvents, an air gun may be necessary to expedite solvent evaporation, though caution should be used to avoid heating the sample plate, which might cause the plate to warp.
- Preparation of standard samples for calibration
- Prepare the calibration standards using the suggested supplier protocol.
NOTE: Dendrimer calibrants were selected for this study and are available as the pure dendrimers or premixed with matrix, calibrant and cation at optimized ratios.
- Prepare the calibration standards using the suggested supplier protocol.
2. Data Acquisition Optimization
- Initiating Data Acquisition
- Open data acquisition software "FlexControl".
- Eject the platform to enable the loading of the target plate by pressing the "
 " button.
 - Gently place the target plate with the loaded calibrant and analyte samples on the platform in the appropriate orientation.
- Use the acquisition software to inject the target plate on the platform by pressing the "" button again.
- Select an appropriate data acquisition method (positive mode acquisition method) by pressing File | Select Method.
NOTE: For most polymer samples, including our representative analytes, ionization is expected via complexation with a cation and, therefore, a positive mode acquisition method is most appropriate. Depending on the instrument, for lower mass ranges (500-10,000 Da) or when higher resolution is desired, select a reflector mode method file. For higher molecular weight samples or when higher signal sensitivity is needed, and lower resolution is acceptable, select a linear mode method file. - Before acquiring data, make sure an appropriate mass range for collecting data is selected-ideally the mass range will include half of the lowest mass in the expected distribution as well as double the highest mass in the expected distribution. Check this by clicking on the Detection tab and viewing Mass Range.
NOTE: This helps to ensure that signal from lower molecular weight degradation fragments or higher molecular weight aggregates (dimer) that may be present in the sample are included in the data set. Also, note that matrix oligomers are frequently noticed with high signal intensities in most MALDI-TOF mass spectra, providing high intensity noise with masses as high as 1,000 Da, complicating analysis below this mass. Although the calibration will be required before obtaining a final data set, an accurate calibration file can only be acquired if identical acquisition parameters are used as those optimized for the particular analyte. Therefore, a preliminary optimization of the analyte mass spectrum is required before the calibration, followed by the reacquisition of a calibrated analyte mass spectrum.
- Preliminary data acquisition
- From the acquisition software, select the position on the target plate which corresponds to the desired analyte.
- Initiate collecting data while moving the laser target around the sample to maximize the signal. To initiate data collection, press Start.
NOTE: The laser can exhaust matrix at a particular location after repeated sampling. - Using the slide bar on the left side of the camera window, adjust the laser power such that the minimum power necessary to achieve isotopic resolution is achieved.
NOTE: When analyzing multiple samples to confirm the optimal ratio of analyte, cation, and matrix, use the same laser power on each of the analyte samples to determine which sample exhibits the best signal/noise ratio for those acquisition parameters. Continue future acquisition optimization with the sample that appears to exhibit the best signal to noise ratio.
- Data acquisition optimization
- Zooming in on an individual peak in the middle of the mass range of interest, optimize the resolution by adjusting the difference in acceleration voltages (for the instruments in this study, this involves adjusting the "IS2" value), which is in the Spectrometer tab.
NOTE: This is most rapidly optimized by varying the IS2 value in large steps, taking note of which value generates the best resolution (i.e., the smallest full peak width at half maximum signal intensity), and then further optimizing in smaller steps of the IS2 value. Typically, the optimal IS2 value is higher (closer to IS1) for low mass polymers, and lower for high mass polymers. - If desired, increase resolution using reflectron mode.
NOTE: Reflectron mode allows for the compensation of discrepancies in initial velocity of ions of the same m/z by forcing the higher velocity ions of the same m/z value into a longer path to the detector. This increase in path to the detector allows for slower ions of the same m/z value to arrive at the detector simultaneously, effectively focusing the ions for increased resolution. Although reflectron mode typically improves the signal resolution, for samples with weak signal intensity, linear mode might be required in order to visualize the data. - Finally, optimize the laser power by reducing the laser power as low as possible while still generating a reasonable signal to noise ratio (e.g., signal to noise ratio of approximately 10).
NOTE: Because higher laser powers generally reduce the resolution and can induce fragmentation, the mass spectra with best quality are acquired using reduced laser power but a higher number of scans. - Once the acquisition parameters are optimized, save the uncalibrated mass spectra by selecting File and then Save Spectrum to File As. For external calibration, a new acquisition of the calibrant under these identical, optimized parameters must be carried out before a new acquisition is initiated to generate the calibrated mass spectrum of the analyte.
- Zooming in on an individual peak in the middle of the mass range of interest, optimize the resolution by adjusting the difference in acceleration voltages (for the instruments in this study, this involves adjusting the "IS2" value), which is in the Spectrometer tab.
3. MALDI Calibration
- Acquisition of calibration mass spectrum
- Using the acquisition parameters already optimized for the analyte, acquire an optimized mass spectrum of the sample of mass standards.
NOTE: Ideally, the calibration set should include one standard above the range of interest, one below, and at least one in the range of interest. The accuracy of the calibration is best if all acquisition parameters are identical for both samples.
- Using the acquisition parameters already optimized for the analyte, acquire an optimized mass spectrum of the sample of mass standards.
- Create a calibration file
- Make sure that any existing calibration is voided or in a position to be overwritten by pressing Invalidate Calibration under the Spectrometer tab.
- Using the same acquisition parameters (e.g., laser power, IS2 voltage), move the laser over to the sample well containing the calibrant (e.g., dendrimer standard, peptide) by selecting the corresponding well with the cursor and acquire a spectrum by pressing Start.
- Once sufficient signal has been acquired, press Start to finish acquiring data.
- Once a mass spectrum of the calibrant has been acquired, select the Mass Control List dropdown menu in the Calibration tab that corresponds to that calibration standard. The appropriate mass control list will have the reference masses of the calibrant selected with the appropriate cation.
NOTE: These should be available from the calibrant supplier, and make sure to use the monoisotopic mass values when isotopic resolution is achieved (e.g., reflector mode below m/z = 5000), and an average mass values when isotopic resolution cannot be achieved (e.g., linear mode above m/z = 5000), - Before matching the corresponding reference peak to each selected calibrant peak, ensure that an appropriate peak picking protocol is being used by selecting the Processing tab.
NOTE: Peak picking protocols can vary based on spectral resolution. For an average mass calculation, the software should take the mass average across the entire series of isotopic peaks. For a monoisotopic mass calculation, the software should be set to calculate the exact mass of only the first isotopic peak. - Apply the reference mass from the mass control list to the corresponding signal for the calibrant mass spectrum by selecting the area to the left of the peak of interest and then clicking on the corresponding mass in the control list to apply. Continue the process for the remaining calibrant peaks.
NOTE: For the most accurate and precise calibration, place the analyte and calibrant samples as close together as possible on the target plate, because subtle variations in target plate height can affect the accuracy of the calibration. - Reacquire the analyte spectrum once the mass scale for the optimized acquisition parameters have been calibrated.
4. Data Analysis and Interpretation
- Peak picking
- Open the analyte spectrum in the data analysis software (FlexAnalysis).
- Zoom in on a peak to identify if isotopic resolution has been achieved by selecting the Zoom in X-Range button.
- Press Mass List | Find to select peaks. If the monoisotopic peak is resolved, select this first peak in the isotopic distribution to determine its mass using a monoisotopic peak-picking protocol. If the monoisotopic peak is not resolved, use an average mass peak picking protocol, and determine the average mass of the entire isotopic distribution.
- Continue this peak picking process for each n-mer in the polymer distribution.
- Polymer characterization and end group analysis calculations
NOTE: When used correctly, MALDI-TOF MS can provide valuable, accurate data for mass distribution calculations of polymers. It should be noted that mass distribution data is only accurate when the dispersity of the polymer sample is relatively low (e.g., approximately Đ=1.3 or below).- Calculate the number average molecular weight, the mass average with respect to the number of moles of each mass fraction, using the formula:

where Ni = number of molecules of a specific molecular weight and Mi = the specific molecular weight of those molecules. - Calculate the weight average molecular weight, the mass average with respect to the weight of each mass fraction, using the formula:

where N i = number of molecules of a specific molecular weight and M i = the specific molecular weight of those molecules. - Once both the Mw and Mn have been calculated, quantify the breadth of the molecular weight distribution using the ratio Mw/Mn which is called dispersity, Đ.
- The most unique and powerful feature of MALDI-TOF MS data analysis is the ability to determine or confirm the end groups of homopolymers. Determine the end group by rearranging the following formula for the observed mass of an n-mer in the mass spectrum (Mn-mer):
Mn-mer = n(MRU ) + MEG1 + MEG2 + Mion
where n = the degree of polymerization,
MEG1 = mass of the α-end group,
MEG2 = mass of the ω-end group,
MRU = the mass of the repeat unit of the polymer,
and Mion = mass of the ion that complexes with the polymer.
- Calculate the number average molecular weight, the mass average with respect to the number of moles of each mass fraction, using the formula:
Results
Sample 1: A sample of poly(ethylene glycol) 2-aminoethyl ether acetic acid (Mn = 5000) (Figure 3) was analyzed using potassium trifluoroacetate as a cationization agent with HCCA as the matrix. The spectrum exhibited the expected K+ adducts as well as those observed from residual Na+.
MALDI-TOF MS confirms the narrow distribution (Figure 3) of poly(ethylene glycol) 2-aminoethyl ether acetic acid (Mn = 5000). Because the monoisotopic peak (comprising exclusively the most abundant elemental isotopes, namely 12C, 1H 16O, and 14N) is not sufficiently resolved to enable its identification, a pick peaking protocol is used that determines the average mass across the entire isotopic distribution for each n-mer peak. Likewise, all theoretical calculations are determined using average, rather than monoisotopic, masses for each element. Using the equations from step 4, analysis software was used to calculate the following characteristics of the polymer mass distribution: Mn: 4700, Mw: 4710, Đ: 1.00.
In order to confirm the identity of the end groups, an individual n-mer (104) was selected for further analysis (Figure 4). As with the mass distribution calculations, because the monoisotopic peak could not be resolved, average mass values were used for subsequent calculations. The theoretical mass value of the 104-mer of poly(ethylene glycol) 2-aminoethyl ether acetic acid is comprised of the mass of the repeat units (44.0530 × 10⁴) plus the mass of the α-amine end group (+ 16.02300) and the mass of the ω-carboxyl end group (+ 59.0440) plus the mass of the potassium cation (+ 39.09775) which yields a total 104-mer mass of 4695.67675. The observed mass value for the 104-mer + K+ is 4695.5 which matches the theoretical value, given the precision of average mass calculations. The series of smaller, offset peaks in the spectrum corresponds to the polymer ionizing with sodium where the theoretical mass value of the 104-mer is comprised of the mass of the repeat units (44.0530 × 10⁴) plus the mass of the α-amine end group (+ 16.02300) plus the mass of the ω-carboxyl end group (+ 59.0440) plus the mass of the sodium cation (+ 22.98922) giving a total 104-mer mass of 4679.56822. The observed mass value for the 104-mer + Na+ is 4679.4 which is only 0.2 Da different from the theoretical value. More accurate determinations of end group mass can be determined by measuring the average across multiple peaks, and has been discussed elsewhere11.
The poly(ethylene glycol) 2-aminoethyl ether acetic acid (Mn = 5000) sample maintained its narrow distribution when selectively functionalized by reaction (Figure 5) with 2,4-dinitrofluorobenzene (DNFB) (Figure 6). The spectrum exhibited sodium adducts and used HCCA as the matrix.
MALDI-TOF MS confirms the narrow distribution (Figure 6) of poly(ethylene glycol) 2-aminoethyl ether acetic acid (Mn = 5000) when modified with DNFB. Using the equations from step 4, analysis software was used to calculate the following characteristics of the polymer mass distribution: Mn: 4940, Mw: 4950 Đ: 1.00.
In order to determine if complete functionalization of the poly(ethylene glycol) 2-aminoethyl ether acetic acid (Mn = 5000) had occurred with DNFB, an individual n-mer of the distribution was selected for analysis (Figure 7). The theoretical mass of the functionalized 104-mer of poly(ethylene glycol) 2-aminoethyl ether acetic acid reacted with 2,4-dinitrofluorobenzene is comprised of 44.0530 × 10⁴ (the mass of the repeat units) + 182.115 (mass of the α-amine group reacted with 2,4-dinitrofluorobenzene) + 59.044 (mass of the carboxyl group) + 22.98922 (mass of the sodium cation) = 4845.66022. The observed mass value for n = 104 is 4845.8 which is -0.1 Da different from the theoretical value. This close agreement between the theoretical and observed values is indicative of a complete modification of the starting material to product, but more significantly, the lack of signals associated with the starting material, 4811.72722 and 4855.78022 for this mass range, or any additional byproducts confirms the quantitative selective functionalization of the amine. A second peak is observed at 4823.8 which matches the 103-mer of the functionalized polymer, but with the loss of the proton on the carboxylic acid end group that complexes with another sodium ion with a theoretical mass of 4823.58899 which has difference of -0.2 Da.
Sample 2: A sample of polyoxyethylene bis(azide) (Mn = 2000) (Figure 8) was analyzed using sodium trifluoroacetate as a cationization agent and HCCA as the matrix and only exhibited the expected Na+ adducts.
Because of the resolution achieved in this lower mass range, the monoisotopic peaks for each of the n-mers could easily be resolved, and so a monoisotopic peak picking protocol was selected (averaging only the mass signal of the first peak in the isotopic distribution) and all corresponding calculations utilized the monoisotopic masses of each element. MALDI-TOF MS confirms the narrow distribution (Figure 8) of polyoxyethylene bis(azide) (Mn = 2000). Using the equations from step 4, analysis software was used to calculate the following characteristics of the polymer mass distribution: Mn:1940, Mw: 1950, Đ: 1.01.
In order to confirm end group functionalization, an individual n-mer (42) was selected (Figure 9). As with the mass distributions determined above, monoisotopic masses were used because the monoisotopic peaks were well-resolved in each n-mer's isotopic distribution. The theoretical mass value of the 42-mer of polyoxyethylene bis(azide) corresponds to 44.02621 × 42 (the mass of the repeat units) + 42.00922 (mass of the azido end group) + 70.04052 (mass of the azidoethyl end group) + 22.98922 (mass of the sodium cation) = 1984.13978. The observed mass value for n = 42 is 1983.95 which is 0.19 Da different from the theoretical value. It should be noted that especially at higher laser powers, the azide functionality can exhibit metastable fragments; however, this was not observed in this specific case31.
The polyoxyethylene bis(azide) (Mn = 2000) sample maintained its narrow distribution when selectively functionalized by a copper catalyzed azide-alkyne cycloaddition reaction (Figure 10) with 1-ethynyl-4-fluorobenzene(EFB) (Figure 11) to yield a 4-fluorophenyltriazolyl (FPT) group. The spectra exhibited the expected Na+ adducts from using sodium trifluoroacetate as a cationization agent and HCCA as the matrix.
MALDI-TOF MS confirms the narrow distribution (Figure 11) of polyoxyethylene bis(azide) (Mn = 2000) after functionalization with EFB. Using the equations from step 4, analysis software was used to calculate the following polymer characteristics: Mn: 2240, Mw: 2250, Đ: 1.00.
To confirm complete functionalization of the sample, monoisotopic masses were used to analyze a selected individual n-mer (42) (Figure 12). The theoretical mass value of the 42-mer of polyoxyethylene bis(azide) reacted with 1-ethynyl-4-fluorobenzene corresponds to 44.02621 × 42 (the mass of the repeat units) + 162.04675 (mass of the FPT end group) + 190.07805 (mass of the FPT ethyl end group with 1-ethynyl-4-fluorobenzene) + 22.98922 (mass of the sodium cation) = 2224.21484. The observed mass value for n = 42 is 2224.16 which is 0.05 Da different from the theoretical value.
Sample 3: A sample of poly(L-lactide), thiol terminated (Mn = 2500) (Figure 13) was analyzed using sodium trifluoroacetate as a cationization agent and only exhibited the expected Na+ adducts and DHB as the matrix.
MALDI-TOF MS confirms the narrow distribution of poly(L-lactide), thiol terminated (Mn = 2500) (Figure 13). Using the equations from step 4, the program analysis was used to calculate the following polymer characteristics: Mn: 2310, Mw: 2360, Đ: 1.02.
To confirm complete functionalization of the sample, monoisotopic masses were used to analyze a selected individual n-mer (26) (Figure 14). The theoretical mass value of the 26-mer of poly(L-lactide), thiol terminated (Mn = 2500) corresponds to 72.02113 × 26 (the mass of the repeat units) + 17.00274 (mass of the hydroxyl group) + 61.0112 (mass of ω-thiol end group) + 22.98922 (mass of the sodium cation) = 1973.55254. The observed mass value for n = 26 is 1973.62 which is -0.07 Da different from the theoretical value. A smaller signal is observed at 2045.74 which corresponds to 72.02113 × 27 (the mass of the repeat units) + 17.00274 (mass of the hydroxyl end group) + 61.0112 (mass of ω-thiol end group) + 22.98922 (mass of the sodium cation). The theoretical mass is 2045.57367 which is a 0.17 difference from the observed mass. This small intensity, odd-numbered repeat unit is indicative of transesterification during the ring opening polymerization of lactic acid. A third, very minor peak is observed at 2057.73. This is -0.14 Da different than the theoretical mass of a poly(L-lactide) with a carboxylic acid end group (rather than the thiol end group) with a theoretical mass of 72.02113 × 27 (the mass of the repeat units) + 17.00274 (mass of the hydroxyl end group) + 73.02895 (mass of carboxylic acid) + 22.98922 (mass of the sodium cation) = 2057.59142. This additional minor impurity is likely the consequence of initiation from water during the ring opening polymerization of the lactide monomer.
The poly(L-lactide), thiol terminated (Mn = 2500) sample maintained its narrow distribution when selectively functionalized by a thiol-ene reaction (Figure 15) with maleimide (Figure 16). The spectra exhibited the expected Na+ adducts from using sodium trifluoroacetate as a cationization agent and DHB as the matrix.
MALDI-TOF MS confirms the narrow distribution of the poly(L-lactide), thiol terminated (Mn = 2500) after a thiol-ene reaction with maleimide (Figure 16). Using the equations from step 4, analysis software was used to calculate the following polymer characteristics: Mn: 2310, Mw: 2340, Đ: 1.01. It should be noted that the decrease of Mn and Mw in comparison to the starting material is due to ionization bias (one of the shortcomings of MALDI-TOF MS). When the modification to the starting material is relatively small (~97 Da in this particular modification) and the dispersity decreases post-modification, MALDI-TOF MS calculations of average molecular weight can become less accurate.
To confirm complete functionalization of the poly(L-lactide), thiol terminated (Mn = 2500) with maleimide via a thiol-ene reaction, monoisotopic masses were used to analyze a selected individual n-mer (26) (Figure 17). The theoretical mass value of the 26-mer of poly(L-lactide) thiol terminated corresponds to 72.02113 × 26 (the mass of the repeat units) + 17.00274 (mass of the hydroxyl end group) + 158.02757 (mass of ω- thiol end group linked to maleimide) + 22.98922 (mass of the sodium cation) = 2070.56891. The observed mass value for n = 26 is 2070.54 which is 0.03 Da different from the theoretical value. The same species ionizing with potassium is also observed at 2086.49, which corresponds to a 0.05 Da difference form the theoretical mass. A very small peak is observed at 2167.58 which corresponds to 72.02113 × 28 (the mass of the repeat units) + 17.00274 (mass of the hydroxyl end group) + 72.02168 (mass of carboxylate anion) + 22.98922 (mass of the sodium cation) + 38.96371 (mass of potassium cation). The theoretical mass is 2167.56844 which is a -0.01 difference from the observed mass and is indicative of the same trace impurity from water initiation that was observed in the starting material. This polymer exhibits ionization with one equivalent of sodium, one of potassium, and loss of a proton. The loss of the carboxylic acid proton and complexation with two cations is a common mode of ionization for monocarboxylic acid functionalized polymers. It is important to note that the same shift in mass that is observed for the thiol-ene reaction products does not occur for this carboxylic acid-terminated compound which further indicates that it lacked the thiol end group to undergo the functionalization reaction.
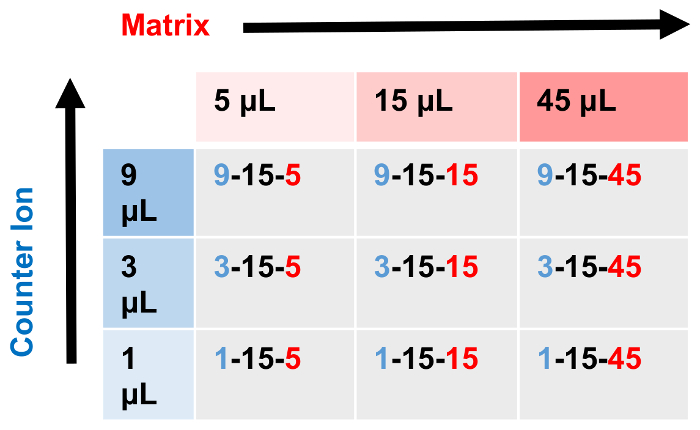
Figure 1: 3 x 3 grid for sample ratio determination. Using a 3 x 3 grid of samples, the relative concentrations of cationization agent-analyte-matrix can be systematically varied to empirically determine an optimized sample preparation. This is typically done by holding one of the three variables constant (15 µL of analyte solution) while increasing the amount of the other two (cationization agent (y-axis) and matrix (x-axis)) components by a set multiple (3-fold in the example depicted). Please click here to view a larger version of this figure.
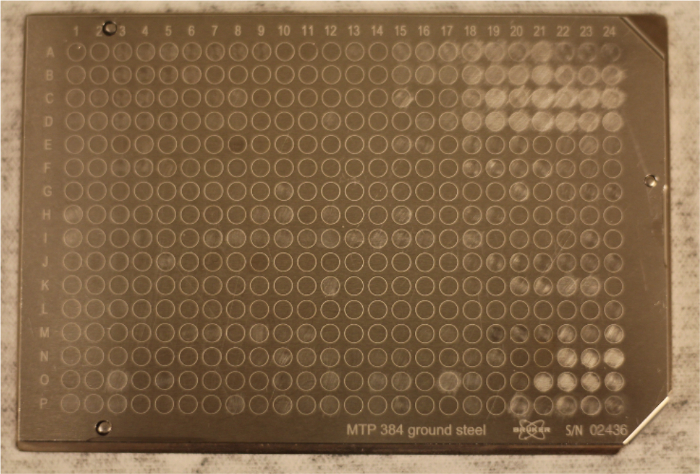
Figure 2: MALDI-TOF MS target plate. The MALDI-TOF MS target plate is a metal plate which holds the MALD-TOF MS samples in individual wells for analysis. Please click here to view a larger version of this figure.
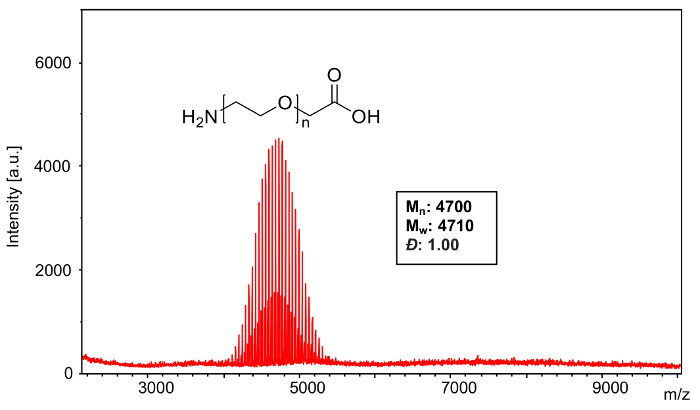
Figure 3: MALDI-TOF mass spectrum of Sample 1. This full spectrum shows the overall distribution of poly(ethylene glycol) 2-aminoethyl ether acetic acid (Mn= 5000) ionized with both Na+ and K+. Please click here to view a larger version of this figure.
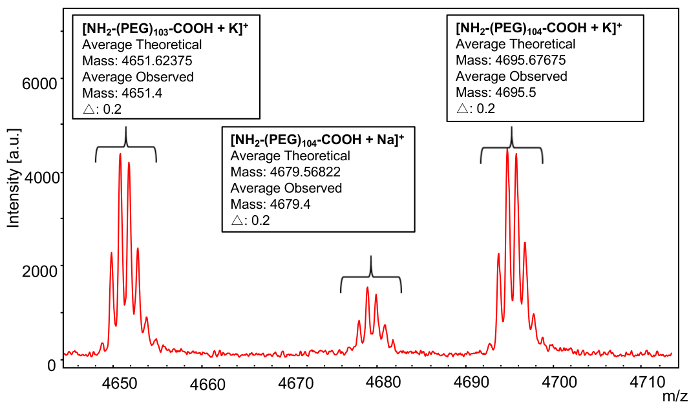
Figure 4: MALDI-TOF mass spectrum of an individual repeat unit of Sample 1. This spectrum shows an individual repeat unit of poly(ethylene glycol) 2-aminoethyl ether acetic acid (Mn = 5000) for end group analysis. Please click here to view a larger version of this figure.
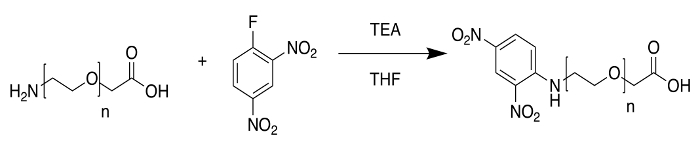
Figure 5: Reaction scheme for Sample 1 modification. To confirm the end groups of the starting material, poly(ethylene glycol) 2-aminoethyl ether acetic acid was reacted with 2,4-dinitrofluorobenzene (also known as Sanger Reagent). Please click here to view a larger version of this figure.
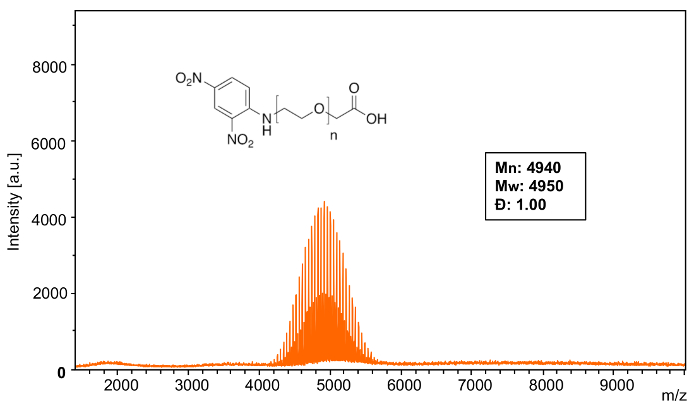
Figure 6: MALDI-TOF mass spectrum of Sample 1 modification. This full spectrum shows the overall distribution of poly(ethylene glycol) 2-aminoethyl ether acetic acid (Mn = 5000) functionalized with 2,4-dinitrofluorobenzene. Please click here to view a larger version of this figure.
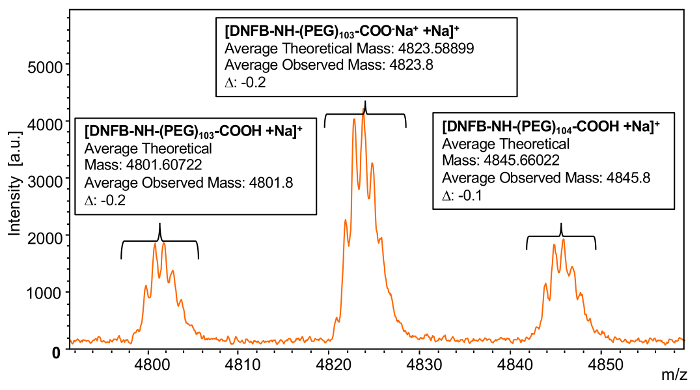
Figure 7: MALDI-TOF mass spectrum of an individual repeat unit of Sample 1modification. In order to confirm end group functionalization, this spectrum shows an individual repeat unit of poly(ethylene glycol) 2-aminoethyl ether acetic acid (Mn = 5000) after reaction with 2,4-dinitrofluorobenzene. Please click here to view a larger version of this figure.
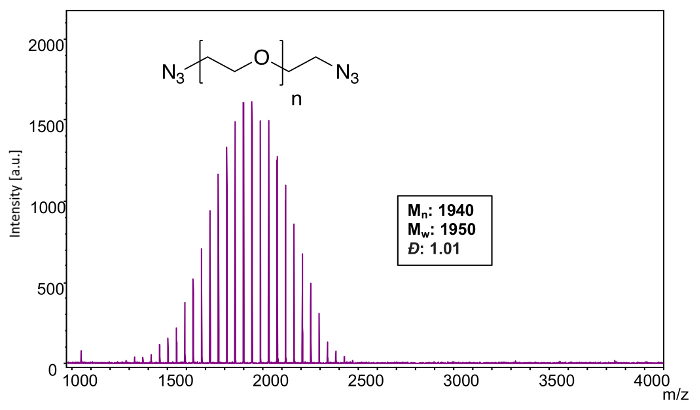
Figure 8: MALDI-TOF mass spectrum of Sample 2. This full spectrum shows the overall distribution of polyoxyethylene bis(azide)(Mn = 2000) ionized with Na+ adducts. Please click here to view a larger version of this figure.
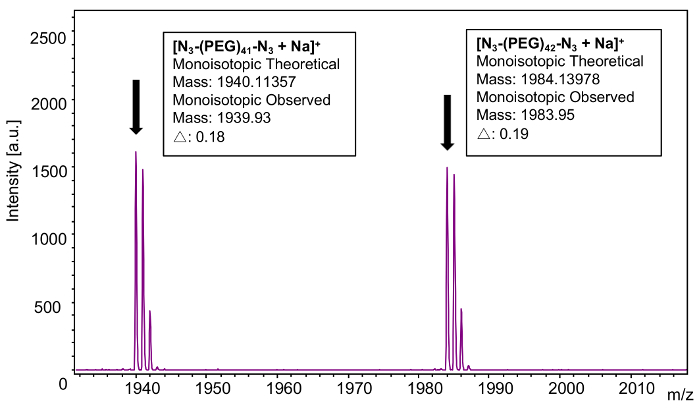
Figure 9: MALDI-TOF mass spectrum of an individual repeat unit of Sample 2. This spectrum shows a repeat unit of polyoxyethylene bis-azide (Mn = 2000) in order to confirm end groups Please click here to view a larger version of this figure.
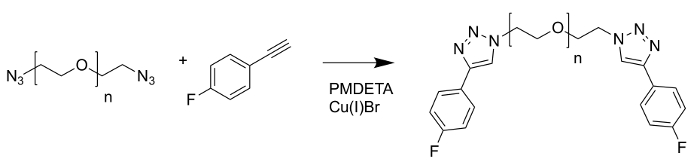
Figure 10: Reaction scheme for Sample 2 modification. To confirm the end groups of the starting material, polyoxyethylene bis-azide (Mn = 2000) was reacted with 1-ethynyl-4-fluorobenzene via a copper-catalyzed azide-alkyne cycloaddition (CuAAC). Please click here to view a larger version of this figure.
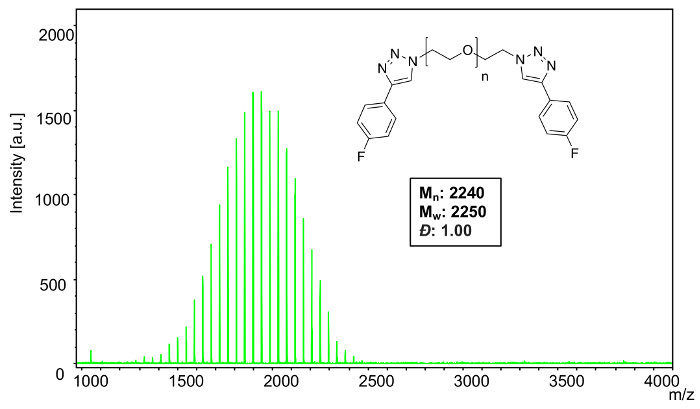
Figure 11: MALDI-TOF mass spectrum of Sample 2 modification. This full spectrum shows the overall distribution of polyoxyethylene bis(azide) (Mn = 2000) functionalized with 1-ethynyl-4-fluorobenzene. Please click here to view a larger version of this figure.
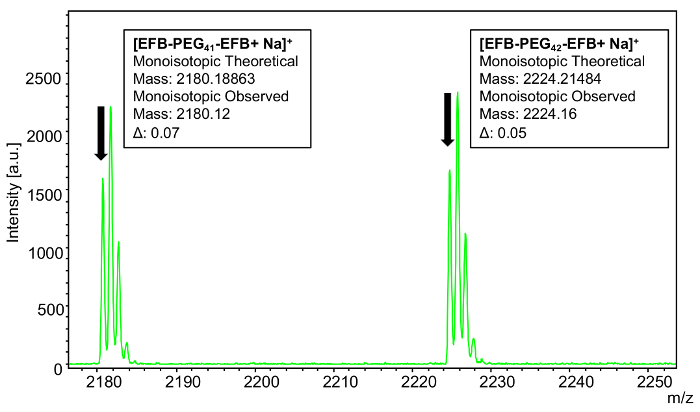
Figure 12: MALDI-TOF mass spectrum of an individual repeat unit of Sample 2 modification. This spectrum shows an individual repeat unit of polyoxyethylene bis(azide) (Mn = 2000) reacted with 1-ethynyl-4-fluorobenzene via copper catalyzed azide-alkyne cycloaddition to confirm end group functionalization. Please click here to view a larger version of this figure.
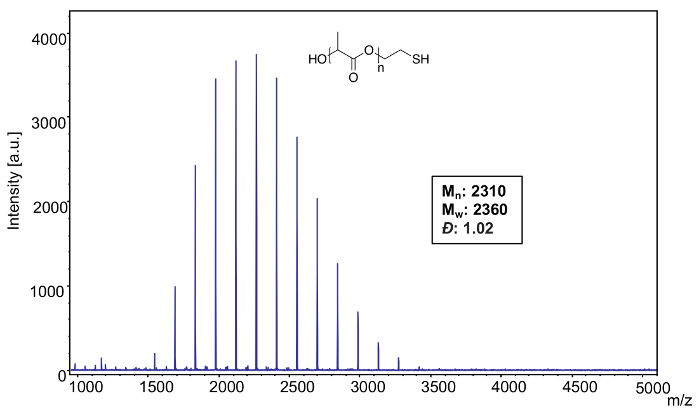
Figure 13: MALDI-TOF mass spectrum of Sample 3. This full spectrum shows the overall distribution of poly(L-lactide), thiol terminated (Mn = 2500). Please click here to view a larger version of this figure.
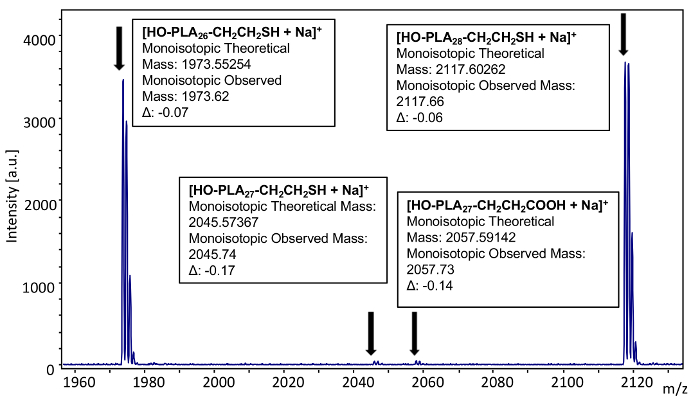
Figure 14: MALDI-TOF mass spectrum of an individual repeat unit of Sample 3. The spectrum shows an individual repeat unit of poly(L-lactide), thiol terminated (Mn = 2500) to confirm end groups. Please click here to view a larger version of this figure.

Figure 15: Reaction scheme for Sample 3 modification. To confirm the end groups of the starting material, poly(L-lactide), thiol terminated (Mn = 2500) was reacted with maleimide via a thiol-ene coupling. Please click here to view a larger version of this figure.
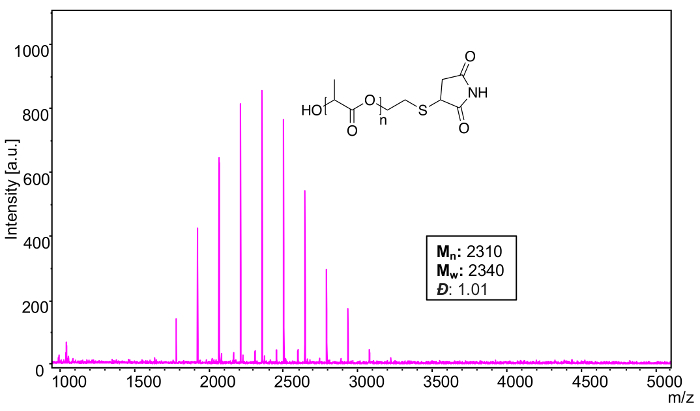
Figure 16: MALDI-TOF mass spectrum of Sample 3 modification. This full spectrum shows the overall distribution of the product of the reaction between poly(L-lactide), thiol terminated (Mn = 2500) and maleimide. Please click here to view a larger version of this figure.
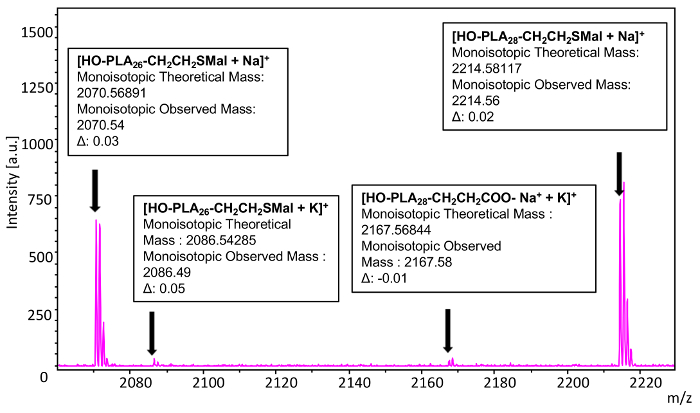
Figure 17: MALDI-TOF mass spectrum of an individual repeat unit of Sample 3 modification. In order to confirm end group functionalization, this spectrum shows an individual repeat unit of poly(L-lactide), thiol terminated (Mn = 2500) after the thiol-ene reaction with maleimide. Please click here to view a larger version of this figure.
Discussion
MALDI-TOF mass spectrometry is an invaluable analytical tool for polymer characterization because of its ability to generate polymer ions in the singly charged state and with minimal fragmentation. This soft ionization technique utilizes short laser pulses to desorb solid-state samples of the polymer analyte embedded in a matrix compound to generate polymer ions in the gas phase. The macromolecules are typically ionized by complexation with cations that are added to the matrix to enable their analysis by mass spectrometry. These macromolecular ions are then accelerated by an extraction voltage to bring them into the field-free region of the flight tube which can enable their m/z to be determined based on their time-of-flight between the ion source and the detector5,32.
Compared to other polymer characterization techniques, MALDI-TOF MS spectra quality is heavily dependent on data acquisition parameters and sample preparation. Although there is no set formula for sample preparation, understanding the function of each component of the sample preparation allows for more rapid empirical optimization. The most important factor in MALDI sample preparation is selection of the matrix because compatibility of the matrix with the polymer analyte is critical for allowing excited matrix to generate single, desorbed macromolecules in an ionized state5,15,17,19. Once appropriate matrix and cationization agents have been selected, the correct ratio of analyte, matrix, and cationization agent must be determined. This can be achieved empirically by creating a two-dimensional grid of samples (Figure 1) on the MALDI-TOF MS target plate (Figure 2) with increasing matrix concentration on one axis and increasing cationization agent concentration on the other.
Similar to MALDI sample preparation, there is no set formula for determining data acquisition parameters; however, certain trends should be considered to expedite spectral optimization. Reflectron mode, which increases resolution but decreases overall signal, is typically chosen for lower mass ranges (in these examples, below 4,000 Da) where isotopic resolution can be achieved. In these cases, monoisotopic mass calculations and peak picking methods were used. For polymer samples with masses above 4,000 Da, linear mode was used with average mass calculations and peaking picking methods. To improve signal resolution, the ion source voltages should be adjusted in small increments with the general trend of larger mass polymers having a larger voltage differential (IS1 versus IS2).
While optimized sample preparation and acquisition parameters can provide precision, mass accuracy can only be achieved through effective calibration. The time-of-flight for a given mass can vary subtly with respect to the variable acquisition parameters and even plate positions, therefore a calibration should be carried out for each set of optimized acquisition parameters in order to yield accurate mass determinations5,30. Once the acquisition parameters and sample preparation have been optimized, the spectra should be calibrated using these exact same conditions.
Because of the exceptional resolution and mass accuracy observed in the optimized MALDI-TOF mass spectra of polymers, this technique has become a valuable complimentary tool for determining polymer mass distribution data. However, its ability to resolve individual repeat units within the polymer mass distribution provides a particular advantage for end group analysis relative to other polymer characterization techniques such as gel permeation chromatography (GPC) and nuclear magnetic resonance (NMR). This is particularly valuable for determining the fidelity of end group functionalization reactions and the quantitative nature of end group conjugations reactions. This manuscript has demonstrated the ability to resolve the mass of individual polymer repeat units with up to two decimals points of mass accuracy, enabling the confirmation of end group modifications with a high level of confidence. With the substantial advances that have been made recently in the field of precision polymer synthesis, MALDI-TOF MS is becoming an increasingly important tool for determine macromolecular structure and functionality.
Disclosures
The authors have financial interest related to the SpheriCal calibrants used in this study.
Acknowledgements
The authors acknowledge the Smart MAterials Design, Analysis, and Processing consortium (SMATDAP) funded by the National Science Foundation under cooperative agreement IIA-1430280 and the LA Board of Regents for a graduate fellowship (MEP). Polymer samples for these experiments were provided by MilliporeSigma (Sigma-Aldrich). Open Access publication of this article is sponsored by MilliporeSigma.
Materials
| Name | Company | Catalog Number | Comments |
|---|---|---|---|
| polyoxyethylene bis(azide) (Mn=2000) | MilliporeSigma (Aldrich) | 689696 | http://www.sigmaaldrich.com/catalog/product/aldrich/689696?lang=en®ion=US |
| poly(ethylene glycol) 2-amino-ethyl ether acetic acid (Mn= 5000) | MilliporeSigma (Aldrich) | 757918 | http://www.sigmaaldrich.com/catalog/product/aldrich/757918?lang=en®ion=US |
| poly(L-lactide), thiol terminated (Mn=2500) | MilliporeSigma (Aldrich) | 747386 | http://www.sigmaaldrich.com/catalog/product/aldrich/747386?lang=en®ion=US |
| SpheriCal® peptide low | MilliporeSigma (Sigma-Aldrich) | PFS20 | http://www.sigmaaldrich.com/catalog/product/sial/pfs20?lang=en®ion=US |
| SpheriCal® peptide medium | MilliporeSigma (Sigma-Aldrich) | PFS21 | http://www.sigmaaldrich.com/catalog/product/sial/pfs21?lang=en®ion=US |
| SpheriCal® peptide high | MilliporeSigma (Sigma-Aldrich) | PFS22 | http://www.sigmaaldrich.com/catalog/product/sial/pfs22?lang=en®ion=US |
| 2,4 dinitrofluorobenzene | TCI | A5512 | |
| maleimide | MilliporeSigma (Aldrich) | 129585 | http://www.sigmaaldrich.com/catalog/product/aldrich/129585?lang=en®ion=US |
| 1-ethynylfluorobenzene | Fisher Scientific | 766-98-3 | |
| triethylamine | MilliporeSigma (Sigma-Aldrich) | 471283 | http://www.sigmaaldrich.com/catalog/product/sial/471283?lang=en®ion=US |
| N,N,N',N",N"-pentamethyldiethylenetriamine | MilliporeSigma (Aldrich) | 369497 | http://www.sigmaaldrich.com/catalog/product/aldrich/369497?lang=en®ion=US |
| Copper(I)Bromide | MilliporeSigma (Aldrich) | 254185 | http://www.sigmaaldrich.com/catalog/product/aldrich/254185?lang=en®ion=US |
| glacial acetic acid | Fisher Scientific | A38212 | |
| sodium metabisulfite | MilliporeSigma (Sigma-Aldrich) | 13459 | http://www.sigmaaldrich.com/catalog/product/sigald/13459?lang=en®ion=US |
| potassium trifluoroacetate | MilliporeSigma (Aldrich) | 281883 | http://www.sigmaaldrich.com/catalog/product/aldrich/281883?lang=en®ion=US |
| trans-2-[3-(tert-butylphenyl)-2-methyl-2-properylidene]malononitrile | MilliporeSigma (Aldrich) | 727881 | http://www.sigmaaldrich.com/catalog/product/aldrich/727881?lang=en®ion=US |
| a-cyano-4-hydroxycinnamic acid | MilliporeSigma (Sigma) | C8982 | http://www.sigmaaldrich.com/catalog/product/sigma/c8982?lang=en®ion=US |
| tetrahydrofuran | Fisher Scientific | T425-1 | |
| dichloromethane | VWR Analytical | BDH1113-4LG |
References
- Wu, K. J., Odom, R. W. Peer Reviewed: Characterizing Synthetic Polymers by MALDI MS. Anal. Chem. 70, 456A-461A (1998).
- Lowe, A. B. Thiol-ene "click" reactions and recent applications in polymer and materials synthesis: a first update. Polym. Chem. 5, 4820-4870 (2014).
- Shi, Y., Cao, X., Gao, H. The use of azide-alkyne click chemistry in recent syntheses and applications of polytriazole-based nanostructured polymers. Nanoscale. 8, 4864-4881 (2016).
- Lutz, J. F. 1,3-dipolar cycloadditions of azides and alkynes: a universal ligation tool in polymer and materials science. Angew. Chem. Int. Ed. 46, 1018-1025 (2007).
- Montaudo, G., Samperi, F., Montaudo, M. S. Characterization of synthetic polymers by MALDI-MS. Prog. Polym. Sci. 31, 277-357 (2006).
- Weidner, S. M., Trimpin, S. Mass spectrometry of synthetic polymers. Anal. Chem. 80, 4349-4361 (2008).
- Zhu, H., Yalcin, T., Li, L. Analysis of the accuracy of determining average molecular weights of narrow polydispersity polymers by matrix-assisted laser desorption ionization time-of-flight mass spectrometry. J. Am. Soc. Mass Spectr. 9, 275-281 (1998).
- Cortez, M. A., Grayson, S. M. Application of time-dependent MALDI-TOF mass spectral analysis to elucidate chain transfer mechanism during cationic polymerization of oxazoline monomers containing thioethers. Macromolecules. 43, 10152-10156 (2010).
- Liu, J., Loewe, R. S., McCullough, R. D. Employing MALDI-MS on poly(alkylthiophenes): analysis of molecular weights, molecular weight distributions, end-group structures, and end-group modifications. Macromolecules. 32, 5777-5785 (1999).
- Zhang, B., et al. Determination of polyethylene glycol end group functionalities by combination of selective reactions and characterization by matrix assisted laser desorption/ionization time-of-flight mass spectrometry. Anal. Chim. Acta. 816, 28-40 (2014).
- Li, Y., Hoskins, J. N., Sreerama, S. G., Grayson, M. A., Grayson, S. M. The identification of synthetic homopolymer end groups and verification of their transformations using MALDI-TOF mass spectrometry. J. Mass Spectrom. 45, 587-611 (2010).
- Enjalbal, C., et al. MALDI-TOF MS analysis of soluble PEG based multi-step synthetic reaction mixtures with automated detection of reaction failure. J. Am. Soc. Mass Spectr. 16, 670-678 (2005).
- Laurent, B. A., Grayson, S. M. An efficient route to well-defined macrocyclic polymers via "click" cyclization. J. Am. Chem. Soc. 128, 4238-4239 (2006).
- Owens, K. G., Hanton, S. Conventional MALDI sample preparation. Maldi Mass Spectrometry for Synthetic Polymer Analysis. Li, L. , John Wiley & Sons, Inc. 129-158 (2009).
- Hanton, S. D. Mass spectrometry of polymers and polymer surfaces. Chem. Rev. 101, 527-570 (2001).
- Samperi, F., Montaudo, G., Montaudo, M. S. Matrix-assisted laser desorption/ionization mass spectrometry of polymers (MALDI-MS). Mass Spectrometry of Polymers. Montaudo, G., Lattimer, R. P. , CRC Press. Ch. 10 419-500 (2001).
- Nielen, M. W. F. Maldi time-of-flight mass spectrometry of synthetic polymers. Mass Spectrom. Rev. 18, 309-344 (1999).
- NIST, Synthetic Polymer MALDI Recipes Search Form. , Available from: http://maldi.nist.gov/ (2014).
- Hanton, S. D., Owens, K. G. Polymer MALDI sample preparation. Mass Spectrometry in Polymer Chemisty. Barner-Kowollik, C., Gründling, T., Falkenhagen, J., Weidner, S. , Wiley-VCH Verlag GmbH & Co. 119-147 (2011).
- Vestal, M. L., Juhasz, P., Martin, S. A. Delayed extraction matrix-assisted laser desorption time-of-flight mass spectrometry. Rapid Commun. Mass Spectrom. 9, 1044-1050 (1995).
- Kaufmann, R., Spengler, B., Lutzenkirchen, F. Mass spectrometric sequencing of linear peptides by product-ion analysis in a reflectron time-of-flight mass spectrometer using matrix-assisted laser desorption ionization. Rapid Commun. Mass Sp. 7, 902-910 (1993).
- Mamyrin, B. A., Karataev, V. I., Shmikk, D. V., Zagulin, V. A. The mass-reflectron, a new nonmagnetic time-of-flight mass spectrometer with high resolution. Sov. Phys. JETP. 37, 45(1973).
- Belu, A. M., DeSimone, J. M., Linton, R. W., Lange, G. W., Friedman, R. M. Evaluation of matrix-assisted laser desorption ionization mass spectrometry for polymer characterization. J. Am. Soc. Mass Spectr. 7, 11-24 (1996).
- Kaufmann, R., Chaurand, P., Kirsch, D., Spengler, B. Post-source decay and delayed extraction in matrix-assisted laser desorption/ionization-reflectron time-of-flight mass spectrometry. Are there trade-offs? Rapid Commun. Mass Sp. 10, 1199-1208 (1996).
- Grayson, S. M., Myers, B. K., Bengtsson, J., Malkoch, M. Advantages of monodisperse and chemically robust "SpheriCal" polyester dendrimers as a "universal" MS calibrant. J. Am. Soc. Mass Spectr. 25, 303-309 (2014).
- McEwen, C. N., Larsen, R. S. Accurate mass measurement of proteins using electrospray ionization on a magnetic sector instrument. Rapid Commun. Mass Sp. 6, 173-178 (1992).
- Anacleto, J. F., Pleasance, S., Boyd, R. K. Calibration of ion spray mass spectra using cluster ions. J. Mass Spectrom. 27, 660-666 (1992).
- Fales, H. M. Calibration of mass ranges up to m/z 10,000 in electrospray mass spectrometers. J. Am. Soc. Mass Spectrom. 10, 273-276 (1999).
- Hop, C. E. C. A. Generation of high molecular weight cluster ions by electrospray ionization; implications for mass calibration. J. Mass Spectrom. 31, 1314-1316 (1996).
- Xiang, B., Prado, M. An accurate and clean calibration method for MALDI-MS. J. Biomol. Tech. 21, 116-119 (2010).
- Li, Y., Hoskins, J. N., Sreerama, S. G., Grayson, S. M. MALDI−TOF mass spectral characterization of polymers containing an azide group: evidence of metastable ions. Macromolecules. 43, 6225-6228 (2010).
- Zenobi, R. Ionization processes and detection in MALDI-MS of polymers. MALDI Mass Spectrometry for Synthetic Polymer Analysis. Li, L. , John Wiley & Sons, Inc. 9-26 (2009).
Reprints and Permissions
