A new technique for applying consolidation pressure on the vacuum bag lay-up to fabricate composite laminates is described. The goal of this protocol is to develop a simple, cost-effective technique to improve the quality of laminates fabricated by the wet lay-up vacuum bag method.
Method Article
Magnet Assisted Composite Manufacturing: A Flexible New Technique for Achieving High Consolidation Pressure in Vacuum Bag/Lay-Up Processes
* These authors contributed equally
In This Article
Summary
Abstract
This work demonstrates a protocol to improve the quality of composite laminates fabricated by wet lay-up vacuum bag processes using the recently developed magnet assisted composite manufacturing (MACM) technique. In this technique, permanent magnets are utilized to apply a sufficiently high consolidation pressure during the curing stage. To enhance the intensity of the magnetic field, and thus, to increase the magnetic compaction pressure, the magnets are placed on a magnetic top plate. First, the entire procedure of preparing the composite lay-up on a magnetic bottom steel plate using the conventional wet lay-up vacuum bag process is described. Second, placement of a set of Neodymium-Iron-Boron permanent magnets, arranged in alternating polarity, on the vacuum bag is illustrated. Next, the experimental procedures to measure the magnetic compaction pressure and volume fractions of the composite constituents are presented. Finally, methods used to characterize microstructure and mechanical properties of composite laminates are discussed in detail. The results prove the effectiveness of the MACM method in improving the quality of wet lay-up vacuum bag laminates. This method does not require large capital investment for tooling or equipment and can also be used to consolidate geometrically complex composite parts by placing the magnets on a matching top mold positioned on the vacuum bag.
Introduction
Fiber-reinforced polymer composites have been widely used in the automotive1,2, aerospace3,4, marine5,6, and construction7,8 industries because of their unique properties such as high specific strength and modulus, favorable fatigue behavior, and corrosion resistance. Currently, high-quality composite laminates are predominantly fabricated using layers of pre-impregnated fabric (prepreg) cured in an autoclave under elevated temperature and high consolidation pressure of 0.27-0.69 MPa (40-100 psi)9. Somewhat lower quality composite laminates are produced by the wet lay-up process, where a higher consolidation pressure is not applied. This process is labor-intensive, does not require expensive equipment, and is performed by placing one ply of dry fabric on a mold and subsequently applying resin. In most applications, a hand-held roller is used to force the resin into the fiber reinforcement and squeeze out excess resin. This sequence is repeated until the desired thickness is obtained. The quality of the laminates produced by wet lay-up can be greatly improved by applying a combination of vacuum (called the wet lay-up vacuum bag process) and an additional consolidation pressure in an autoclave during cure. Applying high consolidation pressure during cure facilitates the resin flow, leading to an increase in the fiber volume fraction and a removal of voids10,11 which results in enhancement of mechanical properties. Abraham et al.12 showed that high-quality plain weave E-glass composite laminates with a high fiber volume fraction of approximately 64% and low void volume fraction of 1.6% can be fabricated using the wet lay-up vacuum bag when a consolidation pressure of 1.2 MPa is applied in an autoclave.
Voids are one of the most common defects that are formed during the manufacturing of composite laminates. Voids ranging from a few microns to several hundred microns are formed primarily due to the entrapped air during lay-up, dissolved moisture in the resin, and expelled volatiles during cure13,14,15. Also, the dynamics of impregnation of fibrous reinforcement are found to have a significant effect on void entrapment16,17. It is widely accepted that the presence of voids in a composite laminate can lead to a substantial reduction of the strength13,18,19, modulus20,21, fracture toughness22, and fatigue life23,24 of the laminates. For instance, Judd and Wright25 found that each 1% increase in void content (up to 4%), results in an approximately 7% drop in the short beam shear properties. Moreover, Ghiorse26 found that, in carbon/epoxy composites, for each 1% increase in void content, a 10% reduction in interlaminar shear and flexural strength and a 5% reduction in flexural modulus may be seen. In addition, voids have adverse effects on crack initiation and propagation as well as moisture absorption27,28. It is well-known that the rate of moisture absorption for laminates with higher void contents is greater, and the absorbed moisture may cause the deterioration of the fiber-matrix interface and inferior long-term mechanical properties29,30,31,32. Thus, to ensure consistency of the mechanical properties and achieve the highest quality of composite products, the void content should be minimized.
Although curing a composite laminate in an autoclave produces reliable, high-quality parts, the product cost would be high due to initial capital investment and excessive energy usage. In addition to autoclave cure, a wide variety of techniques such as vacuum assisted resin transfer molding (VARTM) and Quickstep process have been developed and used to fabricate composite laminates out of autoclave32,33,34,35,36. However, due to the absence of a uniform, high pressure, the laminates produced by these methods often have lower mechanical properties compared to those made in autoclaves37. Recently, a novel technique referred to as magnet assisted composite manufacturing (MACM) has been utilized for improving the quality of wet lay-up vacuum bag composite laminates by applying a consolidation pressure generated by a set of high power permanent magnets38,39. The application of this technique was then extended to produce high-quality, structural composite laminates out of an autoclave using high-temperature permanent magnets40.
In this paper, a protocol for manufacturing wet lay-up vacuum bag composite laminates using MACM technique is presented. In MACM, Neodymium-Iron-Boron permanent magnets are utilized to apply a sufficiently high consolidation pressure during cure, and thus, improve the quality of laminates. First, the preparation of 6-ply, plain weave E-glass/epoxy composite lay-up on a bottom steel plate is described. Then, the arrangement of permanent magnets in alternating polarity on a top steel plate is demonstrated, along with its placement on the vacuum bag to apply a consolidation pressure on the composite lay-up. Finally, we outline the steps for measurement of magnetic compaction pressure, as well as the methods used for the characterization of void and fiber volume fractions, microstructure, and mechanical properties of composite laminates. The effectiveness of the MACM process is examined by fabricating wet lay-up vacuum bag laminates made under magnetic pressure and comparing their properties to those fabricated by the conventional wet lay-up vacuum bag without magnets. The results obtained prove the capability of the MACM method to improve the overall laminate quality. This method is a low-cost and simple way of manufacturing high-quality laminates and can be applied to fabricate large and geometrically complex composite components with relative ease.
Protocol
Caution: Please consult all relevant material safety data sheets (MSDS) before use. Use personal protective equipment (safety glasses, gloves, lab coat, full-length pants, and closed-toe shoes).
1. Materials
- Cut 6 plies of 20.3 cm х 15.2 cm, plain weave glass fabric with a rotary fabric cutter.
NOTE: The plain weave fabric can be replaced by other fabric types including non-woven, random mats. Carbon fibers can also be used in this method. - Prepare the resin system by first weighing the epoxy resin, INF (40 g), on a tared balance, and then adding the hardener, INF (10.96 g), using a weight ratio of 100 to 27.4. Stir the resin/hardener mixture (at 37 rad s-1) until fully dispersion is reached (for 5 min).
NOTE: (1) The type of resin can be substituted with any type of resin suitable for wet lay-up vacuum bag processes. (2) The selection of epoxy resin-to-hardener ratio is dependent on the resin and hardener combination. (3) The selection of the weight of the resin/hardener mixture depends on the desired fiber volume fraction of finished part and the expected waste amount such as the amount of resin bleeding out, remaining resin on the brush, etc. Considering the weight of the 6-plies of fabric to be approximately 34 g, the resin to fiber ratio of 60 to 40, by weight, was chosen. - Degas the resin (approximately 15 min) in the resin trap to remove all the trapped air formed during the mixing of the epoxy resin and hardener.
2. Composite Manufacturing Using Magnetic Pressure in a Wet Lay-up Vacuum Bag Process
NOTE: Figure 1 shows a simplified schematic of preparation of composite lay-up and applying magnetic pressure, which is described in sections 2.1-2.15.
- Prepare all the material required for the experiment:
- Place twenty-five N52 Neodymium-Iron-Boron (NdFeB) permanent magnets (2.54 cm length, 2.54 cm width, and 1.27 cm thickness), magnetized through their thickness, on a 4.76 mm-thick steel top plate. Arrange the magnets in 5 × 5 square configuration in alternating polarity. During arrangement and placement of permanent magnets, care must be taken as there is a risk of injury.
- Place a 0.3 mm-thick aluminum caul plate (20.3 х 15.2 cm2) pre-coated with PTFE release agent exactly in the middle of a perforated release film (26.7 х 21.6 cm2).
- Use 12.7-mm wide polyester tape to tape the perimeter of the caul plate to the release film.
- Place a 12.7-mm wide tacky tape around the periphery of a 43.2 × 27.9 cm2 area on the surface of a 6.35 mm-thick, 61.0 × 61.0 cm2, steel bottom tool plate.
- Prior to laying the fabric, apply a coat of resin on the tool plate, covered by a layer of nonporous PTFE-coated fiberglass release film (76 µm-thick). Apply just enough resin to saturate the first ply of fabric.
- Place the first ply of fabric, and then, with a roller, press and squeeze out excess resin.
- Fully saturate the fiber bed by pouring a small amount of additional resin on top of the fabric and then spreading evenly over the entire area with squeegees.
- Repeat steps 2.4 and 2.5 for all the plies (6-ply in this case). Ensure that all the plies are fully saturated with resin and that approximately the same amount of resin (~8.5 g) is used for each ply.
- Place the caul plate, attached to the perforated release film, on top of the fiber preform, followed by a layer of 0.5-inch wide polyester tape around the perimeter of the release film.
- Insert two pieces of breather/bleeder cloth on to the fiber preform and place the bottom piece of the twist lock vacuum valve on top of the breather cloth. Ensure that the valve is located far enough from the saturated preform to protect the valve from contact with the excess resin.
- Remove the paper backing of the tacky tape and place the vacuum bag on the tool plate while pressing it firmly against the tape to seal it.
- Connect one side of the vacuum hose to the top piece of vacuum valve and the other side to the pressure regulator, connected to the vacuum pump.
- Put a small slit in the bag where the bottom piece of the valve is, insert the top piece of the vacuum valve into the hole, and then gently twist it shut so that the bag underneath does not wrinkle.
- Start the vacuum pump until a constant vacuum pressure of 93 kPa (13.5 psi) is reached to remove any volatiles generated during cure and excess resin. Ensure that the vacuum system is leakage free.
- Clamp the four edges of the bottom tool plate to a support base. The bottom tool plate must be fixed against movement prior to placement of magnets because the magnetic attraction force may move and shift the plate upward.
- Allow the laminate to cure for 45 min at room temperature, then place the set of magnets (prepared in section 2.1.1) on the vacuum bag, followed by increasing the temperature of the tool plate to 60 °C at a ramp rate of ~5 °C/min.
NOTE: (1) The cure cycle is dependent on the resin selected. (2) Silicone rubber heat sheets are placed under the tool plate for heating. - After curing for 8 h at 60 °C, remove the vacuum bag and demold the composite laminate.
NOTE: To assess the improvement in the quality of laminates as a result of applying magnetic pressure, we fabricated a series of laminates using a conventional wet lay-up vacuum bag process without applying any external pressure. The quality of these laminates was compared with those made under magnetic pressure. To fabricate laminates using conventional wet lay-up vacuum bag, steps 2.1.2 to 2.15 were followed, except for the placement of magnets. To assess the repeatability of each fabrication process, a second laminate was fabricated under identical conditions.
3. Measurement of Magnetic Compaction Pressure
- Attach the top plate to the end of the load cell on a mechanical testing instrument.
- Place one N52 Neodymium-Iron-Boron permanent magnet on the bottom movable plate, which is positioned at a sufficient distance (at least 25 mm) away from the top fixed plate at the beginning of the test.
NOTE: For measurement of magnetic force, both top and bottom plates should be made of magnetic material such as steel. - Move the bottom plate upward at a low speed of 1-2 mm/min toward the top plate and record the generated magnetic force while measuring the corresponding displacement from the linear variable differential transformer (LVDT) at a sampling rate of 6 Hz.
NOTE: (1) The speed of this test is critical because the force generated by magnets depends exponentially on the air gap in between. (2) All magnetic measurements are performed at room temperature. - Continue to monitor the magnetic compaction force until the top surface of the magnet touches the top plate.
- Calculate the magnetic compaction pressure by dividing the magnetic force by the cross-sectional area of the magnet.
4. Resin Burn-off and Thermogravimetric Analysis (TGA)
- Resin burn-off
- Cut three specimens from each laminate for a resin burn-off test according to the ASTM D2584-11 specifications41.
- Place each specimen in a separate porcelain crucible and note the weights of specimens as well as the crucibles.
- Place the crucibles containing samples in a furnace, turn on the furnace, raise the furnace temperature to 600 °C, and allow the resin to burn-off for about 4 h.
- Turn off the furnace, carefully open the furnace door, and allow it to cool to room temperature before removing the crucibles.
- After cool-down, remove the crucibles from the furnace and weigh the recovered glass fibers.
NOTE: The fibers may lose weight during the resin burn-off. The amount of weight loss of fibers when they are exposed to high temperatures can be determined by the thermogravimetric analysis (TGA).
- Thermogravimetric analysis (TGA)
- Measure the weight loss of fiber as a function of increasing temperature in air at atmospheric pressure using TGA. Place approximately 30 mg of the fiber in a platinum pan and load it into the TGA device.
- Ramp the temperature from 25 °C to 600 °C at a rate of 15 °C/min, hold the temperature for 4 h, and calculate the percent reduction in weight. The weight loss percentage of the fibers are accounted for during fiber volume fraction and void volume fraction calculations.
NOTE: According to the TGA test results at 600 °C, the weight loss for plain weave and random mat preforms used in this study are 0.2% and 5.46%, respectively.
5. Void and Fiber Volume Fraction Calculation
- Determine the density of the composite specimen, matrix, and fiber:
- Use the suspension method42 to determine the density of bulk composite specimen.
NOTE: For this method, a transparent heavy liquid with a density of 2.49 g/cm3 is used so that the composite specimen initially floats when immersed in the heavy liquid.- Reduce the density of the heavy liquid by adding 3 mL water and mixing the solution by magnetic stirrer at 105 rad s-1 for 5 min. Repeat this step until the composite specimen begins to slowly suspend in the heavy liquid/water mixture.
- Once the solution density has been adjusted so that the specimen remains suspended in the heavy liquid and water mixture, measure the solution density using a specific gravity cup.
- Prepare void-free resin specimens using the same cure cycle given in steps 2.14 and 2.15 and then determine the density of cured resin specimens using the same procedure as 5.1.1.1 and 5.1.1.2.
NOTE: The density of cured INF and EPON specimens are 1.152 ± 0.003 g/cm3 and 1.171 ± 0.003 g/cm3, respectively. - Use a nitrogen pycnometer43 with a 10-cm3 cup to obtain the density of fiber.
NOTE: The density of plain weave and random mat fabrics are 2.600 ± 0.003 g/cm3 and 2.470 ± 0.004 g/cm3, respectively.
- Use the suspension method42 to determine the density of bulk composite specimen.
- Calculate the weight fraction of the fiber and resin according to ASTM D2584-1141.
- Calculate the void and fiber volume fraction following ASTM D3171-15 procedures44
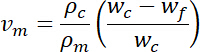 (1)
(1)
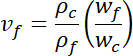 (2)
(2)
 (3)
(3)
where is the resin volume fraction,
  is the fiber volume fraction,
  is the void volume fraction,
  is the density of composite,
  is the density of resin,
  is the density of fiber,
  is the sample weight, and
  is the fiber weight.
NOTE: The uncertainty for the void volume content is calculated to be ±0.21%45. This level of accuracy is sufficient for the composite laminates, even when the laminate has a low-void content of less than 1%.
6. Scanning Electron Microscopy (SEM) Imaging
- Cut two 25.4 mm × 6.4 mm specimens from each laminate and embed them in a rapid-cure acrylic for SEM imaging.
NOTE: The specimens are embedded such that the side surface (through-the-thickness surface) of the laminate along the 25.4 mm sample length is exposed for imaging. - Use a polishing machine to polish the surface of embedded composite samples with grit sizes ranging from 30 to 0.04 µm.
- Sputter coat approximately 5 nm of gold/palladium onto the prepared specimen to provide a conductive layer.
- Mount the specimen onto a sample holder and put it into the chamber of the SEM.
- Set the SEM imaging parameters such as acceleration voltage to 20 kV and the working distance to 25.5 mm.
- Capture multiple images of the laminate at 35X or higher magnification at various locations.
NOTE: The selected magnification allows the assessment of voids over a large cross-sectional area as well as a visual comparison of the laminate thickness. Accurate measurements of the laminate thickness can be made using these images.
7. Characterization of Flexural Properties
- Cut a set of seven 12.7 mm wide specimens from each composite laminate for three-point bending flexural tests according to ASTM D790-1546 using a diamond-grit saw.
- Measure the width and thickness of each specimen with a caliper.
- Use a span to thickness ratio of 24:1 and adjust the support span of the three-point bending test fixture. Place the specimen on the three-point bending flexural test fixture assembled at the mechanical testing instrument.
- Perform the flexural test at the crosshead speed of 2 mm/min and record the load-deflection behavior of the specimen.
- Repeat the above steps for all specimens to confirm and ensure repeatability of results.
- Once the experiment is finished, calculate the flexural strength as well as flexural modulus of the specimens39,40.
Results
To investigate the effect of MACM on the quality of the laminates, several scenarios that use different fabric types and resin systems were considered. Table 1 reports the manufacturing process and composite constituents of 6-ply, E-glass/epoxy composite laminates manufactured under six different fabrication scenarios. In the baseline scenarios (W-PW-INF, W-RM-INF, and W-RM-EPON), the laminates are fabricated by wet lay-up vacuum bag without external pressure. The other three scenarios (WM-PW-INF, WM-RM-INF, and WM-RM-EPON) are used to fabricate wet lay-up vacuum bag laminates under magnetic compaction pressure. The quality of these laminates is then compared to those made by the baseline scenarios. In the first and second scenarios, W-PW-INF and WM-PW-INF, plain weave E-glass/INF laminates are fabricated. In the third and fourth scenarios, W-RM-INF and WM-RM-INF, the plain weave fabric is replaced with random mat, and the same resin system (i.e., INF) is used. In the fifth and sixth scenarios, W-RM-EPON and WM-RM-EPON, the fabric is random mat E-glass, while the resin system is replaced with EPON which has a moderately higher viscosity of 766.9 mPa s compared to 296 mPa s for INF resin. A more detailed analysis of the last four scenarios can be found in Pishvar et al. 2017 and Amirkhosravi et al. 201738,39.
Figure 2a presents the magnetic pressure generated by NdFeB, N52-2.54 × 2.54 × 1.27 cm3 magnet as a function of the distance between the magnet and steel plate. This distance would correspond to the lay-up thickness during fabrication of the composite laminate, and thus can be used to determine the variation of the compaction pressure applied by the magnets. The inset in Figure 2a shows a photograph of the experimental set-up used for measuring the variation of the magnetic pressure as a function of distance. As explained in section 3 of the protocol, the set-up consists of two parallel steel plates (12.5 cm × 12.5 cm × 1.8 cm). The top plate is connected to a 4.45 kN (1000 lb) load-cell. The bottom plate is assembled on the cross-head of a mechanical testing instrument. By using this set-up, the attraction force of the permanent magnet placed on the bottom plate is measured as a function of the gap (i.e., the distance between the magnet and the top steel plate). The dashed line in Figure 2a represents the measured magnetic pressure (force over the area of the magnet) by the mechanical testing instrument, and the solid line represents the pressure determined from the data provided by the supplier of the magnets. There is generally good agreement between the measured pressure and the values obtained from the technical data sheet provided by the supplier. It is seen that the increase in magnetic pressure depends exponentially on the reduction of the gap. Therefore, as the laminate consolidates during the curing process, the thickness of the lay-up gradually decreases, and consequently, the pressure applied by the magnet increases. Figure 2b shows the same experimental data presented in Figure 2a but for the gap (i.e., lay-up thickness) range of 1-4.5 mm. In addition, the initial and final magnetic pressure applied during the cure of the laminates comprised of different fabric types (i.e., plain weave and random mat) and resin systems (i.e., INF and EPON) are displayed in Figure 2b. The lay-up thickness of plain weave/INF laminates (WM-PW-INF) during consolidation decreases from 1.5 mm to 1.4 mm due to resin outflow and cure. Accordingly, the magnetic pressure slightly increases from 0.38 to 0.39 MPa. The lay-up thickness of random mat/INF laminates (WM-RM-INF) changes from 2.8 mm to 1.7 mm, and, as a result, the magnetic pressure significantly increases from 0.27 to 0.36 MPa. The lay-up thickness of the laminates made with random mat/EPON (WM-RM-EPON) decreases from 3.7 mm to 2.5 mm, and thus, the generated pressure moderately rises from 0.22 to 0.29 MPa.
Table 2 presents the average thickness, fiber volume fraction, and void volume fraction of the laminates manufactured with and without magnetic consolidation pressure. As shown in Table 2, utilizing magnetic compaction pressure substantially reduces the average thickness of the laminates by 12-47%. As expected, the reduction in the laminate thickness is strongly correlated with the increase in the fiber volume fraction of the laminates, where the fiber volume fraction of the laminates significantly improves by 13-98% due to magnetic pressure. Among all scenarios, the effect of applying magnetic pressure on random mat/INF laminates is more pronounced (i.e., 98% increase in fiber volume fraction) because of two factors: (1) a significantly lower initial fiber volume fraction of uncompacted random mat laminates compared to plain weave laminates, and (2) the use of resin with a low viscosity of 296 mPa s, thereby allowing easier removal of excess resin. It is also notable that applying magnetic pressure has an additional advantage in decreasing the void volume fraction of laminates from 3.4-5.8% to 1.5-2.7%. Thus, the magnetic pressure drives not only the excess resin but also the voids out of the laminate.
Figure 3 displays the SEM images of E-glass/epoxy laminates manufactured under 6 different scenarios at 35X magnification. For easy visual comparison, the images of the laminates made without an external pressure are shown on the left and the laminates made under magnetic compaction are presented on the right. From these images, it is evident that utilizing the magnetic compaction pressure results in much-improved consolidation between the plies and, consequently, leads to a significant reduction in the resin-rich areas. As a result, the laminate thickness is remarkably reduced and the fiber volume fraction is increased, especially in the laminates made from random mat fabric and INF resin (WM-RM-INF). These images also show that the morphology of the voids is quite different in the laminates made with and without external pressure. Applying magnetic pressure reduces the number of voids and makes the voids smaller, leading to a lower void volume fraction in the laminates. Finally, compacting the voids that are located between the plies leads to more elongated voids.
Table 3 shows the flexural strength and modulus of all laminates and the percentage increase in flexural properties of the laminates made under magnetic consolidation pressure. The results clearly show that the flexural strength and modulus of laminates are significantly improved by utilizing the magnetic pressure. An increase of 98% in the fiber volume fraction of the random mat/INF laminates (WM-RM-INF), while having a minimum void content of 1.46%, causes a 62% and 67% increase in the flexural strength and modulus of the laminates, respectively. As expected, the plain weave/INF laminates (WM-PW-INF) which initially exhibited the lowest improvement of 13% in fiber volume fraction, showed the lowest increase, 7% and 22%, in flexural strength and modulus, respectively. Consequently, the enhancement in flexural properties of a variety of composite laminates made under magnetic consolidation pressure proves the capability of the MACM to improve the overall laminate quality.
| Fabrication scenario | Fabric type | Resin system | Manufacturing process |
| W-PW-INF | Plain weave E-glass | INF | Conventional wet lay-up vacuum bag without using external pressure |
| WM-PW-INF | Plain weave E-glass | INF | Wet lay-up vacuum bag with using magnetic consolidation pressure |
| W-RM-INF | Random mat E-glass | INF | Conventional wet lay-up vacuum bag without using external pressure |
| WM-RM-INF | Random mat E-glass | INF | Wet lay-up vacuum bag with using magnetic consolidation pressure |
| W-RM-EPON | Random mat E-glass | EPON | Conventional wet lay-up vacuum bag without using external pressure |
| WM-RM-EPON | Random mat E-glass | EPON | Wet lay-up vacuum bag with using magnetic consolidation pressure |
Table 1: Details of the constituents and six fabrication scenarios used in the manufacturing of 6-ply composite laminates.
| Fabrication scenario | Average thickness (mm) | Fiber volume fraction (%) | Increase in fiber volume fraction (%) | Void volume fraction (%) | Reduction in void volume fraction (%) |
| W-PW-INF | 0.98 ± 0.01 | 45.65 ± 0.82 | ― | 3.44 ± 0.46 | ― |
| WM-PW-INF | 0.86 ± 0.01 | 51.63 ± 0.87 | 13 | 1.74 ± 0.39 | 49 |
| W-RM-INF29 | 2.28 ± 0.04 | 24.84 ± 1.14 | ― | 5.09 ± 0.69 | ― |
| WM-RM-INF29 | 1.21 ± 0.01 | 49.10 ± 0.87 | 98 | 1.46 ± 0.24 | 71 |
| W-RM-EPON30 | 3.18 ± 0.01 | 17.34 ± 0.84 | ― | 5.81 ± 1.24 | ― |
| WM-RM-EPON30 | 1.99 ± 0.03 | 26.88 ± 1.99 | 55 | 2.71 ± 0.36 | 53 |
Table 2: Average thickness, fiber volume fraction, and void volume fraction of the 6-ply laminates manufactured under six different scenarios. The percentage increase in fiber volume fraction and percentage reduction in void volume fraction due to magnetic compaction (n = 6 for fiber volume fraction and void volume fraction and n = 35 for average laminate thickness; 95% confidence intervals for all data) are also given.
| Fabrication scenario | Flexural strength (MPa) | Increase in flexural strength (%) | Flexural modulus (GPa) | Increase in flexural modulus (%) |
| W-PW-INF | 638.9 ± 27.0 | ― | 24.1 ± 0.5 | ― |
| WM-PW-INF | 681.1 ± 35.5 | 7 | 29.5 ± 0.9 | 22 |
| W-RM-INF29 | 218.9 ± 11.4 | ― | 8.4 ± 0.3 | ― |
| WM-RM-INF29 | 354.6 ±15.5 | 62 | 14.0 ± 0.8 | 67 |
| W-RM-EPON30 | 158.1 ± 8.9 | ― | 6.8 ± 0.1 | ― |
| WM-RM-EPON30 | 253.5 ± 20.1 | 60 | 9.9 ± 0.6 | 46 |
Table 3: Flexural strength and modulus of the composite laminates and the percentage increase in flexural properties due to magnetic compaction (n = 7 for the laminates made by EPON and n = 14 for the rest; 95% confidence intervals for all data).
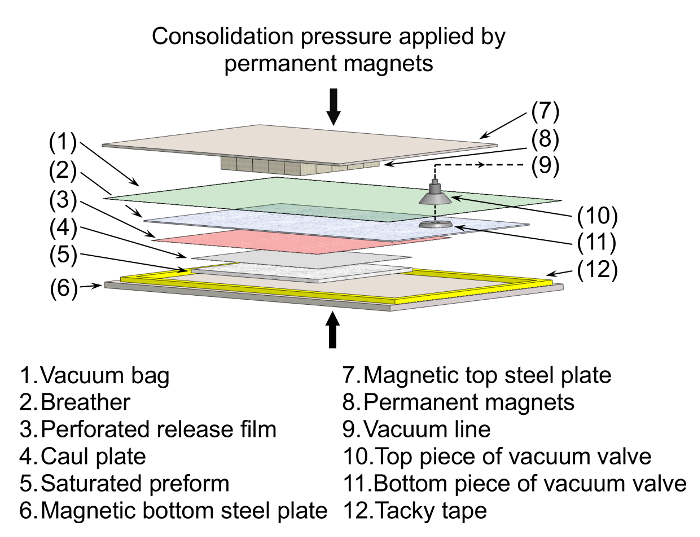
Figure 1: A simplified schematic of the preparation of composite lay-up and application of magnetic pressure, as described in the Protocol section. For this purpose, twenty-five NdFeB, N52-2.54 × 2.54 × 1.27 cm3 permanent magnets are utilized to apply consolidation pressure on the composite lay-up. Please click here to view a larger version of this figure.
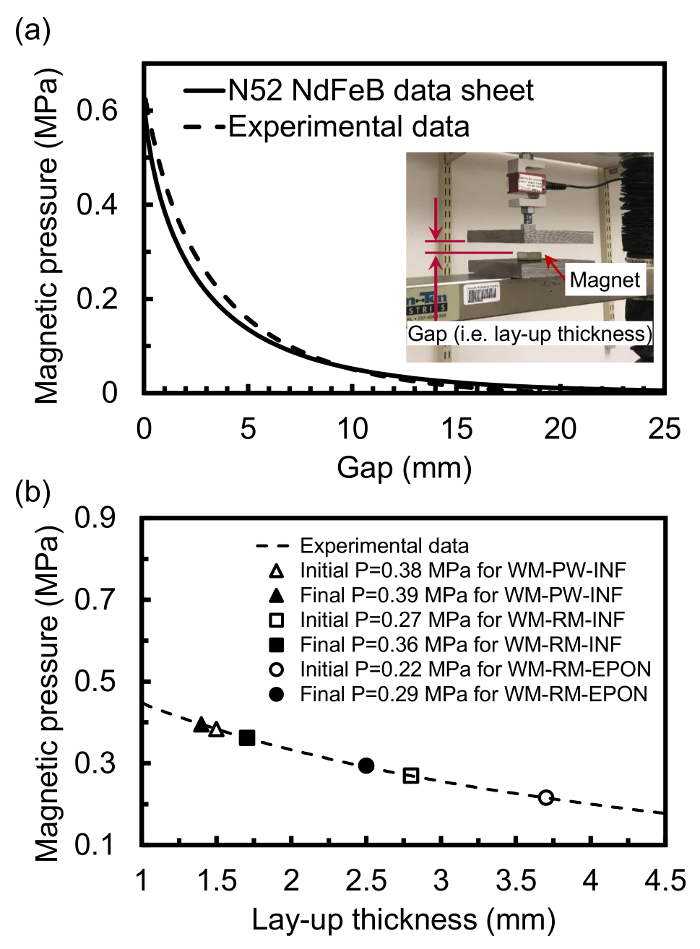
Figure 2: (a) Variation of magnetic pressure generated by NdFeB, N52-2.54 × 2.54 × 1.27 cm3 magnet as a function of the gap (i.e., lay-up thickness). The inset shows a photograph of the experimental set-up used for measuring the magnetic pressure. (b) The initial and final magnetic pressure applied during the curing of plain weave/INF (WM-PW-INF), random mat/INF(WM-RM-INF), and random mat/EPON (WM-RM-EPON) laminates. Please click here to view a larger version of this figure.
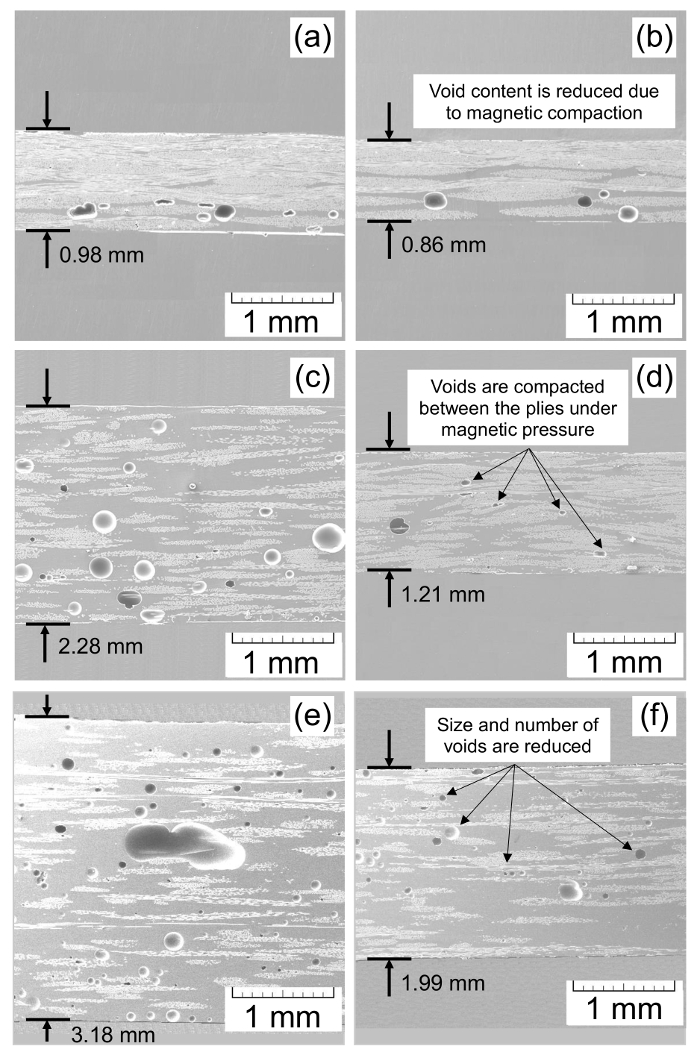
Figure 3: SEM images of the 6-ply E-glass/epoxy composite laminates fabricated using a wet lay-up vacuum bag process with and without using magnetic pressure. (a) W-PW-INF (plain weave/INF laminate, without external pressure), (b) WM-PW-INF (plain weave/INF laminate, with magnetic pressure), (c) W-RM-INF (random mat/INF laminate, without external pressure), (d) WM-RM-INF (random mat/INF laminate, with magnetic pressure), (e) W-RM-EPON (random mat/EPON laminate, without external pressure), and (f) WM-RM-EPON (random mat/EPON laminate, with magnetic pressure). Please click here to view a larger version of this figure.
Discussion
The application of a high consolidation pressure during the cure of a composite laminate is particularly important for manufacturing a high-quality composite part47. If the external pressure is not applied and the laminate is cured only under vacuum, the final part will generally contain high void content, possibly exceeding 5% by volume, and undesirable resin rich regions48. High void content, low fiber volume fraction, and resin rich areas are factors adversely affecting the mechanical properties of composite laminates. In this work, an experimental protocol for applying high consolidation pressure during cure of a laminate in the wet lay-up vacuum bag process is described29. In this technique, first, the composite lay-up is prepared on a magnetic bottom tool plate according to the conventional wet lay-up vacuum bag process. Then, a set of permanent magnets, attached to a magnetic top steel plate, is placed on the vacuum bag. In this study, magnets are applied while increasing the lay-up temperature to 60 °C, where the resin viscosity decreases significantly. Applying pressure at a different time, such as the gelation point, may yield laminates with different properties13,40,49. The level of applied magnetic pressure depends on the gap between the magnets and magnetic bottom plate. Thus, we present a procedure to measure magnetic pressure generated by a magnet as a function of the gap (i.e., lay-up thickness).
To determine the effectiveness of MACM, wet lay-up vacuum bag laminates with different material constituents are fabricated by using six scenarios with and without magnetic compaction pressure. Then, we demonstrate the detailed steps for characterization of void and fiber volume fractions, microstructure, and flexural properties of composite laminates. To evaluate volume fractions of the composite constituents, the resin-burn off and suspension methods are utilized42. The presented results show that using magnetic compaction pressure significantly increases the fiber volume fraction and decreases the void content of the parts. In addition, for microstructural analysis of composite, scanning electron microscopy (SEM) imaging is used, and gives insight into the location and geometrical features of voids15. For example, Figure 3 shows that the use of magnetic pressure during cure is also beneficial in reducing both the size and number of voids, and hence decreases the probability of premature failure20,24. Consequently, these factors greatly improve the flexural properties of laminates. However, the effectiveness of MACM is different depending upon the type of the composite constituents (fiber and resin).
Although fabrication of laminates with this method is simple, care must be taken during arrangement and placement of permanent magnets as they generate a very high pressure (i.e., a maximum pressure of 0.64 MPa). The limitation of this method is that the bottom tool plate needs to be magnetic, such as a 400-series stainless steel, and it must be fixed against movement prior to placement of magnets, because the magnetic attraction force may move and shift the plate upwards. Additionally, the applied pressure by magnets depends on the thickness of the laminate. For example, NdFeB, N52-2.54 × 2.54 × 1.27 cm3 permanent magnets are not able to generate a high consolidation pressure (> 0.1 MPa) when the composite lay-up thickness exceeds 6.5 mm. In this case, stronger magnets need to be utilized to achieve high consolidation levels.
The presented method is convenient to use and has the advantage over autoclaves in that it does not require expensive equipment and tooling. Although not elucidated here, this method is broadly applicable not only to wet lay-up vacuum bag but also to other manufacturing processes for composites, such as out-of-autoclave curing of prepregs and vacuum assisted resin transfer molding (VARTM). Moreover, large composite components can be fabricated with relative ease by sliding the magnets along the vacuum bag if a suitable lubricant is used between the magnets and the vacuum bag. In addition, to the best of our knowledge, this is the only method which allows the application of local as well as non-uniform pressure on the composite lay-up. A future direction of this method is to manufacture geometrically complex composite parts, but instead of placing the magnets on a flat plate, they may be placed on a matched, upper mold.
Disclosures
The authors do not have any disclosures.
Acknowledgements
The authors thank the AME Machine Shop at the University of Oklahoma for helping to make the mold and the fabrication set-up and the members of the Composite Manufacturing Research Laboratory, Drs. Yousef K. Hamidi, M. Akif Yalcinkaya, and Jacob Anderson for helpful discussions.
Materials
| Name | Company | Catalog Number | Comments |
|---|---|---|---|
| Plain weave glass fiber | Hexcel | HexForce 3733 | The type of fibers can be substituted with any type of fabrics |
| Randomly oriented chopped strand glass fiber | Fiberglast | 248 | |
| TenCate EX-1522/IM7 | Tencate | it is a plain weave carbon/epoxy prepreg | |
| PRO-SET INF-114 Infusion Epoxy | Composite Envisions | 1758 | The type of resin can be substituted with any type of resin suitable for wet lay-up vacuum bag process |
| PRO-SET INF-211 Medium Infusion Hardener | Composite Envisions | 1760 | |
| EPON 862 | Hexion Inc. | ||
| EPIKURE Curing Agent 3300 | Hexion Inc. | ||
| NdFeB, N52-2.54 × 2.54 × 1.27 cm3 | K&J Magnetics, Inc. | BX0X08-N52 | Magnets can be substitued with any type depending on the required pressure and application |
| OLFA rotary cutter | Fibre Glast | 1706-A | |
| Tacky tape | De-Comp Composites | D413Y | |
| Polyester tape | De-Comp Composites | D574A | |
| Squeegees | Fibre Glast | 62-A | Any type of squeegees can be used |
| Roller | De-Comp Composites | D205 | Any type of rollers can be used |
| PTFE-Coated fiberglass fabric sheets | McMaster-Carr Supply Company | 8577K81 | |
| PTFE release agent dry lubricant | Miller-Stephenson | MS122AD | |
| Perforated release film | Fibre Glast | 1787-C | |
| Breather cloth | De-Comp Composites | ||
| Vacuum bag film | Rock West Composite | WRIGHTLON 7400 | |
| Aluminum twist lock vacuum valve | De-Comp Composites | D401 | |
| Vacuum pump | Best Value Vacs | BVVRS1 | |
| Flexible silicone-rubber heat sheets, adhesive backing | McMaster-Carr Supply Company | 35765K429 | |
| 400-series steel plate, 6.35 mm-thick | The lay-up is prepared on this plate | ||
| steel plate, 4.76 mm-thick | The magnets are attached to this plate | ||
| Aluminum sheet, 0.3-mm thick | |||
| Lab stirrer mixer | Caframo | ||
| Laboratory weigh scale | |||
| AccuPyc II 1340 automatic gas pycnometer | Micromeritics Instrument Corporation | 134/00000/00 | |
| Specific gravity cup, 83.2 mL | Gardco | EW-38000-12 | |
| Acrylic cold mounting resin | Struers | LevoCit | |
| Grinder/polisher | Struers | LaboSystem | |
| Porcelain crucibles, 30 mL | United Scientific Supplies | JCT030 | |
| Plastic Cups, 12 Oz, clear | It is used as epoxy mixing cups |
References
- Amel, H., et al. Introducing a novel manufacturing process for automotive structural/semi structural composite components. Procedia CIRP. 66, 143-146 (2017).
- Beardmore, P., Johnson, C. F. The potential for composites in structural automotive applications. Compos Sci Technol. 26 (4), 251-281 (1986).
- Irving, P. E., Soutis, C. Polymer composites in the aerospace industry. , Sawston, U.K. (2015).
- Li, Y., Li, N., Gao, J. Tooling design and microwave curing technologies for the manufacturing of fiber-reinforced polymer composites in aerospace applications. Int J Adv Manuf Technol. 70 (1-4), 591-606 (2014).
- Mouritz, A. P., Gellert, E., Burchill, P., Challis, K. Review of advanced composite structures for naval ships and submarines. Compos Struct. 53 (1), 21-42 (2001).
- Davies, P., Petton, D. An experimental study of scale effects in marine composites. Compos Part A: App Sci Manuf. 30 (3), 267-275 (1999).
- Pendhari, S. S., Kant, T., Desai, Y. M. Application of polymer composites in civil construction: A general review. Compos Struct. 84 (2), 114-124 (2008).
- Bakis, C. E., et al. Fiber-reinforced polymer composites for construction-State-of-the-art review. J Compos Construct. 6 (2), 73-87 (2002).
- Thomas, M. M., Joseph, B., Kardos, J. L. Experimental characterization of autoclave-cured glass-epoxy composite laminates: Cure cycle effects upon thickness, void content, and related phenomena. Polym Compos. 18 (3), 283-299 (1997).
- Michaud, V., Mortensen, A. Infiltration processing of fibre reinforced composites: Governing phenomena. Compos Part A: App Sci Manuf. 32 (8), 981-996 (2001).
- Wood, J. R., Bader, M. G. Void control for polymer-matrix composites (2): Experimental evaluation of a diffusion model for the growth and collapse of gas bubbles. Compos Manuf. 5 (2), 149-158 (1994).
- Abraham, D., Matthews, S., McIlhagger, R. A comparison of physical properties of glass fibre epoxy composites produced by wet lay-up with autoclave consolidation and resin transfer moulding. Compos Part A: App Sci Manuf. 29 (7), 795-801 (1998).
- Liu, L., Zhang, B. M., Wang, D. F., Wu, Z. J. Effects of cure cycles on void content and mechanical properties of composite laminates. Compos Struct. 73 (3), 303-309 (2006).
- Park, S. Y., Choi, W. J., Choi, H. S. The effects of void contents on the long-term hygrothermal behaviors of glass/epoxy and GLARE laminates. Compos Struct. 92 (1), 18-24 (2010).
- Hamidi, Y. K., Aktas, L., Altan, M. C. Three-dimensional features of void morphology in resin transfer molded composites. Compos Part A: App Sci Manuf. 65 (7), 1306-1320 (2005).
- Pucci, M. F., Liotier, P. -J., Drapier, S. Capillary wicking in a fibrous reinforcement-orthotropic issues to determine the capillary pressure components. Compos Part A: App Sci Manuf. 77, 133-141 (2015).
- Pucci, M. F., et al. Wetting and swelling property modifications of elementary flax fibres and their effects on the Liquid Composite Molding process. Compos Part A: App Sci Manuf. 97, 31-40 (2017).
- Jeong, H. Effects of voids on the mechanical strength and ultrasonic attenuation of laminated composites. J Compos Mater. 31 (3), 276-292 (1997).
- Almeida, S. F. M., Neto, Z. dS. N. Effect of void content on the strength of composite laminates. Compos Struct. 28 (2), 139-148 (1994).
- Varna, J., Joffe, R., Berglund, L. A., Lundström, T. Effect of voids on failure mechanisms in RTM laminates. Compos Sci Technol. 53 (2), 241-249 (1995).
- Hagstrand, P. O., Bonjour, F., Månson, J. A. The influence of void content on the structural flexural performance of unidirectional glass fibre reinforced polypropylene composites. Compos Part A: App Sci Manuf. 36 (5), 705-714 (2005).
- Mouritz, A. Ultrasonic and interlaminar properties of highly porous composites. J Compos Mater. 34 (3), 218-239 (2000).
- Maragoni, L., Carraro, P., Peron, M., Quaresimin, M. Fatigue behaviour of glass/epoxy laminates in the presence of voids. Int J Fatigue. 95, 18-28 (2017).
- Chambers, A., Earl, J., Squires, C., Suhot, M. The effect of voids on the flexural fatigue performance of unidirectional carbon fibre composites developed for wind turbine applications. Int J Fatigue. 28 (10), 1389-1398 (2006).
- Judd, N. C., Wright, W. Voids and their effects on the mechanical properties of composites- an appraisal. SAMPE J. 14, 10-14 (1978).
- Ghiorse, S. Effect of void content on the mechanical properties of carbon/epoxy laminates. SAMPE Quart. 24 (2), 54-59 (1993).
- Lambert, J., Chambers, A., Sinclair, I., Spearing, S. 3D damage characterisation and the role of voids in the fatigue of wind turbine blade materials. Compos Sci Technol. 72 (2), 337-343 (2012).
- Mesogitis, T., Skordos, A., Long, A. Uncertainty in the manufacturing of fibrous thermosetting composites: a review. Compos Part A: App Sci Manuf. 57, 67-75 (2014).
- Aktas, L., Hamidi, Y., Altan, M. C. Effect of moisture on the mechanical properties of resin transfer molded composites-part I: absorption. J Mater Process Manuf Sci. 10 (4), 239-254 (2002).
- Selzer, R., Friedrich, K. Mechanical properties and failure behaviour of carbon fibre-reinforced polymer composites under the influence of moisture. Compos Part A: App Sci Manuf. 28 (6), 595-604 (1997).
- Costa, M. L., Rezende, M. C., Almeida, S. F. M. Effect of void content on the moisture absorption in polymeric composites. Polym Plast Technol Eng. 45 (6), 691-698 (2006).
- Muric-Nesic, J., Compston, P., Stachurski, Z. On the void reduction mechanisms in vibration assisted consolidation of fibre reinforced polymer composites. Compos Part A: App Sci Manuf. 42 (3), 320-327 (2011).
- Walczyk, D., Kuppers, J. Thermal press curing of advanced thermoset composite laminate parts. Compos Part A: App Sci Manuf. 43 (4), 635-646 (2012).
- Khan, L. A., Mahmood, A. H., Ahmed, S., Day, R. J. Effect of double vacuum bagging (DVB) in quickstep processing on the properties of 977-2A carbon/epoxy composites. Polym Compos. 34 (6), 942-952 (2013).
- Kwak, M., Robinson, P., Bismarck, A., Wise, R. Microwave curing of carbon-epoxy composites: penetration depth and material characterisation. Compos Part A: App Sci Manuf. 75, 18-27 (2015).
- Agius, S., Magniez, K., Fox, B. Cure behaviour and void development within rapidly cured out-of-autoclave composites. Compos Part B: Eng. 47, 230-237 (2013).
- Davies, L., et al. Effect of cure cycle heat transfer rates on the physical and mechanical properties of an epoxy matrix composite. Compos Sci Technol. 67 (9), 1892-1899 (2007).
- Pishvar, M., Amirkhosravi, M., Altan, M. C. Applying magnetic consolidation pressure during cure to improve laminate quality: a comparative analysis of wet lay-up and vacuum assisted resin transfer molding processes. ASME Int Mech Eng Cong Expos Proc. , IMECE2017-72019 (2017).
- Amirkhosravi, M., Pishvar, M., Altan, M. C. Improving laminate quality in wet lay-up/vacuum bag processes by magnet assisted composite manufacturing (MACM). Compos Part A: App Sci Manuf. 98, 227-237 (2017).
- Pishvar, M., Amirkhosravi, M., Altan, M. C. Magnet assisted composite manufacturing: A novel fabrication technique for high-quality composite laminates. Polym Compos. , (2017).
- ASTM D2584-11 Standard test method for ignition loss of cured reinforced resins. , ASTM International. West Conshohocken, PA. (2011).
- Anderson, J. P., Altan, M. C. Properties of composite cylinders fabricated by bladder assisted composite manufacturing. J Eng Mater Technol. 134 (4), 044501(2012).
- Webb, P. A. Volume and density determinations for particle technologists. Micromeritics Instru. Corp. 01, (2001).
- ASTM D3171-15 Standard test methods for constituent content of composite materials. , ASTM International. West Conshohocken, PA. (2015).
- Anderson, J. Manufacturing and microstructural modeling of geometrically complex composite components produced by bladder assisted composite manufacturing (BACM). , Norman, OK. PhD dissertation (2013).
- ASTM D790-15, Standard test methods for flexural properties of unreinforced and reinforced plastics and electrical insulating materials. , ASTM International. West Conshohocken, PA. (2015).
- Yalcinkaya, M. A., Sozer, E. M., Altan, M. C. Fabrication of high quality composite laminates by pressurized and heated-VARTM. Compos Part A: App Sci Manuf. 102, 336-346 (2017).
- Chang, T., Zhan, L., Tan, W., Li, S. Effect of autoclave pressure on interfacial properties at micro-and macro-level in polymer-matrix composite laminates. Fiber Polym. 18 (8), 1614-1622 (2017).
- Stringer, L. G. Optimization of the wet lay-up/vacuum bag process for the fabrication of carbon fibre epoxy composites with high fibre fraction and low void content. Composites. 20 (5), 441-452 (1989).
Reprints and Permissions
