We present a protocol for non-targeted analysis using time of flight mass spectrometry as a perfect tool to identify pharmaceuticals in waters. We demonstrate the application of UV irradiation for their elimination. Analysis involving irradiation, compound isolation, identification and kinetic modelling of the degradation profiles is illustrated.
Method Article
Identification of Pharmaceuticals in The Aquatic Environment Using HPLC-ESI-Q-TOF-MS and Elimination of Erythromycin Through Photo-Induced Degradation
In This Article
Summary
Abstract
Monitoring pharmaceuticals throughout the water cycle is becoming increasingly important for the aquatic environment and eventually for human health. Targeted and non-targeted analysis are today's means of choice. Although targeted analysis usually conducted with the help of a triple quadrupole mass spectrometer may be more sensitive, only compounds previously selected can be identified. The most powerful non-targeted analysis is performed through time of flight mass spectrometers (TOF-MS) extended by a quadrupole mass analyzer (Q), as used in this study. Preceded by solid phase extraction and high-performance liquid chromatography (HPLC), the non-targeted approach allows to detect all ionizable substances with high sensitivity and selectivity. Taking full advantage of the Q-TOF-MS instrument, tandem mass spectrometry (MS/MS) experiments accelerate and facilitate the identification while a targeted MS method enhances the sensitivity but relies on reference standards for identification purposes. The identification of four pharmaceuticals from Rhine river water is demonstrated. The Rhine river originates in Tomasee, Graubünden, Switzerland and flows into the North Sea, near Southern Bight, The Netherlands. Its length amounts to 1232.7 km. Since it is of prime interest to effectively eliminate pharmaceuticals from the water cycle, the effect UV-C irradiation is demonstrated on a laboratory scale. This method allows fast degradation of pharmaceuticals, which is exemplarily shown for the macrolide antibiotic erythromycin. Using the above HPLC-Q-TOF-MS method, concentration-time diagrams are obtained for the parent drug and their photodegradation products. After establishing the equations for first-order sequential reactions, computational fitting allows the determination of kinetic parameters, which might help to predict irradiation times and conditions when potentially considered as fourth stage within wastewater treatment.
Introduction
Pharmaceuticals are regularly found in the aquatic environment1,2,3,4,5. An important source are effluents from wastewater treatment plants (WWTP)6,7,8,9. The occurrence of pharmaceuticals in the throughout the water cycle has been studied exemplarily in the Turia River Basin10. Among others, antibiotics represent a particular hazardous class of drugs, since they often pass the biological stage of WWTPs unaltered and may cause bacterial resistances in the environment11,12,13. Macrolides constitute a class of antibiotic drugs that are applied both in human and in veterinary medicine. Their representatives were found in concentration up to 1 µg/L in effluents14,15,16,17,18,19. One of them is erythromycin (Ery)20,21. In waters, erythromycin is often accompanied by anhydroerythromycin A (Ery A - H2O), a dehydrate22,23. Water elimination from erythromycin is due to acid instability. The ratio of erythromycin vs. anhydroerythromycin depends on the pH24,25,26,27.
Chemically, macrolides contain a macrocylic lactone to which various sugar moieties are attached, e.g., desosamine, cladinose or mycaminose. Since macrolides are chemically modified natural products from fermentation processes, they often exist as mixtures. The species termed A, B, C, etc., differ in the sugar substituents. The sugar moieties and their position at the lactone are responsible for the mode of action of macrolides28,29. In order to minimize environmental hazard, it is desirable to completely mineralize the pharmaceuticals before entering the aquatic environment27,30,31,32.
The first part of this study deals with the detection of pharmaceutical in surface waters, which is important for monitoring both effluents and open waters. To search for a variety of unidentified substances in the microgram range in different matrices, non-targeted analysis is the method of choice20,33,34,35. In particular, high-performance liquid chromatography (HPLC) electrospray ionization quadrupole time of flight mass spectrometry (HPLC-ESI-Q-TOF-MS) has been proved of extraordinary value due to its specificity and sensitivity. After the identification of the substance, sensitivity can further be extended by using the targeted MS approach with the quadrupole operated in select mode and the collision energy within the collision cell set to zero. Hence, ions arrive non-fragmented at the TOF detector.
The second focus of this work is the elimination of erythromycin. For the elimination of the pharmaceuticals, so-called advanced oxidation processes (AOPs) are used, e.g., started by irradiation with UV light36,37,38. Essential for the degradation is the formation of hydroxyl radicals from water by VUV / UVC irradiation following eq. 1.
H2O + hν(<200 nm) → H2O* → H. + .OH (1)
Hydroxyl radicals possess a high oxidation potential of 2.8 V, which positively contributes to the degradation of the substances36,37.
Here, the degradation of erythromycin using vacuum UV/UVC-irradiation in water is described taking the influences of the pH into account. The formation of even more hazardous products is believed to be a disadvantage of using AOPs39,40. Thus, it is important to irradiate until complete mineralization of the pharmaceuticals. To better estimate the irradiation time, the kinetic model of the reaction, the reaction rate constants and the half-lives are determined both for the initial drug and for its photodegradates. To this purpose, concentration-time (c-t) plot were derived from HPLC-ESI-Q-TOF-MS measurements and compared to chemical kinetics models using MATLAB. The kinetics of the degradation proceeded according to first-order, and the photodegradates were described as intermediate products of a consecutive or subsequent follow-up reaction27,41.
Protocol
1. Sample Preparation: Solid Phase Extraction
- Collect about 1 L of water for the preparation of the samples.
- Filter the sample over a blue band filter with a pore size of 2 µm to remove coarse particles.
- Equilibrate the SPE cartridge using 3 mL of methanol and 3 mL of ultrapure water.
- Apply the filtrate (1 L) onto the SPE cartridge and increase the flow velocity using a moderate vacuum, e.g., a diaphragm pump.
NOTE: Several SPE cartridges may be run in parallel. - Wash the sample with 3 mL of ultrapure water.
- Elute the analytes from the cartridge sorbate with 3 mL of methanol.
- Concentrate the 3 mL eluate to dry using a rotary evaporator.
- Dissolve the residue in 1 mL of ultrapure water.
- Filter the solution through a syringe filter and store them in a vial for the non-targeted analysis by HPLC-ESI-Q-TOF-MS.
2. HPLC-ESI-Q-TOF-MS Method for Non-Targeted and Targeted Analysis, and MS/MS
- Transfer the vial to the HPLC-ESI-Q-TOF-MS autosampler.
- Set all relevant parameters (Table 1) for the HPLC-ESI-Q-TOF-MS.
NOTE: If a finite collision energy is used, i.e., collision energy (CE) ≠ 0, ions will be fragmented. This mode corresponds to the targeted MS/MS method. - Start the measurement.
- Analyze the resulting chromatograms and mass spectra.
3. UV Irradiation Experiments
- Dissolve the antibiotic compound, e.g., erythromycin (750 mg/L), in ultrapure water at 20 mg/L final concentration.
- Fill the 1 L photoreactor, wrapped in aluminum foil, with 750 mL of the solution.
- Introduce the lamp providing 15 W of power into the reactor.
- Apply the magnetic stirrer at 500 rpm.
- Adjust the pH value to the desired value 3-4, 6-7 or 8-9 by dropwise addition of HCl (0.1 M) or NH3 (0.1 M) if necessary. pH 6-7 is used as an example.
- Take 2 mL of the reaction solution as sample at time 0 using a syringe and transfer it into a 2 mL glass vial.
- Switch on the UV lamp and keep track of the elapsing time.
NOTE: Irradiation times of 10 min are often sufficient. If completeness of the photoreaction is desired, a second experiment series might need to be recorded using the results of the first series.
Caution: UV irradiation may lead to blindness. - Draw a 2 mL sample from the solution every 30 s during the first 5 min. Then, take a sample every 60 s until the end of the experiment. Transfer the samples into 2 mL vials.
- Store the vials until HPLC-ESI-Q-TOF-MS analysis at -4 °C.
- Analyze the 16 samples using HPLC-ESI-Q-TOF-MS with the methods described in step 2.
4. Kinetics Analysis
- Prepare a suitable software such as the curve-fitting toolbox of MATLAB R2016b.
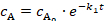
- Fit the mass-area vs. time data of the photo-induced degradation of the parent antibiotic compound according to first order kinetics, see eq. 242,43
 (2)
(2)
The concentration refers to the initial concentration of the educt A, cA to the actual concentration over the reaction time t with the rate constant k1 from the first reaction step A to B.
 - Fit the mass-area vs. time curves of the degradates using eq. 3 and 4, as they can be described as intermediates of a consecutive or subsequent follow-up reaction, i.e., product B or C according to the reaction model A →B → C → D.
 (3)
(3)
 (4)
(4)
The concentrations cB and cC refer to the intermediates B and C; and k2,k3 to the corresponding rate constants B to C, C to D. - Use eq. 5 to fit the data, if the irradiation time was not sufficient to observe the degradation of a photo-product. This degradate can be treated as final product D with the concentration CD to obtain rate constants.
 (5)
(5)
- Calculate the concentration of B using eq. 6 instead of eq. 3, if the reaction ends with B. If C is the final product, calculate the concentration of C according to eq. 7 instead of eq. 4.
 (6)
(6)
 (7)
(7)
- Calculate the concentration of B using eq. 6 instead of eq. 3, if the reaction ends with B. If C is the final product, calculate the concentration of C according to eq. 7 instead of eq. 4.
- Use eq. 8 for the determination of the half-lives t1/2.
 (8)
(8)
Results
As result of the solid phase extraction, a yellowish to dark green solution was obtained in all cases, which indicated the presence of chlorophyll-containing substances (Figure 1). Pharmaceuticals contained in this water sample would not lead to visible coloration since their concentration and their absorbance would generally be too low. Instead, the occurrence of pharmaceuticals needs to be analyzed using HPLC and high-resolution mass spectrometry.
In non-targeted analysis, a HPLC-ESI-Q-TOF-MS was used because of its outstanding mass accuracy allowing to obtain the accurate mass for each compound ion. The mass-detected chromatogram of the performed analysis was represented as a base peak chromatogram (BPC), which displays the most intense peak of each mass spectrum recorded in the course the chromatographic separation. The example shown in Figure 2 presents the BPC of a water sample from the river Rhine.
The BPC contained more than twenty-five peaks reflecting different m/z values, hence different compounds, seven of which were marked in the BPC. Since the substances were unknown a priori, the first step to their identification usually consists of deriving the molecular formula. This is accomplished through accurate mass and isotopic pattern provided by the TOF detection, although the isotopic pattern may not be observed in all cases due to low sample concentrations in environmental samples. With the help of public database, such as Pharmaceuticals in the Environment by the German Environment Agency (UBA) containing approximately 630 compounds, a preliminary identification of a small group of candidates is often successful. For a final proof, either comparison to commercially available reference standards may be performed or MS/MS fragmentation patterns may be considered (Figure 3).
In this work, comparison to standards with respect to retention time accounted for the identification of pharmaceuticals very often found in German surface waters. These substances include metoprolol, a β-blocker, carbamazepine, an analgesic, and the macrolide antibiotic erythromycin A and its derivate anhydroerythromycin A. Erythromycin serves as example further investigated in this study. The studied Rhine river sample had a pH of 7.6 and an average temperature of 16.5 °C. At this pH, anhydroerythromycin would also be expected to be present in the water sample. For the detailed analysis, the extracted ion chromatograms (EICs) of the water sample were compared with the reference standards (Figure 4).
The comparison shows good agreement between the retention time for metoprolol, carbamazepine and anhydroerythromycin and the observed analytes. The EIC of the reference standard anhydroerythromycin displayed two peaks, hence two compounds where dehydration had occurred at two distinct sites of erythromycin. Yet, only one anhydroerythromycin isomer was identified in the Rhine river sample. Erythromycin itself was only present in traces. Therefore, no MS/MS spectrum could be obtained. The accurate masses for the antibiotic and its dehydrate are given in Table 2. Using EIC, thus m/z value and retention time, metoprolol, carbamazepin, erythromycin and anhydroerythromycin could be identified in the Rhine river sample.
With respect to the aquatic environment, it is important to prevent pharmaceuticals from passing through wastewater treatment plants and entering surface waters. In the quest for an efficient elimination, UV-C irradiation experiments at different pH values were carried out for erythromycin as example. Concentration-time (c-t) diagrams were recorded using mass-area vs. time plots derived from EICs. The degradation was described according to equation 2. Erythromycin consists of erythromycin A and B and anhydroerythromycin A, with two isomers of the latter. The c-t curves of erythromycin A and their computational fits are shown in Figure 5. At pH 7,accelerated degradation was observed. This applies to all four compounds studied, data not shown. As a consequence, photo-induced degradation of erythromycin should be carried out around neutral pH. In the case of the Rhine river sample, pH adjustment was not required.
Photodegradates of the pharmaceuticals were also identified at all three pH values. An overview of these photodegradates with their corresponding structure proposals is given in Table 3. For the kinetic analysis of the photodegradates, the product with m/z = 720 serves as an example. Photodegradates can often be described as reaction intermediates. Therefore, the photodegradates were described in terms of aconsecutive and subsequent follow-up reaction. The decision between the resulting types of intermediates is based on the goodness of the fit computed with suitable software, where the coefficient of determination (R2) and the residual mean-squared error (RMSE) were taken as the criteria. Due to the fact that erythromycin is acid-instable, degradates as would occur upon irradiation were present prior to irradiation. The resulting effect on equations 3 and 4 was a finite starting concentration. Hence, a factor was added to the equations. Figure 6 shows experimental data and fits computed according to equation 3 and 4.
This example of an intermediate demonstrated the concentration increase with a sigmoidal rise followed by an exponential decay. This is indicative for a subsequent follow-up reaction intermediate. A consecutive reaction intermediate does not show the sigmoidal increase. Statistical quality parameters also indicated the slightly superior agreement of fit according to the subsequent follow-up reaction model. The coefficient of determination R2 of the consecutive reaction was 0.9898 and thus lower than that of the subsequent follow-up reaction being 0.9976. Therefore, the examined photoproduct was interpreted as intermediate of a subsequent follow-up reaction. The k-values resulted from the computational fit as well, the half-life was calculated following equation 5. All relevant kinetic parameters are collected in Table 3.
The fastest degradation was observed at pH 7, followed by pH 9, while the slowest degradation was found for pH 3 (Figure 5). This finding also applied to the formation and degradation of the photoproducts. Three photodegradates were observed. Their m/z values were 750.46 corresponding to Ery F, 720.45 to Ery C and 192.12 to DPEry192, a glycosidically bound sugar of the erythromycin structure (Figure 7). No degradation of the photoproduct could be observed for DPEry192 at pH 3 and 9 and for Ery F at pH 9. In these cases, the irradiation time was not sufficient long to observe total degradation of the intermediate product. Nevertheless, the formation rate constant could be determined by using equation 5, which corresponds to a final product.
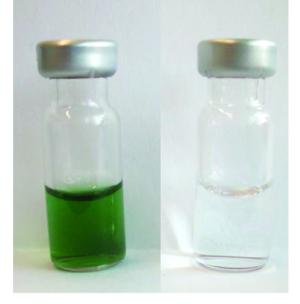
Figure 1. Comparison of the samples from the Rhine river after SPE (left) and ultrapure water(right) treatment. The green coloration is indicative for chlorophyll-containing substances. Please click here to view a larger version of this figure.
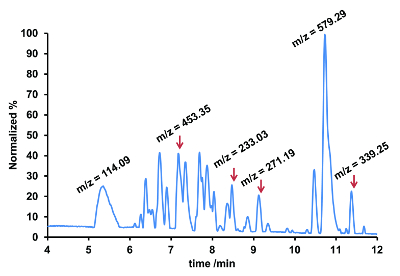
Figure 2. BPC of a water sample after SPE measured with HPLC-ESI-Q-TOF-MS. All chromatograms were normalized to the highest peak. Illustrative m/z-values as obtained from the corresponding MS spectrum are marked. Please click here to view a larger version of this figure.

Figure 3. Q-TOF-MS spectrum of erythromycin A (bottom) and the MS/MS spectrum of the ion m/z = 734.4689 (top). The spectra show the quasi-molecular ion of erythromycin A with its isotopic pattern and the fragments at an applied collision energy of 30 eV. Please click here to view a larger version of this figure.

Figure 4. Normalized EICs of (A) metoprolol, (B) carbamazepine, (C) erythromycin A and (D) anhydroerythromycin A in a Rhine river sample (blue) and in ultrapure water from reference compounds (red). The retention times of the reference compounds and the ones of the pharmaceuticals in the water sample are the same. The signal-to-noise ratios of metoprolol (A) and anhydroerythromycin (D) are higher than those of carbamazepine (B) and erythromycin (C), which indicates the latter were present only in traces. Please click here to view a larger version of this figure.
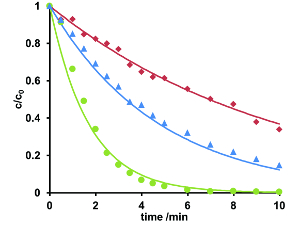
Figure 5. Normalized concentration-time curves of the photodegradation of erythromycin A at pH 3 (red), pH 7 (green) and pH 9 (blue). Solutions were irradiated for 10 min. At pH 7, erythromycin was completely removed from the sample. The concentration-time curves could be described using first-order kinetic equations. The kinetic rate constants were 0.10 (pH 3), 0.59 (pH 7) and =0.21 (pH 9). Please click here to view a larger version of this figure.
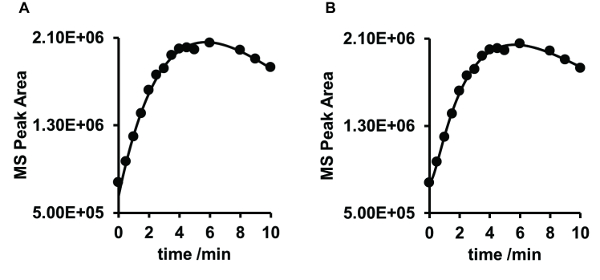
Figure 6. Comparison of the fits of the concentration-time curves of the photoprodegradates of erythromycin with m/z = 720 at pH 9 following equations 3 (A) and 4 (B). Goodness of the fit of the consecutive reaction (A): R2 = 0.9898, RMSE = 4.645E+04, and of the subsequent follow-up reaction (B): R2 = 09976, RMSE = 2.366E+04. Please click here to view a larger version of this figure.
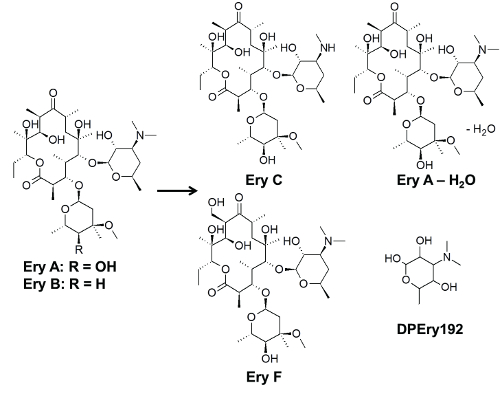
Figure 7. Structure of erythromycin A, erythromycin B and anhydroerythromycin and their photdegradation products. This figure has been modified from Voigt et al.27. The products were formed after 10 min of UVC-irradiation and identified using HPLC-Q-TOF-MS and MS/MS. Please click here to view a larger version of this figure.
| Liquid Chromatography | ||||||
| Column: | reversed-phase C-18 | |||||
| Column: | CoreShell column; | |||||
| Column: | 50 mm x 2.1 mm dimensions, 2.6 μm particle size | |||||
| Column temperature | 40 °C | |||||
| Injection volume: | 5 µL | |||||
| Flow: | 0.3 mL/min | |||||
| Mobile phase: | Solvent A: water containing 0.1% formic acid | |||||
| Solvent B: methanol containing 0.1% formic acid | ||||||
| Gradient program: | ||||||
| Time /min | 0 | 1 | 10 | 11.1 | 11.2 | 12 |
| A:B solvent ratio | 99:1 | 70:30 | 25:75 | 1:99 | 1:99 | 99:1 |
| Mass Spectrometry | ||||||
| Source: | Dual AJS ESI (positive mode) | |||||
| Gas and source | ||||||
| Gas Temperature: | 300 °C | |||||
| Drying Gas: | 8.0 L/min | |||||
| Nebulizer: | 14 psig | |||||
| Sheath Gas Temperature: | 300 °C | |||||
| Sheath Gas Flow: | 8 L/min | |||||
| Mass Range: | 100 - 1000 m/z | |||||
| Acquisition Rate: | 1 spectrum/s | |||||
| Acquisition Time: | 1000 ms/spectrum | |||||
| Transient/ spectrum | 10014 | |||||
| For targeted MS method | ||||||
| Collision energy (CE): | 0 eV | |||||
| Preferred Mass - Table | 734.4685 | |||||
| For MS/MS (typically auto MS/MS mode) | ||||||
| Collision energy (CE): | 30 eV | |||||
| Absolute threshold | 3000 counts | |||||
| Relative threshold | 0.01 % | |||||
| Mass Range: | 100 - 100 m/z | |||||
| Acquisition Rate: | 1 spectrum/s | |||||
| Acquisition Time: | 1000 ms/spectrum | |||||
| Transient/ spectrum | 9964 | |||||
| For targeted MS/MS method | ||||||
| Preferred Mass - Table | 734.4685 | |||||
Table 1. Conditions and parameters used for HPLC-ESI-Q-TOF-MS analysis of pharmaceuticals in water matrices. It is advisable to introduce a rinsing step between the chromatographic runs through running a sample of pure ultrapure water between two analyses or through extending the run time of the chromatographic method in order to elute all substances.
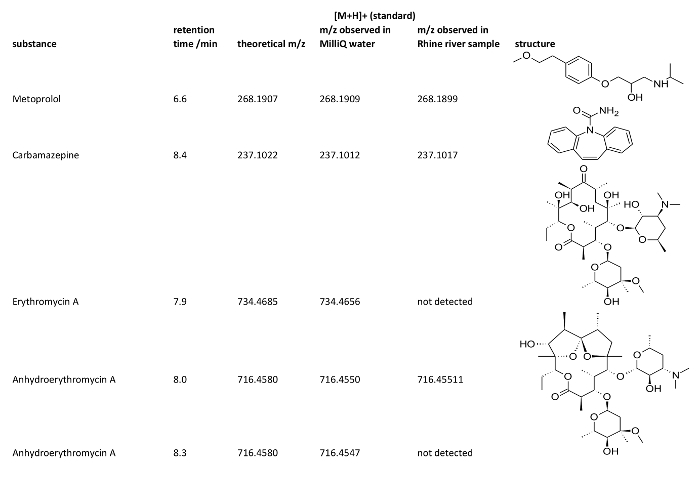
Table 2. Pharmaceuticals found in the Rhine river sample with their retention time, theoretical and observed [M+H]+ and their structure. The ESI mode was set to positive, so that [M+H]+-ions were detected. The retention time may vary minimally for usual experimental known reasons.
| pH 3 | pH 3 | pH 7 | pH 7 | pH 7 | pH 7 | pH 7 | pH 7 | pH 9 | pH 9 | pH 9 | pH 9 | |
| Product | k1 [min-1] | t1/2 [min] (k1) | k1 [min-1] | k2 [min-1] | k3 [min-1] | t1/2 [min] (k1) | t1/2 [min] (k2) | t1/2 [min] (k3) | k1 [min-1] | k2 [min-1] | t1/2 [min] (k1) | t1/2 [min] (k2) |
| Ery A | 0.1 | 6.81 | 0.59 | - | - | 1.18 | - | - | 0.21 | - | 3.37 | - |
| Ery B | 0.05 | 14.23 | 0.66 | - | - | 1.04 | - | - | 0.22 | - | 3.21 | - |
| Ery A – H2Oa | 0.11 | 6.53 | 0.59 | - | - | 1.17 | - | - | 0.19 | - | 3.72 | - |
| Ery A – H2Ob | 0.15 | 4.76 | 1.11 | - | - | 0.63 | - | - | 0.21 | - | 3.35 | - |
| Ery F | not observed | - | 0.89 | 0.35 | - | 0.78 | 1.98 | - | 1.09* | - | 0.64 | - |
| Ery C | not determined | - | 0.74 | 5.27 | 0.78 | 0.94 | 0.13 | 0.89 | 0.17 | 0.18 | 4.04 | 3.92 |
| DPEry192 | 0.35* | 1.97 | not observed | - | - | - | - | - | 0.30* | - | 2.34 | - |
| * No further degradation observed | ||||||||||||
Table 3. Kinetic rate constants and corresponding half-lives of the degradation of erythromycin and its photodegradates adapted from Voigt et al.27. Erythromycin consists of erythromycin A, erythromycin B and two forms of anhydroerythromycin. Three photodegradates were observed. There are referred to as Ery F, Ery C and DEry192.
Discussion
The example of a non-targeted analysis presented in this report demonstrated the identification of pharmaceuticals in surface water using HPLC-ESI-Q-TOF-MS, MS/MS and comparison with reference standards as the final proof. The strength of non-targeted analysis using TOF-MS is based on the detection of all ions present at a given retention time and the high mass accuracy which leads to the prediction of the tentative molecular formula. As an alternative to a TOF mass spectrometer, the application of an orbital ion trap has been described for contaminant analysis in water44. The molecular formula prediction was used as the starting point to quickly select reference standards. The application of the targeted MS method of the Q-TOF-MS instrument allowed the detection of specific compounds, since only pre-selected ions pass the quadrupole filter. In general targeted analysis is performed using triple quadrupole mass spectrometer also in water analysis45. To compensate for the deviation from the theoretical mass due to instrumental imperfections, a chromatographic comparison with a reference standard might be performed. The targeted MS/MS method may also be chosen for identification analysis. Here, ions are selected, fragmented and their fragments detected. Since MS/MS is less sensitive than MS, the concentration of the pharmaceuticals in the investigated water samples was too low to yield meaningful fragments. However, if fragments are detected, compounds can be identified with higher confidence. The insufficient sensitivity might be overcome by concentrating a larger initial water sample volume. In addition, the measurement should be carried out as soon as possible after sampling because of potential biodegradation46,47,48,49. Otherwise, samples should be stored at -20 °C to exclude compound degradation or reaction.
Sometimes the same m/z values appear at different retention times. This may be due to that the isomers require different analytical techniques. It can also occur that no compounds might be detected at all, which does not necessarily prove their absence. They might just not form ions or occur below the limit of detection. The type of water also exercises an influence on the presence of pharmaceuticals. Pharmaceuticals rarely enter source water and groundwater as compared to sewage water and effluents from wastewater treatment plants48,50,51,52,53.
For the degradation experiments, the irradiation source should be characterized in advance, since the photon flux or photon fluence rate of the lamp contributes significantly to the degradation and the mechanism of degradation. For initial attempts, a VUV/UVC lamp, probably a low-pressure mercury lamp is sufficient. In general, the addition of hydrogen peroxide, H2O2, accelerates the degradation27,36,37,54. When a different lamp, e.g., a UVA lamp, is used, the formation of hydroxyl radicals should be ensured, e.g., through the addition of titanium dioxide 23,24,30,31. For many compounds, such as erythromycin, OH radicals rather than photo-reactivity of the pharmaceutical itself27are the degradation-inducing species.
For the determination of the kinetic parameters, the area of the signals in the mass-detected chromatograms, representing concentration, is plotted versus irradiation time. To fit the data, it is advisable to use suitable software. Here, the curve fitting tool of MATLAB was used, which allowed to quickly compute and fit the data with the correct equations. The kinetic of the intermediates is determined by more complex equations. The quality parameters for the fit, i.e., R2 and RMSE, were readily obtained as well.
This study demonstrated the analysis of river water to detect and identify pharmaceutical pollutants and the photodegradation of erythromycin in ultrapure water. In environmental waters, such as surface water, different degradation velocities and rate constants would be obtained due to light absorbing substances, such as humins. According to the authors' experience, degradation often takes place more slowly, but sometimes at comparable rates41,56.
The worldwide problem of pharmaceuticals, especially antibiotics, in the aquatic environment and the resulting hazards still continue to grow1. Due to the variety and diversity of chemicals, metabolites, and degradates thereof, non-targeted analysis will become the most important analytical weapon for their discovery in the environment57. For the effective elimination, novel stages in wastewater treatment plants will need to be designed based on advanced oxidation processes, which UV irradiation might be part of.
Disclosures
The authors declare no competing financial interests.
Acknowledgements
Melanie Voigt is grateful for a stipend from the Promotionskolleg of the Niederrhein University of Applied Sciences. The authors thank their institution for further financial support.
Materials
| Name | Company | Catalog Number | Comments |
|---|---|---|---|
| Methanol for liquid chromatography LiChrosolv | Merck | 1060181000 | |
| formic acid | Fluka | 94318 | |
| HCl | Riedel-de Haen | ||
| NH3 | Riedel-de Haen | ||
| Simplicity 185 Water Purification System | EMD Millipore | for producing MilliQ-water | |
| Erythromycin | BioChemica AppliChem | A2275,0005 | |
| Filter Rotilabo-filter, Typ 113A | Roth | AP78.1 | |
| SPE-Cartridges Oasis HLB 3cc (60mg) | Waters | WAT094226 | |
| BAKER SPE-12G | J.T. Baker | ||
| membrane pump PC3001 VarioPro | Vacuubrand | ||
| rotary evaporator; Laborota 4000 efficient | Heidolph Instruments | ||
| syringe, 2 mL | Terumo | ||
| Nylon Syringe Filters Target2 | Thermo Scientific | 10301345 | |
| C-18 CoreShell column 50 mm x 2.1 mm dimensions, 2.6 μm particle size | Thermo Scientific | ||
| HPLC 1200 | Agilent | ||
| ESI-Q-ToF-MS 6530 | Agilent | ||
| photoreactor, UV Labor Reactor System 3 | Peschl Utraviolet GmbH | ||
| VUV/UVC-lamp, TNN 15/32, 15 W | Heraeus | ||
| pH-meter, pHenomenal pH 1100L | vwr | 662-1657 | |
| magnetic stirrer | Heidolph Instruments | ||
| MassHunter Workstation B.06.00 | Agilent | ||
| MATLAB R2016b | Mathworks |
References
- Kümmerer, K. Antibiotics in the aquatic environment - a review - part I. Chemosphere. 75 (4), 417-434 (2009).
- Tijani, J. O., Fatoba, O. O., Petrik, L. F. A review of pharmaceuticals and endocrine-disrupting compounds: Sources, effects, removal, and detections. Water, Air, and Soil Pollution. 224 (11), (2013).
- Li, W. C. Occurrence, sources, and fate of pharmaceuticals in aquatic environment and soil. Environmental Pollution. 187, 193-201 (2014).
- Jones, O., Voulvoulis, N., Lester, J. N. Human pharmaceuticals in the aquatic environment a review. Environmental technology. 22 (12), 1383-1394 (2001).
- Carmona, E., Andreu, V., Picó, Y. Multi-residue determination of 47 organic compounds in water, soil, sediment and fish-Turia River as case study. Journal of Pharmaceutical and Biomedical Analysis. 146, 117-125 (2017).
- Kostich, M. S., Batt, A. L., Lazorchak, J. M. Concentrations of prioritized pharmaceuticals in effluents from 50 large wastewater treatment plants in the US and implications for risk estimation. Environmental Pollution. 184, 354-359 (2014).
- Chiffre, A., Degiorgi, F., Buleté, A., Spinner, L., Badot, P. -M. Occurrence of pharmaceuticals in WWTP effluents and their impact in a karstic rural catchment of Eastern France. Environmental Science and Pollution Research. 23 (24), 25427-25441 (2016).
- Gros, M., Petrovic, M., Barceló, D. Wastewater treatment plants as a pathway for aquatic contamination by pharmaceuticals in the Ebro river basin (northeast spain). Environmental Toxicology and Chemistry. 26 (8), 1553-1562 (2007).
- Ibáñez, M., Borova, V., et al. UHPLC-QTOF MS screening of pharmaceuticals and their metabolites in treated wastewater samples from Athens. Journal of Hazardous Materials. 323, 26-35 (2017).
- Carmona, E., Andreu, V., Picó, Y. Occurrence of acidic pharmaceuticals and personal care products in Turia River Basin: From waste to drinking water. Science of the Total Environment. 484 (1), 53-63 (2014).
- Martínez, J. L. Antibiotics and Antibiotic Resistance Genes in Natural Environments. Science Mag. 321, 365-368 (2008).
- World Health Organization Antimicrobial resistance - Global Report on Surveillance. Bulletin of the World Health Organization. World Health Organization. 61 (3), 383-394 (2014).
- Proia, L., Von Schiller, D., Alexandre, S., Balc, L. Occurrence and persistence of antibiotic resistance genes in river bio fi lms after wastewater inputs in small rivers. Environmental Pollution. 210, 121-128 (2016).
- Karthikeyan, K. G., Meyer, M. T. Occurrence of antibiotics in wastewater treatment facilities in Wisconsin, USA. Science of the Total Environment. 361 (1-3), 196-207 (2006).
- Prieto-Rodriguez, L., Miralles-Cuevas, S., Oller, I., Agüera, A., Puma, G. L., Malato, S. Treatment of emerging contaminants in wastewater treatment plants (WWTP) effluents by solar photocatalysis using low TiO2 concentrations. Journal of Hazardous Materials. 211, 131-137 (2012).
- Dela Cruz, N., Giménez, J., Esplugas, S., Grandjean, D., de Alencastro, L. F., Pulgarín, C. Degradation of 32 emergent contaminants by UV and neutral photo-fenton in domestic wastewater effluent previously treated by activated sludge. Water research. 46 (6), 1947-1957 (2012).
- Zuccato, E., Castiglioni, S., Bagnati, R., Melis, M., Fanelli, R. Source, occurrence and fate of antibiotics in the Italian aquatic environment. Journal of Hazardous Materials. 179 (1-3), 1042-1048 (2010).
- Castiglioni, S., Bagnati, R., Fanelli, R., Pomati, F., Calamari, D. Removal of Pharmaceuticals in Sewage Treatment Plants in Italy. Environmental Science and Technology. 40 (1), 357-363 (2006).
- Watkinson, J., Murby, E. J., Costanzo, S. D. Removal of antibiotics in conventional and advanced wastewater treatment: implications for environmental discharge and wastewater recycling. Water research. 41 (18), 4164-4176 (2007).
- López-Serna, R., Petrović, M., Barceló, D. Development of a fast instrumental method for the analysis of pharmaceuticals in environmental and wastewaters based on ultra high performance liquid chromatography (UHPLC)-tandem mass spectrometry (MS/MS). Chemosphere. 85 (8), 1390-1399 (2011).
- Christian, T., Schneider, R. J., Färber, H. A., Skutlarek, D., Meyer, M. T., Goldbach, H. E. Determination of Antibiotic Residues in Manure, Soil, and Surface Waters. Acta hydrochimica et hydrobiologica. 31, 36-44 (2003).
- Sacher, F., Thomas, F. Pharmaceuticals in groundwaters Analytical methods and results of a monitoring program in Baden-Württemberg, Germany. Journal of Chromatography. 938, 199-210 (2001).
- Kasprzyk-Hordern, B., Dinsdale, R. M., Guwy, J. Multi-residue method for the determination of basic/neutral pharmaceuticals and illicit drugs in surface water by solid-phase extraction and ultra performance liquid chromatography-positive electrospray ionisation tandem mass spectrometry. Journal of chromatography. A. 1161 (1-2), 132-145 (2007).
- Zuckerman, J. M. Macrolides and ketolides: azithromycin, clarithromycin, telithromycin. Infectious Disease Clinics of North America. 18 (3), 621-649 (2004).
- Hassanzadeh, A., Helliwell, M., Barber, J. Determination of the stereochemistry of anhydroerythromycin A, the principal degradation product of the antibiotic erythromycin A. Organic & biomolecular chemistry. 4 (6), 1014-1019 (2006).
- Hassanzadeh, A., Barber, J., Morris, G., Gorry, P. Mechanism for the degradation of erythromycin A and erythromycin A 2'-ethyl succinate in acidic aqueous solution. Journal of Physical Chemistry A. 111 (4), 10098-10104 (2007).
- Voigt, M., Jaeger, M. On the photodegradation of azithromycin, erythromycin and tylosin and their transformation products - A kinetic study. Sustainable Chemistry and Pharmacy. 5, 131-140 (2017).
- Delaforge, M., Jaouen, M., Mansuy, D. Dual effects of macrolide antibiotics on rat liver cytochrome P-450. Biochemical Pharmacology. 32 (15), 2309-2318 (1983).
- Hansen, J. L., Ippolito, J., Ban, N., Nissen, P., Moore, P. B., Steitz, T. The structures of four macrolide antibiotics bound to the large ribosomal subunit. Molecular Cell. 10 (1), 117-128 (2002).
- Xekoukoulotakis, N. P., Xinidis, N., et al. UV-A/TiO2 photocatalytic decomposition of erythromycin in water: Factors affecting mineralization and antibiotic activity. Catalysis Today. 151 (1-2), 29-33 (2010).
- Yuan, F., Hu, C., Hu, X., Wei, D., Chen, Y., Qu, J. Photodegradation and toxicity changes of antibiotics in UV and UV/H(2)O(2) process. Journal of hazardous materials. 185 (2-3), 1256-1263 (2011).
- Monteagudo, J. M., Durán, A., San Martín, I. Mineralization of wastewater from the pharmaceutical industry containing chloride ions by UV photolysis of H2O2/Fe(II) and ultrasonic irradiation. Journal of Environmental Management. 141, 61-69 (2014).
- Malik, A. K., Blasco, C., Picó, Y. Liquid chromatography-mass spectrometry in food safety. Journal of chromatography. A. 1217 (25), 4018-4040 (2010).
- Hu, C., Xu, G. Mass-spectrometry-based metabolomics analysis for foodomics. TrAC Trends in Analytical Chemistry. 52, 36-46 (2013).
- Castro-Puyana, M., Herrero, M. Metabolomics approaches based on mass spectrometry for food safety, quality and traceability. TrAC Trends in Analytical Chemistry. 52, 74-87 (2013).
- Parsons, S. Advanced Oxidation Processes for Water and Wastewater Treatment. , IWA Publishing. London. (2004).
- Oppenländer, T. Photochemical Purification of Water and Air: Advanced Oxidation Processes (AOPs): Principles, Reaction Mechanisms, Reactor Concepts (Chemistry). , Wiley-Vch Verlag. Weinheim. (2003).
- Giannakis, S., Gamarra Vives, F. A., Grandjean, D., Magnet, A., De Alencastro, L. F., Pulgarin, C. Effect of advanced oxidation processes on the micropollutants and the effluent organic matter contained in municipal wastewater previously treated by three different secondary methods. Water Research. 84, 295-306 (2015).
- Fatta-Kassinos, D., Vasquez, M. I., Kümmerer, K. Transformation products of pharmaceuticals in surface waters and wastewater formed during photolysis and advanced oxidation processes - degradation, elucidation of byproducts and assessment of their biological potency. Chemosphere. 85 (5), 693-709 (2011).
- Vasconcelos, T. G., Henriques, D. M., König, A., Martins, A. F., Kümmerer, K. Photo-degradation of the antimicrobial ciprofloxacin at high pH: Identification and biodegradability assessment of the primary by-products. Chemosphere. 76 (4), 487-493 (2009).
- Voigt, M., Savelsberg, C., Jaeger, M. Photodegradation of the antibiotic spiramycin studied by high-performance liquid chromatography-electrospray ionization-quadrupole time-of-flight mass spectrometry. Toxicological & Environmental Chemistry. 99 (4), 624-640 (2017).
- Mauser, H. Formale Kinetik. Experimentelle Methoden der Physik und der Chemie. , Bertelsmann-UniversitĂtsverlag. Düsseldorf. (1974).
- Connors, K. A. Chemical Kinetics The Study of Reaction Rates in Solution. , VCH Verlagsgesellschaft. (1990).
- Comtois-Marotte, S., Chappuis, T., et al. Analysis of emerging contaminants in water and solid samples using high resolution mass spectrometry with a Q Exactive orbital ion trap and estrogenic activity with YES-assay. Chemosphere. 166, 400-411 (2017).
- Gago-Ferrero, P., Borova, V., Dasenaki, M. E., Thomaidis, N. S. Simultaneous determination of 148 pharmaceuticals and illicit drugs in sewage sludge based on ultrasound-assisted extraction and liquid chromatography-tandem mass spectrometry. Analytical and bioanalytical chemistry. 407 (15), 4287-4297 (2015).
- Yang, C., Hsiao, W., Chang, B. Chemosphere Biodegradation of sulfonamide antibiotics in sludge. Chemosphere. 150, 559-565 (2016).
- Gartiser, S., Urich, E., Alexy, R., Kümmerer, K. Ultimate biodegradation and elimination of antibiotics in inherent tests. Chemosphere. 67 (3), 604-613 (2007).
- Guerra, P., Kim, M., Shah, a, Alaee, M., Smyth, S. Occurrence and fate of antibiotic, analgesic/anti-inflammatory, and antifungal compounds in five wastewater treatment processes. The Science of the total environment. 473, 235-243 (2014).
- Jelic, A., Gros, M., et al. Occurrence, partition and removal of pharmaceuticals in sewage water and sludge during wastewater treatment. Water Research. 45 (3), 1165-1176 (2011).
- Lin, A. Y. -C., Tsai, Y. -T. Occurrence of pharmaceuticals in Taiwan's surface waters: Impact of waste streams from hospitals and pharmaceutical production facilities. Science of The Total Environment. 407 (12), 3793-3802 (2009).
- Sun, J., Luo, Q., Wang, D., Wang, Z. Occurrences of pharmaceuticals in drinking water sources of major river watersheds, China. Ecotoxicology and Environmental Safety. 117, 132-140 (2015).
- Nikolaou, A., Meric, S., Fatta, D. Occurrence patterns of pharmaceuticals in water and wastewater environments. Analytical and Bioanalytical Chemistry. 387 (4), 1225-1234 (2007).
- Gao, P., Ding, Y., Li, H., Xagoraraki, I. Occurrence of pharmaceuticals in a municipal wastewater treatment plant: Mass balance and removal processes. Chemosphere. 88 (1), 17-24 (2012).
- Andreozzi, R., Caprio, V., Insola, A., Marotta, R. Advanced oxidation processes (AOP) for water purification and recovery. Catalysis Today. 53, 51-59 (1999).
- Fernández, C., Callao, M. P., Larrechi, M. S. Kinetic analysis of C.I. Acid Yellow 9 photooxidative decolorization by UV-visible and chemometrics. Journal of hazardous materials. 190 (1-3), 986-992 (2011).
- Voigt, M., Bartels, I., Nickisch-Hartfiel, A., Jaeger, M. Photoinduced degradation of sulfonamides, kinetic, and structural characterization of transformation products and assessment of environmental toxicity. Toxicological & Environmental Chemistry. 99 (9-10), 1304-1327 (2017).
- Hoff, R., Mara, T., Diaz-Cruz, M. Trends in Environmental Analytical Chemistry Trends in sulfonamides and their by-products analysis in environmental samples using mass spectrometry techniques. Trends in Environmental Analytical Chemistry. 9, 24-36 (2016).
Reprints and Permissions
