Full-length individual proviral sequencing (FLIPS) provides an efficient and high-throughput method for the amplification and sequencing of single, near full-length (intact and defective) HIV-1 proviruses and allows for determination of their potential replication-competency. FLIPS overcomes limitations of previous assays designed to sequence the latent HIV-1 reservoir.
Method Article
Amplification of Near Full-length HIV-1 Proviruses for Next-Generation Sequencing
In This Article
Summary
Abstract
The Full-Length Individual Proviral Sequencing (FLIPS) assay is an efficient and high-throughput method designed to amplify and sequence single, near full-length (intact and defective), HIV-1 proviruses. FLIPS allows determination of the genetic composition of integrated HIV-1 within a cell population. Through identifying defects within HIV-1 proviral sequences that arise during reverse transcription, such as large internal deletions, deleterious stop codons/hypermutation, frameshift mutations, and mutations/deletions in cis acting elements required for virion maturation, FLIPS can identify integrated proviruses incapable of replication. The FLIPS assay can be utilized to identify HIV-1 proviruses that lack these defects and are therefore potentially replication-competent. The FLIPS protocol involves: lysis of HIV-1 infected cells, nested PCR of near full-length HIV-1 proviruses (using primers targeted to the HIV-1 5' and 3' LTR), DNA purification and quantification, library preparation for Next-generation Sequencing (NGS), NGS, de novo assembly of proviral contigs, and a simple process of elimination for identifying replication-competent proviruses. FLIPS provides advantages over traditional methods designed to sequence integrated HIV-1 proviruses, such as single-proviral sequencing. FLIPS amplifies and sequences near full-length proviruses enabling replication competency to be determined, and also uses fewer amplification primers, preventing the consequences of primer mismatches. FLIPS is a useful tool for understanding the genetic landscape of integrated HIV-1 proviruses, especially within the latent reservoir, however, its utilization can extend to any application in which the genetic composition of integrated HIV-1 is required.
Introduction
Genetic characterization of the latent HIV-1 reservoir, which persists in individuals on long-term antiretroviral therapy (ART), has been vital to understanding that the majority of integrated proviruses are defective and replication-incompetent1,2. During the process of reverse transcription, errors are introduced into the integrated proviral sequence. Some mechanisms that generate defective proviral sequences include the error-prone HIV-1 reverse transcriptase enzyme3, template switching4, and/or APOBEC-induced hypermutation5,6. Two recent studies have found that approximately 5% of HIV-1 proviruses isolated from individuals on long-term ART are genetically intact, and potentially replication-competent, and may contribute to the rapid rebound in HIV-1 plasma levels upon cessation of ART1,2,7. Previous studies have identified that replication-competent HIV-1 proviruses persist in naïve and resting memory CD4+ T cell subsets (including central, transitional and effector memory T cells), indicating the importance of targeting these cells in future eradication strategies2,8,9.
Early insights into the distribution, dynamics and maintenance of the latent HIV-1 reservoir were achieved through utilization of single-proviral sequencing (SPS) methods that genetically characterize sub-genomic regions of the HIV-1 genome10,11,12,13. SPS is a versatile tool, able to sequence a single HIV-1 provirus from within a single infected cell. However, SPS is unable to determine the replication-competency of proviruses, since it only sequences sub-genomic regions and misses proviruses that contain large deletions within primer binding sites. A previous study has demonstrated that SPS overestimates the size of the replication-competent reservoir by 13- to 17-fold through selectively sequencing intact sub-genomic regions2.
To address the limitations of SPS, Ho et al.4 and Bruner et al.1 developed assays to sequence near full-length HIV-1 proviruses. This allowed the frequency of genetically intact, and potentially replication-competent, HIV-1 proviruses in individuals on long-term ART to be determined. These assays amplified and sequenced (via Sanger sequencing) sub-genomic regions that were then assembled to obtain a sequence of the (intact or defective) HIV-1 provirus. Three limitations of this approach are: 1) the use of multiple sequencing primers increases the risk of unintentionally introducing defects into the proviral sequence, 2) primer mismatches may prevent amplification of particular proviruses, and 3) often the entire proviral sequence cannot be resolved due to the technicality of these methods.
To overcome the limitations of existing full-length HIV-1 proviral sequencing assays, we developed the Full-Length Individual Proviral Sequencing (FLIPS) assay. FLIPS is a next-generation sequencing (NGS)-based assay which amplifies and sequences near full-length (intact or defective) HIV-1 proviruses in a high-throughput and efficient manner. FLIPS provides advantages over previous assays, as it limits the number of primers utilized; therefore, it decreases the chance of primer mismatches, which may limit the population of proviruses captured or unintentionally introduce defects into a viral sequence. FLIPS is also less technically challenging than previous assays and involves 6 main steps: 1) lysis of HIV-1 infected cells, 2) amplification of single HIV-1 proviruses via nested PCR performed at limiting dilution using primers specific for the highly conserved HIV-1 5' and 3' U5 LTR region (Figure 1A), 3) purification and quantification of amplified products, 4) library preparation of amplified proviruses for NGS, 5) NGS, and 6) de novo assembly of sequenced proviruses to obtain contigs of each individual provirus.
Sequences generated by FLIPS can undergo a stringent process of elimination to identify those which are genetically intact and potentially replication-competent (Figure 1C)2. Genetically intact proviruses lack all known defects which result in generation of a replication-incompetent provirus. These defects include: inversion sequences, large internal deletions, hypermutation/deleterious stop codons, frameshifts, or mutations in the 5' packaging signal or major splice donor (MSD) site.
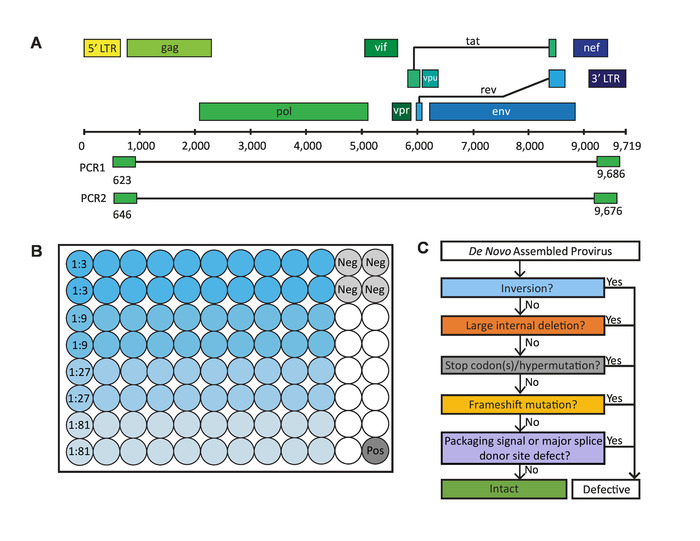
Figure 1: Critical steps in the full-length individual proviral sequencing (FLIPS) assay. (A) HIV-1 DNA genome with primer binding sites in 5' and 3' U5 LTR regions used by FLIPS to amplify near full-length (defective and intact) HIV-1 proviruses via nested PCR. (B) Layout of a 96-well PCR plate containing 80 sample wells (20 wells for each dilution), 4 negative control wells, and 1 positive control well. (C) Process of elimination used to identify genetically intact, and potentially replication-competent, HIV-1 proviruses. This figure has been modified from Hiener et al.2. Please click here to view a larger version of this figure.
Protocol
All methods described here have been approved by the institutional review boards at the University of California San Francisco and the Western Sydney Local Health District, which includes The Westmead Institute for Medical Research.
1. Lysis of HIV-1-infected Cells
NOTE: Cells may be isolated from peripheral blood, leukapheresis samples, bone marrow biopsy, or tissue biopsy. Cell populations may be sorted using fluorescence-activated cell sorting (FACS).
- Prepare a lysis buffer containing 10 mM Tris-HCl, 0.5% Nonidet P-40, 0.5% Tween-20, and 0.3 mg/mL proteinase K. To a cell pellet, add 100 µL of lysis buffer per 1 x 10⁶ cells. Pipette up and down to mix. Incubate at 55 °C for 1 hour followed by 85 °C for 15 min to lyse the cells and release genomic DNA for PCR amplification.
NOTE: Cell lysis is sufficient to obtain genomic DNA for amplification. No DNA isolation or purification is required. The protocol can be paused at this point and genomic DNA can be stored at -20 °C indefinitely.
2. Amplification of Single HIV-1 DNA Proviruses via Nested PCR
- Mix the reagents for the first round PCR (PCR1) listed in Table 1 (see Table of Materials). Add 38 µL of master mix to 85 wells (80 samples, 4 negative controls, 1 positive control) of a 96-well PCR plate (follow the layout in Figure 1B). Designate this plate ‘PCR1’.
| Reagent | Final Concentration | Volume for PCR1 plate (µL) | Volume for PCR2 plate (µL) |
| Forward Primer | 1 µM | 32.3 | 23.8 |
| Reverse Primer | 1 µM | 32.3 | 23.8 |
| Buffer (10x) | 1x | 323 | 238 |
| MgSO4 (50 mM) | 2 mM | 129.2 | 95.2 |
| dNTP (10 mM) | 0.2 mM | 64.6 | 47.6 |
| DNA polymerase (5 U/µL) | 0.025 U/µL | 16.2 | 11.9 |
| Ultrapure H2O | 2632.5 | 1939.7 |
Table 1: Reagents and volumes for PCR master mixes.
NOTE: The primers used for PCR1 are:
BLOuterF: 5’-AAATCTCTAGCAGTGGCGCCCGAACAG-3’ (HXB2 position 623-649)
BLOuterR: 5’-TGAGGGATCTCTAGTTACCAGAGTC-3’ (HXB2 position 9662-9686)
- After preparing the master mix, move the PCR1 plate to a clean area designated for the addition of genomic DNA.
- Serially dilute genomic DNA from 1:3 to 1:81 with Tris-HCl (5 mM, pH 8), preparing 45 µL for each dilution (enough for 20 wells for each dilution). Add 2 µL of diluted genomic DNA to each sample well and 2 µL of Tris-HCl (5 mM, pH 8) to each negative control well (follow the layout in Figure 1B). Seal all the wells of the PCR1 plate, excluding the positive control well, using a clear adhesive seal (see Table of Materials).
Note: The above recommended dilutions serve only as a starting guide for determining the end-point dilution. Dilutions will depend on the concentration of integrated HIV-1 DNA within the samples.
- Serially dilute genomic DNA from 1:3 to 1:81 with Tris-HCl (5 mM, pH 8), preparing 45 µL for each dilution (enough for 20 wells for each dilution). Add 2 µL of diluted genomic DNA to each sample well and 2 µL of Tris-HCl (5 mM, pH 8) to each negative control well (follow the layout in Figure 1B). Seal all the wells of the PCR1 plate, excluding the positive control well, using a clear adhesive seal (see Table of Materials).
- Move to an area designated for the addition of positive control. Add 2 µL of positive control (pNL4-3 diluted to 105 copies/µL) to the positive control well of the PCR1 plate and seal the plate. Briefly spin the PCR1 plate in a PCR plate spinner or centrifuge (400 x g for 10 s at room temperature) to pull down any residual contents from the sides of the wells.
- Run the PCR1 plate in a thermocycler: 94 °C for 2 min; then 94 °C for 30 s, 64 °C for 30 s, 68 °C for 10 min for 3 cycles; 94 °C for 30 s, 61 °C for 30 s, 68 °C for 10 min for 3 cycles; 94 °C for 30 s, 58 °C for 30 s, 68 °C for 10 min for 3 cycles; 94 °C for 30 s, 55 °C for 30 s, 68 °C for 10 min for 21 cycles; then 68 °C for 10 min (30 cycles total). Hold at 4 °C.
NOTE: The protocol can be paused here and the PCR1 plate kept at 4 °C for up to 2 days. - Mix the reagents for the second round of PCR (PCR2) listed in Table 1. Add 28 µL to 85 wells (80 samples, 4 negative controls, 1 positive control) of a new 96-well PCR plate (follow the layout in Figure 1B). Designate this plate ‘PCR2’.
NOTE: The primers used for PCR2 are:
275F: 5’-ACAGGGACCTGAAAGCGAAAG-3’ (HXB2 position 646-666)
280R: 5’-CTAGTTACCAGAGTCACACAACAGACG-3’ (HXB2 position 9650-9676)
- Briefly spin the PCR1 plate in a PCR plate spinner or centrifuge (400 x g for 10 s at room temperature) to pull down any residual contents from the sides of the wells. Add 80 µL of Tris-HCl (5 mM, pH 8) to each well of the PCR1 plate.
- Transfer 2 µL of the PCR1 plate to the PCR2 plate using a multichannel pipette. Ensure samples are transferred well to well (i.e., 2 µL from well A1 of PCR1 plate is transferred to well A1 of PCR2 plate). Seal the PCR2 plate using a clear adhesive seal (see Table of Materials).
- Briefly spin the PCR2 plate in a PCR plate spinner or centrifuge (400 x g for 10 s at room temperature) to pull down any residual contents from the sides of the wells. Seal the PCR1 plate with a heat sealing film for long term storage at -20 °C (see Table of Materials).
- Run the PCR2 plate in a thermocycler: 94 °C for 2 min; then 94 °C for 30 s, 64 °C for 30 s, 68 °C for 10 min for 3 cycles; 94 °C for 30 s, 61 °C for 30 s, 68 °C for 10 min for 3 cycles; 94 °C for 30 s, 58 °C for 30 s, 68 °C for 10 min for 3 cycles; 94 °C for 30 s, 55 °C for 30 s, 68 °C for 10 min for 31 cycles; then 68 °C for 10 min (40 cycles total). Hold at 4 °C.
NOTE: The protocol can be paused here and the PCR2 plate kept at 4 °C for up to 2 days. - Briefly spin the PCR2 plate in a PCR plate spinner or centrifuge to pull down any residual contents from the sides of the wells. Add 60 µL of Tris-HCl (5 mM, pH 8) to each well using a multichannel pipette.
- Run 15 µL of each well on 2 x 48-well precast 1% agarose gels containing ethidium bromide (0.1‒0.3 µg/mL, see Table of Materials). Use a ladder with a range up to 10 kb (see Table of Materials). Visualize to identify the wells containing the amplified product and their approximate sizes. Save the gel image.
NOTE: Ensure the positive control well contains amplified product. If the negative control wells contain amplified product, consider contamination and disregard plate.
- Run 15 µL of each well on 2 x 48-well precast 1% agarose gels containing ethidium bromide (0.1‒0.3 µg/mL, see Table of Materials). Use a ladder with a range up to 10 kb (see Table of Materials). Visualize to identify the wells containing the amplified product and their approximate sizes. Save the gel image.
- Determine the dilution at which no more than 30% of wells are positive for amplified product.
NOTE: This is the end-point dilution in which a majority (80%) of wells contain amplified product from a single template. This dilution should be prepared and used in subsequent PCRs to obtain further proviral amplicons. Record the approximate size of each amplified product.
3. DNA Purification and Quantification
- Briefly spin the PCR2 plate in a PCR plate spinner or centrifuge to pull down any residual contents from the sides of the wells. Transfer 40 µL from the wells containing amplified product (at or below the end-point dilution) to a new 96-well midi plate (with a well volume of 0.8 mL, see Table of Materials).
NOTE: Write down the original and new well position of each amplified product in a spreadsheet as a record of each amplified product to be sequenced. - Purify the amplified DNA products using a magnetic bead based PCR purification kit (see Table of Materials) to remove primers, nucleotides, enzymes, oils and salts. Before starting, bring magnetic beads to room temperature and prepare fresh 80% ethanol. Use new pipette tips when appropriate to avoid cross contamination of DNA samples.
- Vortex magnetic beads to ensure they are thoroughly resuspended. Using a multichannel pipette, add 40 µL of beads to the 40 µL of amplified product in the 0.8 mL 96-well midi plate. Gently pipette up and down 10 times to mix. Alternatively, mix the solution by sealing the plate then shaking on a microplate shaker at 1,800 rpm for 2 min. Incubate at room temperature for 5 min.
- Place the plate on a magnetic stand (see Table of Materials) for 2 min. Remove and discard supernatant.
- Wash beads by adding 200 µL of 80% ethanol to each well with the plate on the stand. Incubate at room temperature for 30 s. Remove and discard the supernatant. Repeat once. Using a multichannel pipette with fine tips, remove any excess ethanol following the second wash. With the plate on the stand, allow the beads to air dry for 15 min.
- Remove the plate from the stand. Add 30 µL of elution buffer (see Table of Materials) to each well. Gently pipette up and down 10 times to mix. Alternatively, mix the solution by sealing the plate then shaking on a microplate shaker at 1,800 rpm for 2 min. Incubate at room temperature for 2 min.
- Place the plate on a magnetic stand for 2 min. Using a multichannel pipette, transfer 25 µL of supernatant (purified DNA) to a new 96-well PCR plate. Ensure that the samples are transferred well-to-well (i.e., supernatant of well A1 in 0.8 mL plate is transferred to well A1 of new 96-well plate).
NOTE: 5 uL of the eluted sample is left behind to ensure no transfer of residual purification beads.
- Determine and record the approximate concentration of each amplified DNA product following purification using a spectrophotometer (absorbance at a wavelength of 260 nm).
NOTE: Measuring the approximate concentration of each amplified product is necessary at this stage to ensure no samples are lost during the purification steps and that the approximate concentration is within the range of the standard curve used in the next stage (0.001–1 ng/µL DNA in 100 µL of volume). The protocol can be paused here and cleaned samples can be stored at -20 °C for up to 6 months. - Quantify the concentration of DNA of each purified product using a dsDNA quantification kit (see Table of Materials).
NOTE: This involves using a standard curve to determine the concentration of dsDNA in a sample. The kit includes buffer (10 mM Tris-HCl, 1 mM EDTA, pH 7.5), a lamda dsDNA standard, and a fluorescent dye. Keep all reagents on ice. Cover the tube containing dye with foil to avoid exposure to light. Measure the concentration of each amplified product in triplicate.- Dilute buffer to 1x in sterile DNase free H2O. Add 99 µL of buffer to an appropriate number of empty wells (3 times the number of amplified products to be measured, see Table 2 for an example layout) of a flat bottom tissue culture plate. Add 100 µL of buffer to 3 blank wells.
- For each amplified product to be measured, add 1 µL of purified DNA (from step 3.2.5) in triplicate to each well containing buffer (see Table 2 for an example layout).
- To prepare standards, dilute lamda dsDNA 10-fold from 2 ng/µL to 0.002 ng/µL. Add 100 µL of each dsDNA standard to 3 wells.
NOTE: Following step 3.4.4, the final concentration of the standards will range from 1 to 0.001 ng/µL - Dilute the fluorescent dye 1:200 with buffer. Quickly add 100 µL to each well containing sample, blanks, and standards. Mix up and down with a pipette. Cover the plate with foil to avoid contact with light.
- Read fluorescence emission on a microplate reader (excitation at 480 nm, emission at 520 nm). Record results in a spreadsheet.
- Determine the concentration of dsDNA in each sample using the fluorescence measurements recorded. Subtract the fluorescence measured in the blank wells from the sample and standards. Determine the average fluorescence for each sample and standard from the triplicates. Draw a standard curve based on the fluorescence measurements of the standards. Determine the concentration of the samples relative to the standards.
| 1 | 2 | 3 | 4 | 5 | 6 | 7 | 8 | 9 | 10 | 11 | 12 | |
| A | Standard (1 ng/mL) | Standard (0.1 ng/mL) | Standard (0.01 ng/mL) | Standard (0.001 ng/mL) | Blank | |||||||
| 100 mL | 100 mL | 100 mL | 100 mL | 100 mL buffer | ||||||||
| B | Standard (1 ng/mL) | Standard (0.1 ng/mL) | Standard (0.01 ng/mL) | Standard (0.001 ng/mL) | Blank | |||||||
| 100 mL | 100 mL | 100 mL | 100 mL | 100 mL buffer | ||||||||
| C | Standard (1 ng/mL) | Standard (0.1 ng/mL) | Standard (0.01 ng/mL) | Standard (0.001 ng/mL) | Blank | |||||||
| 100 mL | 100 mL | 100 mL | 100 mL | 100 mL buffer | ||||||||
| D | Sample 1: | Sample 2: | Sample 3: | Sample 4: | Sample 5: | Sample 6: | Sample 7: | Sample 8: | Sample 9: | Sample 10: | Sample 11: | Sample 12: |
| 1 mL DNA + 99 mL buffer | 1 mL DNA + 99 mL buffer | 1 mL DNA + 99 mL buffer | 1 mL DNA + 99 mL buffer | 1 mL DNA + 99 mL buffer | 1 mL DNA + 99 mL buffer | 1 mL DNA + 99 mL buffer | 1 mL DNA + 99 mL buffer | 1 mL DNA + 99 mL buffer | 1 mL DNA + 99 mL buffer | 1 mL DNA + 99 mL buffer | 1 mL DNA + 99 mL buffer | |
| E | Sample 1: | Sample 2: | Sample 3: | Sample 4: | Sample 5: | Sample 6: | Sample 7: | Sample 8: | Sample 9: | Sample 10: | Sample 11: | Sample 12: |
| 1 mL DNA + 99 mL buffer | 1 mL DNA + 99 mL buffer | 1 mL DNA + 99 mL buffer | 1 mL DNA + 99 mL buffer | 1 mL DNA + 99 mL buffer | 1 mL DNA + 99 mL buffer | 1 mL DNA + 99 mL buffer | 1 mL DNA + 99 mL buffer | 1 mL DNA + 99 mL buffer | 1 mL DNA + 99 mL buffer | 1 mL DNA + 99 mL buffer | 1 mL DNA + 99 mL buffer | |
| F | Sample 1: | Sample 2: | Sample 3: | Sample 4: | Sample 5: | Sample 6: | Sample 7: | Sample 8: | Sample 9: | Sample 10: | Sample 11: | Sample 12: |
| 1 mL DNA + 99 mL buffer | 1 mL DNA + 99 mL buffer | 1 mL DNA + 99 mL buffer | 1 mL DNA + 99 mL buffer | 1 mL DNA + 99 mL buffer | 1 mL DNA + 99 mL buffer | 1 mL DNA + 99 mL buffer | 1 mL DNA + 99 mL buffer | 1 mL DNA + 99 mL buffer | 1 mL DNA + 99 mL buffer | 1 mL DNA + 99 mL buffer | 1 mL DNA + 99 mL buffer | |
| G | ||||||||||||
| H |
Table 2: Example layout of 96-well plate for quantification of dsDNA.
- Dilute each purified product (obtained in step 3.2.5) with H2O to 0.2 ng/µL.
4. Sequencing Library Preparation
- Prepare amplified and purified proviral DNA for NGS using an NGS DNA library preparation kit (see Table of Materials). Follow the manufacturer’s instructions for all tagmentation, PCR amplification, and clean-up steps [except that the reaction volumes including input DNA (from step 3.5) can be halved to extend the use of library preparation reagents].
- Normalize libraries manually using a qPCR-based NGS library quantification kit (see Table of Materials) to determine the individual concentration of provirus. Combine individual provirus libraries in equimolar amounts to a final concentration of 4 nM, or as specified by the sequencing service provider.
NOTE: The protocol can be paused here and the pooled library stored at -20 °C. - Quantify the final pooled library using the same dsDNA quantification kit used in step 3.4. Follow the manufacturer’s instructions. Determine the average fragment lengths by running 1 µL of the pooled library on an automated electrophoresis system using an appropriate kit (see the Table of Materials). Use the concentration and average fragment lengths to determine the molarity of the pooled library.
- Combine 5 µL of the pooled library with 5 µL of 0.2 N NaOH to denature the library. Add 5 µL of 200 mM Tris-HCl to neutralize. Dilute the final library to 12.5 pM with chilled hybridization buffer (available with DNA library preparation kit) immediately prior to sequencing.
- Perform 2 x 150 nucleotide (nt) paired-end sequencing on an appropriate NGS platform (see Table of Materials).
NOTE: When 96 proviral libraries are indexed per run, this yields approximately 20 million paired-end reads per run or 200,000 reads per individual provirus library for analysis following de-multiplexing. Steps 4.4 and 4.5 are typically performed by a sequencing facility.
5. De Novo Assembly of Sequenced HIV-1 Proviruses
NOTE: To obtain the genetic sequence of each amplified provirus, contigs are assembled de novo from the paired-end reads. Many platforms (e.g., CLC Genomics Workbench14), allow the design of custom workflows for de novo assembly. Other open source software such as FastQC15, Trimmomatic16, Cutadapt17, and FLASH18 can also be utilized for processing reads, as well as tools such as Bowtie219 and SPAdes20 for read mapping and de novo assembly. The steps for the de novo assembly of HIV-1 contigs using a specific commercial platform (see the Table of Materials) are outlined below (Figure 2). Customized workflow file is available upon request.
- Import sequences and check quality: Import the paired sequence reads (in fastq.gz format) into the software, which will then be combined as single set of paired reads. Generate a sequence QC report and examine the quality of your data.
- Quality control
- Perform read trimming according to the QC report. Remove any adapter sequences and ambiguous nucleotides. Trim fifteen 5’ and two 3’ terminal nucleotides. Discard reads less than 50 nucleotides in length. Use a stringent quality limit of 0.001 corresponding to a QC phred score of 30.
- Merging overlapping pairs
- Form single extended reads by merging paired forward and reverse reads with overlapping regions.
- De novo assembly
- Use the native CLC genomics de novo assembler with a word (or k-mer) size of 30 nt and a maximum bubble size of 65 nt to assemble a random subsample of 10,000 non-overlapping paired reads. The expected coverage for the de novo assembled contig is ~200x for a ~9 kb sequence.
NOTE: This subsampling can reduce the computational burden such that most standard desktop computers can handle the assembly and analysis, and given the clonality of each provirus (one library is one provirus), this does not limit the diversity.
- Use the native CLC genomics de novo assembler with a word (or k-mer) size of 30 nt and a maximum bubble size of 65 nt to assemble a random subsample of 10,000 non-overlapping paired reads. The expected coverage for the de novo assembled contig is ~200x for a ~9 kb sequence.
- Re-mapping all reads to contigs
- To obtain the final majority consensus sequence of each provirus, map the full read set to the de novo assembled contig. Accept only contigs with a minimum average coverage of 1,000x and ensure the final contig length corresponds to the size of the band on the original agarose gel (step 2.8.1). Save the final majority consensus sequence as a .fasta file.
NOTE: Most contigs can be assembled using the above steps. However, in some cases, for a single provirus, multiple contigs with a similar coverage are assembled. In these circumstances, contigs are aligned to a near full-length (~9 kb) consensus sequence from the same participant and manually assembled into a single contig. All reads are then mapped to the manually assembled contig and the final consensus accepted if read coverage is even throughout the assembly and no single nucleotide polymorphisms (SNPs) > 40% are present.
- To obtain the final majority consensus sequence of each provirus, map the full read set to the de novo assembled contig. Accept only contigs with a minimum average coverage of 1,000x and ensure the final contig length corresponds to the size of the band on the original agarose gel (step 2.8.1). Save the final majority consensus sequence as a .fasta file.
- Further quality control
- To ensure each contig represents a single provirus, and is not due to the amplification of multiple proviruses within a single well, screen read coverage and variant calling of the final contig.
- Multiple proviral templates present during PCR are often identified by very uneven read coverage (due to the co-amplification of proviruses of different sizes) when mapping to a full-length consensus from the same participant, or by the presence of SNPs with a frequency of >40% (see representative results, Figure 4). Disregard mixed populations in subsequent analyses.
- Alignment
- Import the final consensus of each proviral sequence into sequence viewing software such as Molecular Evolutionary Genetics Analysis (MEGA) 721. Align each sequence manually to the HXB2 reference sequence. Trim the 5’ and 3’ ends to positions 666-9650 of HXB2 to remove primer sequences.
- Export the sequence list in fasta format and then align using MAFFT version 722, with manual editing where appropriate to obtain the final alignment.
NOTE: If any sequences do not align, first reverse complement the sequence. If the sequence still does not align perform a BLAST search to ensure the sequence is HIV-1. It is possible to amplify non-HIV-1 templates and these can be identified at this stage. If sequences are HIV-1 but do not align, consider the presence of inversions (see step 6.1).
6. Determining Potential Replication Competency of HIV-1 Proviral Sequences
NOTE: To identify sequences of genetically intact, and potentially replication-competent, HIV-1 proviruses a stringent process of elimination is followed (Figure 1C). Proviral sequences lacking inversions, large internal deletions, deleterious stop codons/ hypermutation, frameshift mutations, and/or defects in the MSD site or packing signal are considered genetically intact and potentially replication-competent.
- Inversions
- During the alignment stage, identify inversions. Inversions are regions where the sequence does not align to the reference HXB2 unless the region is reverse complemented.
NOTE: Depending on the application of the data, sequences containing inversions may need to be omitted from further analysis.
- During the alignment stage, identify inversions. Inversions are regions where the sequence does not align to the reference HXB2 unless the region is reverse complemented.
- Large internal deletions
- Identify contigs with large internal deletions (>600 bp) in the alignment stage. Unless the deletion sits within nef, the sequence can be defined as defective.
NOTE: Any sequences with internal deletions <600 bp will be identified by Gene Cutter (step 6.3.1) as having incomplete gene sequences.
- Identify contigs with large internal deletions (>600 bp) in the alignment stage. Unless the deletion sits within nef, the sequence can be defined as defective.
- Deleterious stop codons, frameshift mutations and deletions
- Check all contigs of length >8400 nucleotides for the presence of deleterious stop codons, frameshifts and incomplete gene sequences using the Los Alamos National Laboratory HIV Sequence Database Gene Cutter tool23.
NOTE: The Gene Cutter tool divides the proviral sequence into the genes gag, pol, vif, vpr, tat, rev, vpu, env, and nef, and translates them to amino acids. Gene Cutter then screens for the presence of stop codons and frameshift mutations (due to insertions or deletions). Contigs containing stop codons or frameshifts in any gene, excluding nef24, are classified as defective. Gene Cutter also identifies incomplete gene sequences and any proviruses with a deletion <600 bp in a gene other than nef can be reclassified as defective due to a large internal deletion.
- Check all contigs of length >8400 nucleotides for the presence of deleterious stop codons, frameshifts and incomplete gene sequences using the Los Alamos National Laboratory HIV Sequence Database Gene Cutter tool23.
- Hypermutation
- Generate a consensus of the remaining full-length proviral sequences using the Los Alamos National Laboratory HIV Sequence Database Consensus Maker tool (simple consensus maker)25. Add the consensus sequence to the top of an alignment containing only the remaining full-length proviral sequences. Using this alignment and the Los Alamos National Laboratory HIV Sequence Database Hypermut tool26 to identify APOBEC-induced G-A hypermutation in the remaining full-length proviral sequences.
- Defects in the MSD and packaging signal
- Inspect each of the remaining contigs for defects in the MSD and the packaging signal (HXB2 region 670-810) which render the proviral sequence defective4. Look for a point mutation in the MSD site (sequence GT, HXB2 744-745) or any deletion in the four stem loops of the packaging signal (SL1 (HXB2 691-734), SL2 (HXB2 736-754), SL3 (HXB2 766-779), and SL4 (HXB2 790-810)).
Results
The FLIPS assay amplifies and sequences single, near full-length HIV-1 proviruses. The protocol involves 6 steps to obtain near full-length proviral sequences. These steps include: lysis of infected cells, nested PCR of full-length (intact and defective) HIV-1 proviruses, DNA purification and quantification, sequencing library preparation, NGS, and de novo assembly of sequenced proviruses. The end of each step can be considered a checkpoint in which the quality of the product (e.g. amplified DNA, purified DNA, sequencing library or sequence) can be assessed prior to the next step. An overview of the assessment performed at the end of each step and the expected results is outlined below.
Following nested PCR, amplified products are run on a 1% agarose gel (Figure 3). The initial quality of the PCR can be determined by inspection of negative and positive controls. Negative control wells containing amplified product indicate contamination and positive control wells absent of amplified product indicate insufficient amplification. Next, wells containing amplified product are selected for sequencing. To avoid wells containing mixtures of multiple amplified proviruses, only wells containing amplified product run at end-point dilution are considered for sequencing. According to Poisson distribution, the end-point dilution is found when 30% of wells are positive for amplified product. At this dilution, there is an 80% chance these wells contain a single amplified provirus. Additionally, wells containing multiple amplified proviruses of different lengths can be visualized at this stage as multiple bands will appear on the gel. These wells should not be selected for sequencing (Figure 3).
Following purification of the amplified proviruses selected for sequencing, quantification ensures no proviral DNA is lost during the purification stage. If the DNA concentration of an amplified provirus is <0.2 ng/µL, the remaining sample in the PCR2 plate can be purified. A similar checkpoint occurs following library preparation, in which each individual library is quantified. This ensures individual proviruses have been appropriately fragmented, tagged and amplified prior to sequencing. Individual proviral libraries are pooled in equimolar amounts to a final library concentration of 4 nM (or as specified by the sequencing provider). If the concentration of an individual proviral library is too low, it can be excluded from the sequencing library pool, or the individual library prepared again. A final check of the concentration of the pooled library is performed prior to sequencing along with confirming the average fragment lengths.
Quality control steps before the de novo assembly stage ensures the quality of the reads used to assemble the final proviral contig. These steps include: removal of adapter sequences, trimming of 5' and 3' nucleotides, a stringent quality limit, and disregarding short reads. CLC Genomics Workbench can provide quality control reports that can be used before to assess the initial quality of the reads and guide trimming settings, and then after to determine if the trimming was sufficient to remove low quality regions. Additionally, for de novo assembly, the quality of the assembled contigs can be assessed for sufficient depth (>1000X) and evenness of coverage (Figure 4A). Mixed populations can also be identified at this stage. Mixtures of multiple full-length (~9 kb) proviruses are identified through the presence of multiple SNPs with a frequency of greater than 40%, whereas mixtures of short (containing a large internal deletion) and full-length proviruses can be identified by uneven read coverage following mapping to a full-length reference from the same participant (Figure 4B).
Depending on the application, the final alignment can be visualized using tools such as ggtree available as a package in "R: A language and environment for statistical computing"27. In a recent study, FLIPS was utilized to sequence HIV-1 proviruses from naïve, central, transitional, and effector memory CD4+ T cells isolated from individuals on long-term ART, with the aim to identify if particular cell subsets showed higher proportions of genetically intact and potentially replication-competent HIV-12. Here, visual representation of the sequences isolated from one participant of this study (participant 2026) is presented (Figure 5). In this participant, the majority (97%) of sequences were defective, with intact sequences found in effector and transitional memory CD4+ T cells. This visualization tool is useful for showing the number of sequences with large internal deletions and their position in the genome. It can be annotated further to indicate sequences with deleterious stop codons, frameshift mutations, and deletions/mutations in the MSD site and/or packaging signal.
One application of the FLIPS assay is the identification of genetically intact and potentially replication-competent HIV-1 proviruses. In a recent study of 531 sequences isolated from CD4+ T cells from 6 participants on long-term ART, 26 (5%) genetically intact HIV-1 proviruses were identified2. The remaining defective proviruses included those with inversion sequences (6%), large internal deletions (68%), deleterious stop codons/hypermutation (9%), frameshift mutations (1%), and defects in the packaging signal and/or mutations in the MSD site (11%).
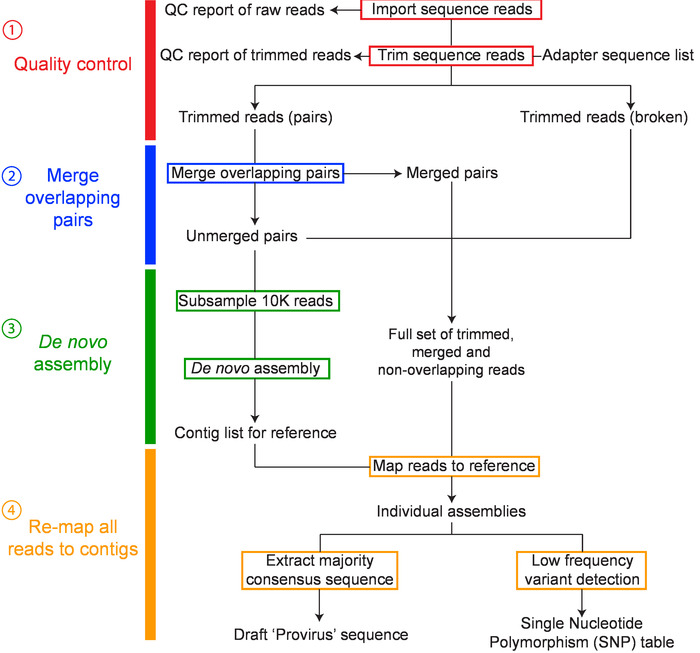
Figure 2: Overview of workflow for de novo assembly of HIV-1 proviruses. The major steps in the workflow include: 1) sequence read quality control, 2) merging overlapping pairs, 3) de novo assembly, and 4) remapping and consensus building have been colored red, blue, green and orange, respectively. This figure has been modified from Hiener et al.2. Please click here to view a larger version of this figure.
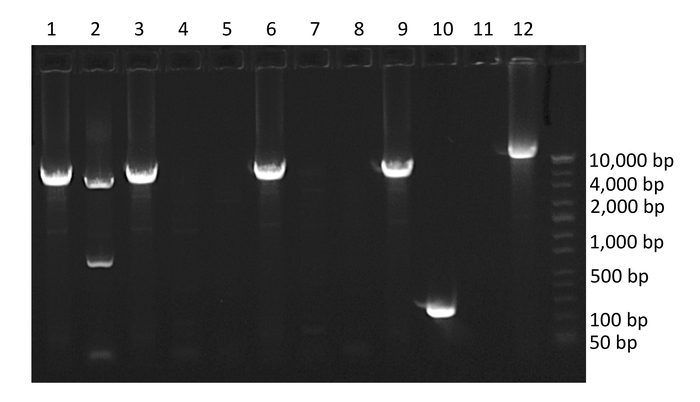
Figure 3: Example agarose gel of PCR amplified HIV-1 proviruses. Wells 1, 2, 3, 6, 9 and 10 contain amplified HIV-1 proviruses. Well 10 contains a provirus with a large internal deletion, well 2 contains co-amplification of two HIV-1 proviruses of different lengths (mixture), and well 12 contains positive control. Note the percent of wells containing amplified product is 60%, which is above the percentage required to isolate single templates. Please click here to view a larger version of this figure.
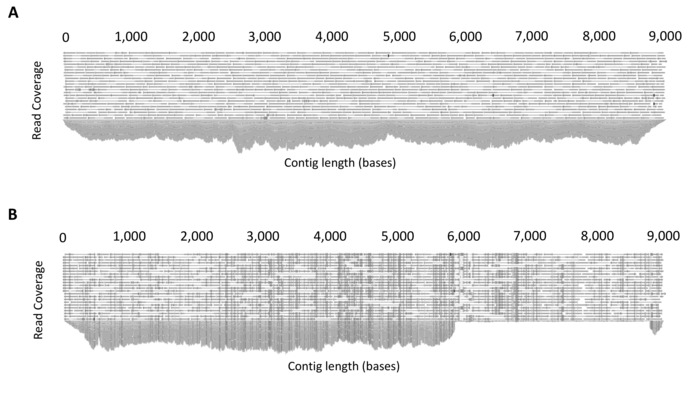
Figure 4: Example output of read mapping. (A) Example demonstrating even coverage due to the amplification of a single full-length HIV-1 provirus. Following de novo assembly, all reads are mapped to the assembled contig to produce a consensus sequence. The software platform allows the mapped reads to be inspected for sufficient and even coverage. (B) Example demonstrating co-amplification of two HIV-1 proviruses of different lengths (mixture). To determine mixtures, reads are mapped to a full-length (~9 kb) reference sequence from the same participant and read mapping inspected. The presence of uneven coverage indicates a mixture. This figure is reproduced with permission from Qiagen14. Please click here to view a larger version of this figure.
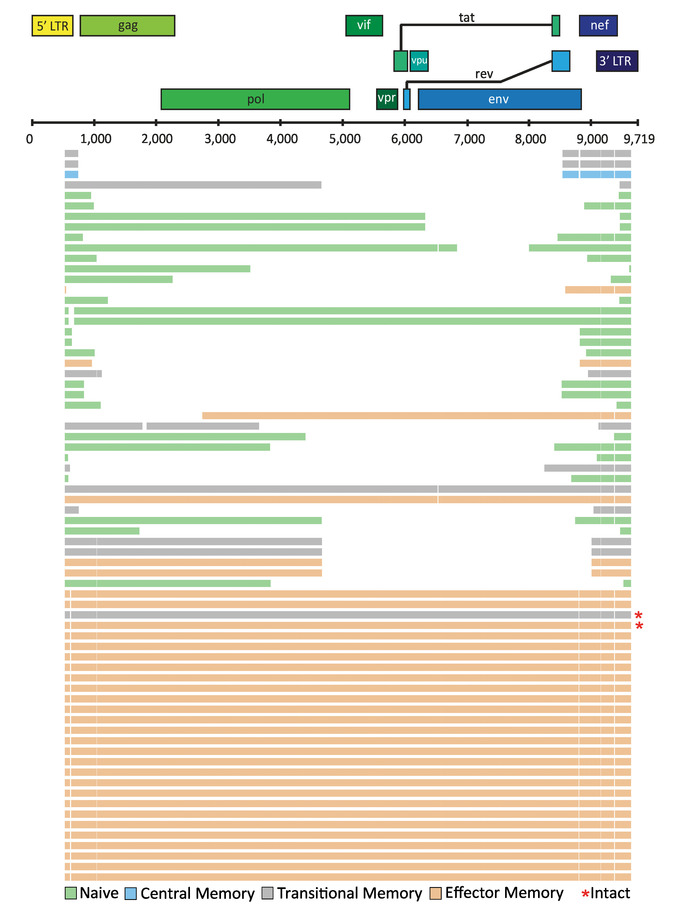
Figure 5: Example visualization of HIV-1 proviral sequences isolated from CD4+ T cell subsets from an individual on long-term ART. Individual HIV-1 proviral sequences are represented by horizontal lines. This figure has been modified from Hiener et al.2. Please click here to view a larger version of this figure.
Discussion
The FLIPS assay is an efficient and high-throughput method for amplifying and sequencing single, near full-length HIV-1 proviruses. Multiple factors and critical steps in the protocol that influence the number and quality of the sequences obtained have been identified. Firstly, the number of cells and the HIV-1 infection frequency of the cell population influence the number of proviruses amplified. For example, in a previous publication, approximately half as many sequences were obtained from the same number of naïve CD4+ T cells compared to effector memory CD4+ T cells. This is because naïve cells typically have a lower infection frequency than effector memory cells2. Secondly, cell lysis is preferable to column-based extraction methods for obtaining genomic DNA as there is no risk of losing DNA in the extraction process. Lastly, as with any PCR-based assay, preventing contamination is critical. Separated clean areas should be designated for preparing master mixes, handling genomic DNA, adding positive controls, DNA purification and quantification, and library preparation. This is particularly important for single-copy assays such as the one presented here.
Implementation of the FLIPS assay should first include running a positive control such as pNL4-3 plasmids rather than participant samples. This will allow for any troubleshooting prior to the use of HIV-1 positive cells, as the sequences obtained can be compared to available reference sequences for these plasmids. When using HIV-1 positive cells, it is important to consider the HIV-1 subtype (primers designed for FLIPS are specific to subtype B) and the infection frequency of the cell population if little to no proviruses are amplified. Primer sequences can be modified/redesigned to match other subtypes. Additionally, a well containing a positive control should be included in every PCR performed.
FLIPS has overcome the limitations of previous sequencing assays, including SPS. Through amplifying and sequencing near full-length HIV-1 proviruses, FLIPS can determine the potential replication-competency of HIV-1 proviruses. This was not possible using SPS, which sequenced only sub-genomic regions and therefore selected for sequences with intact primer binding sites. Furthermore, FLIPS overcomes the limitations associated with utilizing multiple amplification and sequencing primers, as was employed by previous full-length sequencing assays1,4. Through two rounds of PCR targeting the HIV-1 LTR regions combined with NGS, FLIPS decreases the number and complexity of primers required. FLIPS is therefore less susceptible to the consequences of primer mismatches, namely the erroneous identification of defective proviruses and an inability to amplify some proviruses within a population. The FLIPS protocol is also more efficient and allows for a higher throughput of sequencing than previous methods.
Evidently, FLIPS provides advantages over existing methods that determine the genetic composition of HIV-1 proviruses. However, it is important to acknowledge limitations of FLIPS. Firstly, the FLIPS assay has not been developed as a tool for measuring the size of the latent HIV-1 reservoir, as analyses to determine whether FLIPS amplifies every HIV-1 provirus present in a cell population have not been completed. FLIPS is instead useful for making relative comparisons of the composition of the reservoir between different cell populations2. Secondly, the replication-competency of intact HIV-1 proviruses cannot be determined with certainty without in vivo analyses, such as those performed by Ho et al.4. Thirdly, FLIPS is not designed to determine the integration site of HIV-1 proviruses.
Minor variations to the FLIPS protocol can increase its application. For example, changes in primer sequences can allow different and multiple HIV-1 subtypes to be amplified and sequenced. Sequencing of plasma HIV-1 virions is possible through the addition of cDNA synthesis prior to nested PCR. Future utilization of single molecule sequencing methods will eliminate the need for de novo assembly.
Genetic sequencing of integrated HIV-1 proviruses has increased our understanding of the latent HIV-1 reservoir. FLIPS is an important tool for future studies elucidating the composition and distribution of the latent reservoir. However, the application of FLIPS can extend beyond the reservoir. Future studies may utilize FLIPS to determine particular targets for CRISPR-Cas technology, or assist in the identification of coding and non-coding regions which make the virus more responsive to latency reversing agents. Viral recombination may be better understood by looking at the junction sites of large internal deletions.
Disclosures
The authors have nothing to disclose.
Acknowledgements
This work was supported the Delaney AIDS Research Enterprise (DARE) to Find a Cure (1U19AI096109 and 1UM1AI126611-01); an amfAR Research Consortium on HIV Eradication (ARCHE) Collaborative Research Grant from The Foundation for AIDS Research (amfAR 108074-50-RGRL); Australian Centre for HIV and Hepatitis Virology Research (ACH2); UCSF-GIVI Center for AIDS Research (P30 AI027763); and the Australian National Health and Medical Research Council (AAP1061681). We would like to thank Dr. Joey Lai, Genomics Facility Manager at The Westmead Institute for Medical Research for his training in library preparation and use of his facility, and the Ramaciotti Centre for Genomics (University of New South Wales, Sydney, Australia) for conducting sequencing. We acknowledge with gratitude the participants who donated samples for this study.
Materials
| Name | Company | Catalog Number | Comments |
|---|---|---|---|
| UltraPure 1 M Tris-HCI, pH 8.0 | Invitrogen | 15568025 | Dilute to 5 mM for nested PCR |
| Nonidet P 40 Substitute solution | Sigma | 98379 | |
| Tween-20 | Sigma | P9416 | |
| Proteinase K Solution (20 mg/mL) | Promega | AM2548 | |
| 96 well thermocycler | Any 96 well thermocycler can be used | ||
| Platinum Taq DNA Polymerase High Fidelity | Invitrogen | 11304011 | |
| 10x High Fidelity Buffer [600 mM Tris-SO4 (pH 8.9), 180 mM (NH4)2SO4] | Invitrogen | 11304011 | |
| 50 mM MgSO4 | Invitrogen | 11304011 | |
| PCR Nucleotide Mix, 10 mM | Promega | C1141 | |
| Ultrapure H2O | Invitrogen | 10977023 | |
| PCR1 and PCR2 Primers | Desalted. Dilute to (100 µM) with H2O | ||
| PCR Plate 96 Well, Half Skirt, Single Notch Corner, Clear | Axygen | PCR-96M2-HS-C | |
| Microseal 'B' Adhesive Seals | BioRad | MSB1001 | Required to seal 96 well PCR plates |
| HIV-1 NL4-3 Infectious Molecular Clone (pNL4-3) | The following reagent was obtained through the NIH AIDS Reagent Program, Division of AIDS, NIAID, NIH: HIV-1 NL4-3 Infectious Molecular Clone (pNL4-3) from Dr. Malcolm Martin (Cat# 114). | Diluted to 105 copies/mL and used as positive control | |
| PCR plate spinner or benchtop centrifuge | |||
| E-GEL 48 1% Agarose | Invitrogen | G800801 | Precast 1% agarose gels (two gels used per 96 well plate). Any 1% agarose gel can be substituted. Contains ethidium bromide. |
| DirectLoad Wide Range DNA Marker | Sigma | D7058 | Any ladder with a range up to 10 kb can be substituted |
| Mother E-Base device | Invitrogen | EBM03 | Required for running precast 48 well 1% agarose gels |
| Gel Doc EZ Gel Documentation System | BioRad | 1708270 | Any visualisation system for ethidium bromide containing agarose gels can be used |
| PlateMax Peelable Heat Sealing | Axygen | HS-200 | Heat sealing film for long term storage |
| 96 Well 0.8 mL Storage Plate | ThermoFisher Scientific | AB0765 | 0.8 mL 96 well plate required for magnetic bead based PCR purification |
| Agencourt AMPure XP (PCR purification kit) | Beckman Coulter | A63880 | Magnetic bead based PCR purification kit. Other PCR purification kits can be substitued here (e.g. QIAquick PCR Purification Kit (Qiagen Cat#28106) |
| Ethyl alcohol, Pure. 200 proof, for molecular biology | Sigma | E7023 | |
| Magnetic Stand-96 | Invitrogen | AM10027 | |
| Microplate shaker | Optional | ||
| Buffer EB | Qiagen | 19086 | Elution buffer |
| Quant-iT PicoGreen dsDNA Assay Kit | Invitrogen | P11496 | A fluorescence based stain for measuring dsDNA concentration |
| Microplate reader | |||
| Nextera XT DNA Library Preparation Kit | Illumina | FC-131-1096 | |
| Nextera XT Index Kit | Illumina | FC-131-2001 | |
| Hard-Shell 96-Well PCR Plates | Biorad | HSP9601 | Required for Nextera XT DNA library preparation kit |
| Library Quantification Kit - Illumina/Universal | Kapa Biosystems | KK4824 | Other library quantification kits can be substitued (e.g. JetSeq DNA Library Quantification Lo-Rox Kit (Bioline Cat#BIO-68029) |
| 2100 Bioanalyzer | Agilent Technology | Automated electrophoresis system . Use in conjunction with a High Sensistivity DNA kit | |
| High Sensistivty DNA kit | Agilent Technology | 5067-4626 | |
| Illumina MiSeq Platform | Illumina |
References
- Bruner, K. M., et al. Defective proviruses rapidly accumulate during acute HIV-1 infection. Nature Medicine. 22 (9), 1043-1049 (2016).
- Hiener, B., et al. Identification of Genetically Intact HIV-1 Proviruses in Specific CD4(+) T Cells from Effectively Treated Participants. Cell Reports. 21 (3), 813-822 (2017).
- Abram, M. E., Ferris, A. L., Shao, W., Alvord, W. G., Hughes, S. H. Nature, position, and frequency of mutations made in a single cycle of HIV-1 replication. Journal of Virology. 84 (19), 9864-9878 (2010).
- Ho, Y. C., et al. Replication-competent noninduced proviruses in the latent reservoir increase barrier to HIV-1 cure. Cell. 155 (3), 540-551 (2013).
- Harris, R. S., et al. DNA deamination mediates innate immunity to retroviral infection. Cell. 113 (6), 803-809 (2003).
- Lecossier, D., Bouchonnet, F., Clavel, F., Hance, A. J. Hypermutation of HIV-1 DNA in the absence of the Vif protein. Science. 300 (5622), 1112(2003).
- Chun, T. W., et al. Rebound of plasma viremia following cessation of antiretroviral therapy despite profoundly low levels of HIV reservoir: implications for eradication. AIDS. 24 (18), 2803-2808 (2010).
- Chomont, N., et al. HIV reservoir size and persistence are driven by T cell survival and homeostatic proliferation. Nature Medicine. 15 (8), 893-900 (2009).
- Soriano-Sarabia, N., et al. Quantitation of replication-competent HIV-1 in populations of resting CD4+ T cells. Journal of Virology. 88 (24), 14070-14077 (2014).
- Josefsson, L., et al. The HIV-1 reservoir in eight patients on long-term suppressive antiretroviral therapy is stable with few genetic changes over time. Proceedings of the National Academy of Sciences USA. 110 (51), E4987-E4996 (2013).
- Evering, T. H., et al. Absence of HIV-1 evolution in the gut-associated lymphoid tissue from patients on combination antiviral therapy initiated during primary infection. Public Library of Science Pathogens. 8 (2), e1002506(2012).
- von Stockenstrom, S., et al. Longitudinal Genetic Characterization Reveals That Cell Proliferation Maintains a Persistent HIV Type 1 DNA Pool During Effective HIV Therapy. Journal of Infectious Diseases. 212 (4), 596-607 (2015).
- Palmer, S., et al. Multiple, linked human immunodeficiency virus type 1 drug resistance mutations in treatment-experienced patients are missed by standard genotype analysis. Journal of Clinical Microbiology. 43 (1), 406-413 (2005).
- Qiagen. CLC Genomics Version 10. , Available from: https://www.qiagenbioinformatics.com/products/clc-genomics-workbench (2018).
- Andrews, S. FastQC: a quality control tool for high throughput sequence data. , Available from: https://www.bioinformatics.babraham.ac.uk/projects/fastqc/ (2010).
- Bolger, A. M., Lohse, M., Usadel, B. Trimmomatic: a flexible trimmer for Illumina sequence data. Bioinformatics. 30 (15), 2114-2120 (2014).
- Martin, M. Cutadapt removes adapter sequences from high-throughput sequencing reads. EMBnet.journal. 17 (1), (2011).
- Magoc, T., Salzberg, S. L. FLASH: fast length adjustment of short reads to improve genome assemblies. Bioinformatics. 27 (21), 2957-2963 (2011).
- Langmead, B., Salzberg, S. L. Fast gapped-read alignment with Bowtie 2. Nature Methods. 9 (4), 357-359 (2012).
- Bankevich, A., et al. SPAdes: a new genome assembly algorithm and its applications to single-cell sequencing. Journal of Computational Biology. 19 (5), 455-477 (2012).
- Kumar, S., Stecher, G., Tamura, K. MEGA7: Molecular Evolutionary Genetics Analysis Version 7.0 for Bigger Datasets. Molecular Biology and Evolution. 33 (7), 1870-1874 (2016).
- Katoh, K., Standley, D. M. MAFFT multiple sequence alignment software version 7: improvements in performance and usability. Molecular Biology and Evolution. 30 (4), 772-780 (2013).
- Laboratory, L. A. N. HIV Sequence Database - Gene Cutter tool. , Available from: https://www.hiv.lanl.gov/content/sequence/GENE_CUTTER/cutter.html (2018).
- Foster, J. L., Garcia, J. V. Role of Nef in HIV-1 replication and pathogenesis. Advances in Pharmacology. 55, 389-409 (2007).
- Laboratory, L. A. N. HIV Sequence Database - Consensus Maker tool. , Available from: https://www.hiv.lanl.gov/content/sequence/CONSENSUS/consensus.html (2018).
- Laboratory, L. A. N. HIV Sequence Database - Hypermut tool. , Available from: https://www.hiv.lanl.gov/content/sequence/HYPERMUT/hypermut.html (2018).
- Yu, G., Smith, D. K., Zhu, H., Guan, Y., Lam, T. T. Y. ggtree: an r package for visualization and annotation of phylogenetic trees with their covariates and other associated data. Methods in Ecology and Evolution. , (2016).
Reprints and Permissions
