An erratum was issued for The Preparation of Electrohydrodynamic Bridges from Polar Dielectric Liquids. Figure 3 was updated because it had an incorrect representation of the power used in an operating bridge.
Erratum: The Preparation of Electrohydrodynamic Bridges from Polar Dielectric Liquids
In This Article
Summary
Abstract
An erratum was issued for The Preparation of Electrohydrodynamic Bridges from Polar Dielectric Liquids. Figure 3 was updated because it had an incorrect representation of the power used in an operating bridge.
Figure 3 has been updated from:

Figure 3. Characteristic curves for a liquid water bridge. The current-voltage relationship for liquid water bridges at 0, 5, 10, 15 mm separation distance is plotted. A lower threshold below which no liquid bridge will form (see inset photo at lower left), and an upper threshold above which bridges are unstable (inset photos 1-4) bound the region of stability. For most bridges with some measureable extension (i.e. ≥ 5 mm) the total power dissipation lies between 10 and 20 watts. The rupture of a bridge beyond the upper threshold will often follow a sequence of events progressing from normal operation (inset 1), to leaking (inset 2), sagging (inset 3), and finally rupture (inset 4).
to:
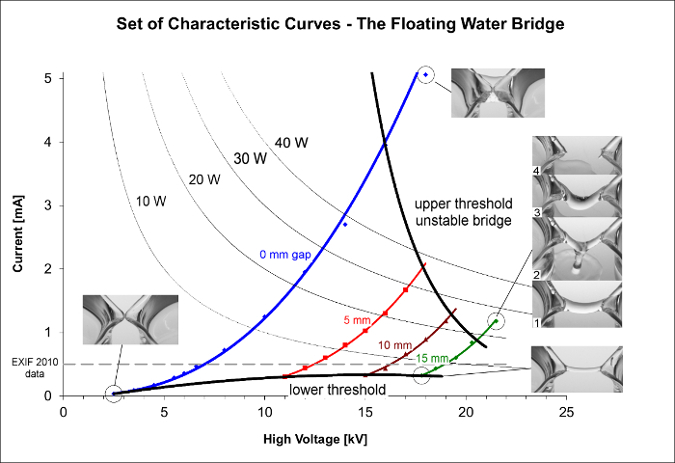
Figure 3. Characteristic curves for a liquid water bridge. The current-voltage relationship for liquid water bridges at 0, 5, 10, 15 mm separation distance is plotted. A lower threshold below which no liquid bridge will form (see inset photo at lower left), and an upper threshold above which bridges are unstable (inset photos 1-4) bound the region of stability. Power dissipation is a tunable parameter where longer bridges have a more narrow tuning range than shorter bridges. The rupture of a bridge beyond the upper threshold will often follow a sequence of events progressing from normal operation (inset 1), to leaking (inset 2), sagging (inset 3), and finally rupture (inset 4).
Protocol
An erratum was issued for The Preparation of Electrohydrodynamic Bridges from Polar Dielectric Liquids. Figure 3 was updated because it had an incorrect representation of the power used in an operating bridge.
Figure 3 has been updated from:
Figure 3. Characteristic curves for a liquid water bridge. The current-voltage relationship for liquid water bridges at 0, 5, 10, 15 mm separation distance is plotted. A lower threshold below which no liquid bridge will form (see inset photo at lower left), and an upper threshold above which bridges are unstable (inset photos 1-4) bound the region of stability. For most bridges with some measureable extension (i.e. ≥ 5 mm) the total power dissipation lies between 10 and 20 watts. The rupture of a bridge beyond the upper threshold will often follow a sequence of events progressing from normal operation (inset 1), to leaking (inset 2), sagging (inset 3), and finally rupture (inset 4).
to:
Figure 3. Characteristic curves for a liquid water bridge. The current-voltage relationship for liquid water bridges at 0, 5, 10, 15 mm separation distance is plotted. A lower threshold below which no liquid bridge will form (see inset photo at lower left), and an upper threshold above which bridges are unstable (inset photos 1-4) bound the region of stability. Power dissipation is a tunable parameter where longer bridges have a more narrow tuning range than shorter bridges. The rupture of a bridge beyond the upper threshold will often follow a sequence of events progressing from normal operation (inset 1), to leaking (inset 2), sagging (inset 3), and finally rupture (inset 4).
Disclosures
No conflicts of interest declared.