

Summary
A detailed protocol for a six-marker multiplex immunofluorescence panel is optimized and performed, using an automated stainer for more consistent results and a shorter procedure time. This approach can be directly adapted by any laboratory for immuno-oncology studies.
Abstract
Continued developments in immuno-oncology require an increased understanding of the mechanisms of cancer immunology. The immunoprofiling analysis of tissue samples from formalin-fixed, paraffin-embedded (FFPE) biopsies has become a key tool for understanding the complexity of tumor immunology and discovering novel predictive biomarkers for cancer immunotherapy. Immunoprofiling analysis of tissues requires the evaluation of combined markers, including inflammatory cell subpopulations and immune checkpoints, in the tumor microenvironment. The advent of novel multiplex immunohistochemical methods allows for a more efficient multiparametric analysis of single tissue sections than does standard monoplex immunohistochemistry (IHC). One commercially available multiplex immunofluorescence (IF) method is based on tyramide-signal amplification and, combined with multispectral microscopic analysis, allows for a better signal separation of diverse markers in tissue. This methodology is compatible with the use of unconjugated primary antibodies that have been optimized for standard IHC on FFPE tissue samples. Herein we describe in detail an automated protocol that allows multiplex IF labeling of carcinoma tissue samples with a six-marker multiplex antibody panel comprising PD-L1, PD-1, CD68, CD8, Ki-67, and AE1/AE3 cytokeratins with 4′,6-diamidino-2-phenylindole as a nuclear cell counterstain. The multiplex panel protocol is optimized in an automated IHC stainer for a staining time that is shorter than that of the manual protocol and can be directly applied and adapted by any laboratory investigator for immuno-oncology studies on human FFPE tissue samples. Also described are several controls and tools, including a drop-control method for fine quality control of a new multiplex IF panel, that are useful for the optimization and validation of the technique.
Introduction
Immunoprofiling analysis of FFPE tumor tissue samples has become an essential component of immuno-oncology studies, particularly for the discovery and validation of novel predictive biomarkers for cancer immunotherapy in the context of clinical trials1,2. Chromogenic IHC, using chemical chromogens such as diaminobenzidine, remains the standard technique in diagnostic pathology for the immunolabeling of biopsy tissue3. Standard IHC can also be used for cancer tissue immunoprofiling, including the quantitation of subpopulations of tumor-associated lymphocytes and the assessment of expression levels of immune checkpoints such as programmed cell death ligand 1 (PD-L1)4,5. Standard IHC is limited, however, in that only one antigen can be labeled per tissue section. Because immunoprofiling studies typically require the analysis of the combined expression of several markers, the use of standard IHC would require the staining of multiple tissue sections, each stained with a single marker, and would, therefore, be substantially limited for the analysis of small tissue samples such as core needle biopsies. Standard IHC methods are also limited for the assessment of markers that are coexpressed by diverse cell populations, as is common with immune checkpoint markers such as PD-L1, which is expressed by both tumor-associated macrophages and cancer cells. This limitation has been reported in, for instance, the use of standard monoplex IHC by pathologists for the quantitative analysis of an IHC marker expressed by diverse cell types6. The development of multiplex chromogenic IHC techniques employing diverse colored chromogens on the same tissue section represents an advancement over the standard IHC monoplex method,7 although they remain limited by the immunolabeling of just a few markers and also present an important technical challenge for the proper evaluation of markers expressed in the same subcellular compartments of the same cell populations.
The aforementioned caveats regarding tissue availability from clinical samples, as well as the limitations of multiplex chromogenic IHC techniques, have given rise to the need to develop improved multiplex methods for immuno-oncology studies based on fluorescent labeling combined with imaging systems that can effectively separate the signals of multiple fluorophores from the same slide. One such technique is based on tyramide signal amplification (TSA) combined with multispectral microscopy imaging for efficient color separation8. A commercially available TSA-based kit employs fluorophores optimized for multispectral imaging8 (see Table of Materials). A critical advantage of this system is its compatibility with the same unlabeled primary antibodies that have already been validated and optimized for standard chromogenic IHC9,10,11. This allows not only faster optimization but also flexibility in the optimization and panel modifications incorporating new targets. Furthermore, the multiplex immunofluorescence (mIF) TSA method can be optimized for commercially available automated IHC stainer systems, allowing for a straightforward transfer from monoplex chromogenic IHC to mIF.
Here we present a protocol for an mIF panel for immuno-oncology studies that is based on automated mIF TSA staining and uses a multispectral scanner for imaging. This protocol can be adapted and modified by any laboratory user with access to the described instrumentation and reagents. The protocol includes a panel of six primary antibodies for the immunoprofiling of carcinomas: PD-L1, PD-1, CD68 (as a pan-macrophage marker), CD8 (T-cytotoxic cells), Ki-67, and AE1/AE3 (pan-cytokeratin, used as an epithelial marker for the identification of carcinoma cells). A recent study describes the optimization of a manual TSA mIF protocol by using chromogenic IHC as a standard reference to validate the multiplex staining12. The updated method presented here has been developed by using a commercially available, seven-color TSA kit optimized in an automated stainer, drastically shortening the staining time from 3–5 days to 14 h, while also improving the consistency of the staining. In addition to the detailed main protocol presented here, a Supplemental Materials section includes the "drop-control" method, an additional quality control process to evaluate a new mIF panel, as well as technical notes for the optimization, troubleshooting, and development of new multiplex panels to help the laboratory user to set up and optimize the mIF TSA method for customized mIF panels.
Subscription Required. Please recommend JoVE to your librarian.
Protocol
NOTE: The protocol presented here describes how to perform immunoprofiling of an mIF panel by using TSA for six antibodies (CD68, ki67, PD-L1, PD-1, CD8, and AE1/AE3) on an automated stainer (see Table of Materials). The protocol also describes how to perform the drop controls for a quality control of a new mIF panel (see Supplemental Materials). In this protocol, staining is performed with eight unstained FFPE slides from human tonsil (positive control) and eight unstained slides from human lung adenocarcinoma. The first slide is used for full multiplex staining with all six markers, the second slide for the isotype control in which no primary antibodies are utilized, and the remaining six slides for the drop controls (see Supplemental Materials). An additional control for tissue autofluorescence is highly recommended and should always be included in a multiplex study (see Supplemental Materials). However, investigators can employ other tumor types and controls according to their own project goals. Laboratory users without previous experience with the mIF TSA method and multispectral scanner techniques should read the Multiplex IHC Development Guide (available online at http://info.perkinelmer.com/2016-lp-Opalassaydevelopmentguide-lp). Although this guide describes a manual protocol, it also provides a good introduction to the mIF staining method. All tissue sections employed in this protocol were anonymised and approved according to the Declaration of Helsinki.
1. Tissue Samples
- Select a FFPE human tonsil sample containing lymphoid hyperplasia to be used as a positive control and a FFPE human lung adenocarcinoma sample known to be PD-L1 positive. Review the hematoxylin and eosin (H&E) slides of the selected lung cancer blocks to confirm the presence of a tumor. It is important to avoid tumors with abundant areas of necrosis as this may increase non-specific background staining.
NOTE: For this optimization, avoid using paraffin blocks that have been stored for 10 years or more and tissue with a dried appearance in the paraffin block (consult with a histology technician). - Using a microtome, cut 10 consecutive serial sections from each block, 4 µm thick. Mount the sections on a positively charged glass slide used for IHC, one section per slide.
NOTE: Sections must be mounted perfectly flat without wrinkles, as wrinkles may generate staining artifacts. Number the slides of the serial sections from 1 to 10. - Prepare a new H&E slide on the first section. Review the H&E slide with the help of a pathologist to confirm the presence of tonsil tissue or lung tumor remaining in the block.
NOTE: This H&E slide can help, later, with the selection of the regions of interest for multispectral analysis and phenotyping. - Store unstained sections in a plastic slide box at 4 °C for up to three months.
2. Creation of a New mIF Staining Program on an Automated Stainer: Registration of the Reagents
NOTE: Reagents must be added to the reagent list in the automated stainer software before they are available for use in protocols. See the Table of Materials for information on the automated stainer model and software version.
- Click on the Reagents tab within the automated stainer software. Click Add to designate a new reagent. Enter the name (e.g., "520 TSA Reagent") and the abbreviated name (e.g., "520 TSA"), noting that there is a maximum of eight characters. Select Ancillary from the drop-down menu and set the supplier. Do not change Single/Double Stain from Single/Sequential DS. Set the default staining protocol to Protocol F. Set the default HIER protocol to ER1 20.
- Save the new reagent and repeat step 2.1 for all reagents listed in Table 1.
3. Automated Stainer: Registration of the Containers
- Write the name of the reagent to be used on the side of each container. Scan the barcode on the side. In the pop-up window, select the correct reagent from the list. Select an expiration date and save.
- Repeat the procedure in step 3.1 for all reagents listed in Table 1.
- Register the Open Research Kit. Scan both barcodes on the side of the kit and follow the on-screen prompts. Name the kit "Multiplex Research Kit 1." Register the 1x tris(hydroxymethyl)aminomethane (Tris)-buffered saline as part of this kit (Table 1).
4. Automated Stainer: Creation of an mIF Protocol Program
- The base multiplex protocol is preloaded with the name Opal 7 Multiplex on new automated stainers (see the model and software version in the Table of Materials). Locate the protocol by filtering for "all" instead of "preferred" on the protocol screen. If the base protocol is not present, then update the automated stainer software with assistance from the manufacturer.
- All modifications should be conducted on copies of the original protocol. Before making changes, save the original and create a copy by clicking the Protocols tab, then right-clicking the Opal 7 Multiplex protocol and selecting Copy.
- Change the name to 7 Multiplex protocol 1 in the new window and select the tab associated with the correct device (floor model or benchtop). Match the protocol in Supplemental Table S1. Click Add Reagent to add a 10 min peroxidase inhibition step (not part of the standard protocol) and select the peroxidase inhibitor as the reagent.
- Confirm that the blocking steps utilize a PKI blocking buffer. Ensure that each primary antibody refers to the appropriate reagent, that secondary antibody steps utilize an HRP polymer, and that spectral 4′,6-diamidino-2-phenylindole (DAPI) provided with the multispectral automation kit is utilized. Confirm all choices by checking the reagent that has been designated for each respective step in the drop-down menu on the protocol screen.
5. Automated Stainer: Addition of Drop Controls, and Isotype Control Protocol
- Copy the name 7 Multiplex protocol 1 and change it to 7 Multiplex protocol 1 CD68 DROP. Change the reagent CD68 antibody to Mouse IgG and save the protocol.
- Create six more new protocols, one for each drop control and one for the complete isotype control (changing all antibodies to the appropriate isotypes) in the same manner.
6. Automated Stainer: Slide Preparation Protocol
- Copy the prestaining protocol *Bake and Dewax and rename this protocol Multispectral Bake and Dewax 2 h.
- Adjust the protocol to match the reagents shown in Table 2. Bake slides for 2 h at 60 °C. Dewax for 30 s at 72 °C.
7. Automated Stainer: Preparation of the Reagents
- Prepare one research detection kit. One reagent must be permanently associated with this kit, so fill the 30 mL open container marked for 1x Tris-buffered saline (TBS) with 1x TBS and locate this in position 1 (farthest from the handle) in the research detection kit designated Multiplex Research Kit 1. This reagent will be permanently associated with this research kit and must not change position for future use.
- Label two 30 mL open containers Multispectral Block and Multispectral Secondary. Fill the Multispectral Block container with 30 mL of blocking buffer/antibody diluent from the multispectral staining kit. Fill the Multispectral Secondary container with 30 mL of anti-mouse/anti-rabbit secondary antibody polymer from the multispectral staining kit.
- Prepare ten 7 mL open containers. The required volume in microliters is 600 + (150 x [number of slides]). Each antibody will be applied to 12 slides in this case (six tonsil and six lung). The labeling and volumes for all containers are denoted in Table 3.
- For each antibody tube, first add the antibody diluent, followed by the concentrated primary antibody in the volumes indicated in Table 3. Mix by gentle pipetting.
- Prepare a 7 mL open container for DAPI, using four drops of DAPI concentrate per milliliter of double-distilled water; a total of 16 will be stained with DAPI (600 + [150 x 16] = 3,000 µL). Add 3 mL of double-distilled water plus 12 drops of spectral DAPI into the container. Prepare fresh DAPI for each run.
- Prepare a 7 mL open container for peroxidase inhibitor. All 16 slides will be treated with peroxidase inhibitor (600 + [150 x 16] = 3,000 µL). Add 3 mL of peroxidase block into the container.
- Before preparing working concentrations of fluors, resuspend all lyophilized fluors by adding 75 µL of dimethyl sulfoxide to each fluor tube provided by the manufacturer. Mix by pipetting. This is the TSA fluor stock. Store at 4 °C.
- Prepare six titration containers, one for each fluor. The required volume in microliters is 350 + (150 x [number of slides]). Each fluor will be applied to 16 slides in this case (eight tonsil and eight lung). The labeling and volumes for all containers are denoted in Table 4.
- When all reagents have been registered and prepared, place each container into any location on a rack and load all reagents onto the automated stainer. The probe will confirm the volume of each reagent.
8. Automated Stainer: Sample Setup and Multispectral Staining
- In the automated stainer software, click Slide Setup at the top of the screen. Click Add study. Populate the pop-up window with the study ID, study name, and comments.
- Select the name of the researcher conducting the staining run from the drop-down list. Leave the dispense volume at 150 µL. Select Multispectral Dewax for Preparation Protocol. Click OK and Add slide. Under Comments, type "Multiplex 1 Lung 123ABC." Complete the following fields as indicated: Tissue Type = Test tissue; Dispense volume = 150 µL; Staining mode = Single, Routine; Marker = Negative; Staining = Type "7 Multiplex Protocol 1"; Preparation = Multispectral Bake, Dewax 2 h; HIER = HIER 20 min with ER1.
- Click Add slide and change the comments and protocol to add the drop control slides and isotype control slide. When all slides have been added to the study, close the Add slide window and print labels. Apply the labels to the appropriate label area on each slide.
- Load the slides into racks, apply cover tiles in the correct orientation, insert the racks into the automated stainer, and lower the trays. The device will scan the slide labels.
- When all slides and reagents have been scanned and measured. The run button (►) will become active. If the autostainer detects any errors, such as insufficient reagent volume, a yellow caution symbol will appear by the affected tray. If an error occurs, right click the caution symbol and remedy the error.
- Initiate staining immediately or schedule a delayed start. The protocol is approximately 14 h in duration. NOTE: Ensure the protocol will complete at a time when the slides can be removed immediately as exess washing could impact staining results.
9. Coverslipping of the Multispectral Slides
- Remove the slides from the automated stainer and store them in a rack submerged in 1x TBS.
- Mount the samples with no. 1.5 coverslips and 15 µL of the mounting media (see Table of Materials). Remove any bubbles by pressing gently on the coverslip with a pipette tip.
- Allow the slides to cure overnight at room temperature on the laboratory bench. Uncured slides can be scanned immediately with careful handling.
10. Multispectral Scanner
- Power on the multispectral scanner and its computer (see Table of Materials for model and software information). Start the microscope control software. Open the front door of the multispectral scanner by pressing the touch-sensitive button on the front of the device. Each spring-loaded carrier in the scanner holds four slides. Load all slides into carriers and record the order before loading the carriers into the device.
- Select Edit Protocol and click New…; then, create the protocol name Multiplex Panel 1 and Drop Controls. Create the study name Multiplex Panel Development, click Create Protocol, and type Overview Scan Filter DAPI; then, select Whole Slide Scan and Pixel Resolution 0.50 µm (20X). All filters and bands should be represented. If not, click Edit Filters and Bands, select all five filters (DAPI, FITC, CY3, Texas Red, and CY5), and then, click Edit Exposures.
- Load the carrier by selecting the carrier with the full multiplex of lung adenocarcinoma. Select the correct slide by using the graphic user interface. Focus the tissue either manually or by using autofocus. Navigate to any area with acceptable DAPI staining and click Auto-expose to set the exposure in milliseconds (0–2,000 ms).
- Repeat the same procedure for all five filter sets in both the Whole Scan and MSI Region columns. Be sure to navigate to an area with acceptable staining and refocus the microscope before setting the exposure for each filter and magnification level. Auto-expose for all five filters in a 20x overall scan and 20x multispectral imaging (MSI) multispectral regions. Select a pixel resolution of 0.50 µm (20x). Save the protocol and click Back to return to the home screen of the Vectra software; then, click Scan Slides.
- Open the interface for each slide and set Task to Scan. Set Study to Multiplex Panel Development, set Protocol to Multiplex Panel 1 and Drop Controls, and set Slide ID to Multiplex Lung ABC123, Multiplex CD68 Drop Lung ABC123, etc. When all slides have been labeled and tasks are set, click Scan. The automated multispectral scanner will perform full-slide scans of all slides using all five filters.
11. Multispectral Scanner: Multispectral Imaging
- Once the scans are complete, open the QPTIFF software ("Phenochart") and click Load Slide at the upper left. This will open a QPTIFF, which is a five-filter whole-slide scan. Each layer contains information from more than one fluor, so the utility is limited, but the tissue structure and broad expression patterns are apparent and can be used to select regions for MSI.
- Navigate to and open the correct slide in the study by using the drop-down tree on the left. Log in (upper right) with user initials.
- Select five regions for MSI by using the Stamp tool at the top of the screen. Consult a pathologist if one is available. Under Select for, select Acquisition; under Size in fields, select 1x1; and under Field restriction, select 0.5 µm (20x). Based on cytokeratin (CK) staining (principally in Cy5), select several regions with both tumor (CK+) and stroma (CK-) to be imaged from the overall scan. Repeat this procedure for each slide.
- Once all MSIs are selected, close the Phenochart software and return to the Vectra software. Change the task from Scan to MSI for each slide and, then, click Scan again to perform the MSI collection.
12. Spectral Unmixing
NOTE: The spectral unmixing step is required for channel separation and image analysis of the slides. Before spectral unmixing is performed in the inForm software, the spectral library must be built by using lung adenocarcinoma slides stained with each fluor alone and with DAPI alone. This procedure is also described in the aforementioned Multiplex IHC Assay Development Guide.
- When the MSI acquisition is complete, use the spectral unmixing ("InForm") software to open files in the MSI folder. These files end in the .im3 file-type extension.
- Under Image format, select Multispectral; under Sample format, select Fluorescence; and under Spectral library source, select InForm.
- To select fluors, select and load all six fluors and DAPI from the library built with the lung adenocarcinoma library slides. Click Prepare All (lower left). Spectral unmixing software will perform spectral unmixing on all open images, using the provided spectral profiles.
- With a pathologist, assess the staining pattern against chromogenic single stains of the same target in sequential slides of the same tissue.
13. Evaluation of Fluorescence Intensity and Signal Attenuation
NOTE: The counts tool, which appears as an arrow with a small brown box, is the most important tool for multiplex optimization and should be used frequently (see Supplemental Materials). Using the counts tool in the spectral unmixing software, assess the signal-to-noise ratio, which at a minimum should exceed 10:1 (see Supplemental Materials for troubleshooting and for the evaluation of the multiplex staining with the drop controls).
- 13.1. With an image open in the spectral unmixing software, engage the counts tool and survey images to assess the fluorescence intensity of each channel. The target intensity in lung tissue is between 10 and 20 normalized counts. The normalized counts tool is shown in Figure 1.
- Exclude slides with maximum signal counts of less than 10 or normal signal area counts of less than five for any marker so that autofluorescence and off-target staining do not compete with the authentic signal.
- Exclude slides with maximum counts greater than 30 for any channel to avoid spectral bleeding or inefficient spectral unmixing.
- Address high or low normalized counts by adjusting the TSA concentration.
14. Multispectral Image Analysis
- Open one or more MSI in the spectral unmixing software and only select fluors for unmixing that are represented in at least one open image. Click Prepare All to unmix all currently opened color images to yield spectrally unmixed images.
- Select the counts tool to survey counts across each image by hovering over the area(s) of interest.
- Select the eye icon to open the view editor. Select and adjust the display intensity of each independent channel.
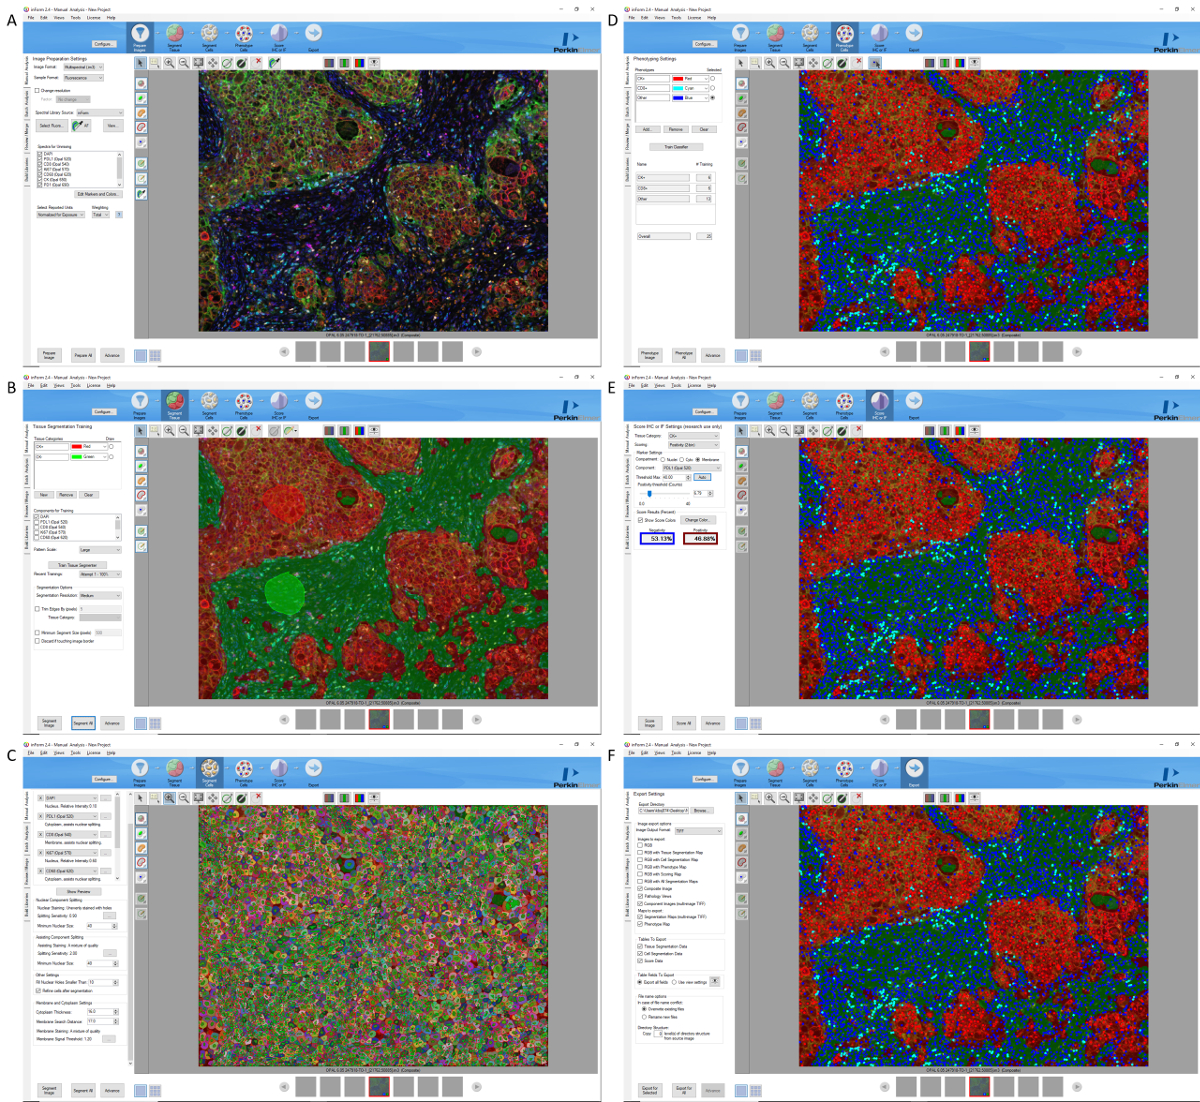
- Select Configure to open the tissue segmentation, cell segmentation, phenotyping, and scoring modules. These tools are required for the objective validation of multiplex staining against chromogenic single stains and can be used to generate quantitative phenoptic data (Figure S1).
- Use the Export tab to save grayscale, fluorescent, pathview-style uncompressed TIFF, and data files from the phenoptic analysis modules for further analysis, archiving, and presentations (Figure S1).
Subscription Required. Please recommend JoVE to your librarian.
Representative Results
The protocol described here will provide results like those shown in Figure 2. Start with an evaluation of the staining in the tonsil control, beginning with the surface squamous cell epithelium. The histology of the tonsil sample can be reviewed with a pathologist, using the H&E slide as a reference. If chromogenic IHC sections are performed with the same markers on the same tissue block, then these can be used to confirm the density and distribution of each marker on the mIF slide. As shown in Figure 2A, the tonsil tissue should provide clearly defined AE1/AE3 cytokeratin staining in the tonsil surface squamous epithelium (Figure 2A; labeled as red pseudocolor), without background in the lymphoid tissue. The staining should be cytoplasmic, occasionally with membrane accentuation, and the nuclei must be negative. The reticulated epithelium in the crypts should be positive for both cytokeratins (red) and PD-L1 (Figure 2A; green pseudocolor). The follicular germinal centers of the tonsil should, then, be identified. The germinal centers should be easily recognizable and should be rich in Ki-67-positive lymphocytes (Figure 2A; yellow pseudocolor). Ki-67 staining should always be nuclear. The macrophages present in the germinal centers should also be easily recognizable, sometimes as larger cells (also called "tingible bodies"). They will show positive staining for CD68 as a granular cytoplasmic stain (Figure 2A; orange pseudocolor). A variable proportion of CD68 cells outside the germinal centers is also to be expected. Macrophages may show membrane staining for PD-L1. This is typically paler in intensity than staining for PD-L1 in the reticulated epithelium. There should be no nuclear CD68 staining. CD8 should stain lymphocytes with a T-cell distribution (fewer in the germinal centers and a greater proportion in the interfollicular areas; see Figure 2A, cyan pseudocolor). CD8+ lymphocytes are usually small cells with scant cytoplasm, so it is practically impossible to distinguish membrane versus cytoplasm in the lymphocytes. PD-1 will strongly stain small lymphocytes in the germinal center area, usually clustered at the periphery of the germinal centers (Figure 2A; magenta pseudocolor), as well as scattered lymphocytes in the interfollicular region, usually showing a lower staining intensity than those in the germinal center area. As with CD8, it is not possible to clearly distinguish membrane and cytoplasmic staining in small lymphocytes stained with PD-1. Because a variable proportion of CD8 cells coexpress PD-1, it is recommended for quality-control purposes that the staining pattern and distribution of each marker that is stained in the same tissues be compared with chromogenic IHC reference slides, as suggested in previously published protocols12.
After the expected staining pattern has been confirmed in the tonsil tissue control, proceed to evaluate the staining in the lung cancer sample (Figure 2B). Because tumor tissues are expected to show a variable and heterogeneous expression of the markers, it is very important during the optimization of a new mIF panel to compare the staining pattern for each individual marker observed in the mIF method and its expression observed in the standard chromogenic IHC slide, evaluating the quantity and distribution of the positive cells as previously described12. Nevertheless, the basic staining pattern should be preserved; for example, cytokeratins should be observed in the cytoplasm of epithelial cells and never in a nucleus; CD68 should appear as granular cytoplasmic staining in macrophages, etc. Importantly, in some markers, the staining intensity may change from the tonsil control to the cancer tissue; for example, PD-1 and PD-L1 can show lower-intensity staining in the tumor tissue as compared with the very high expression observed in tonsil control. It is, therefore, important to perform the evaluation and optimization with the counts tool in the inForm software, using examples of tumor tissues rather than the tonsil controls.
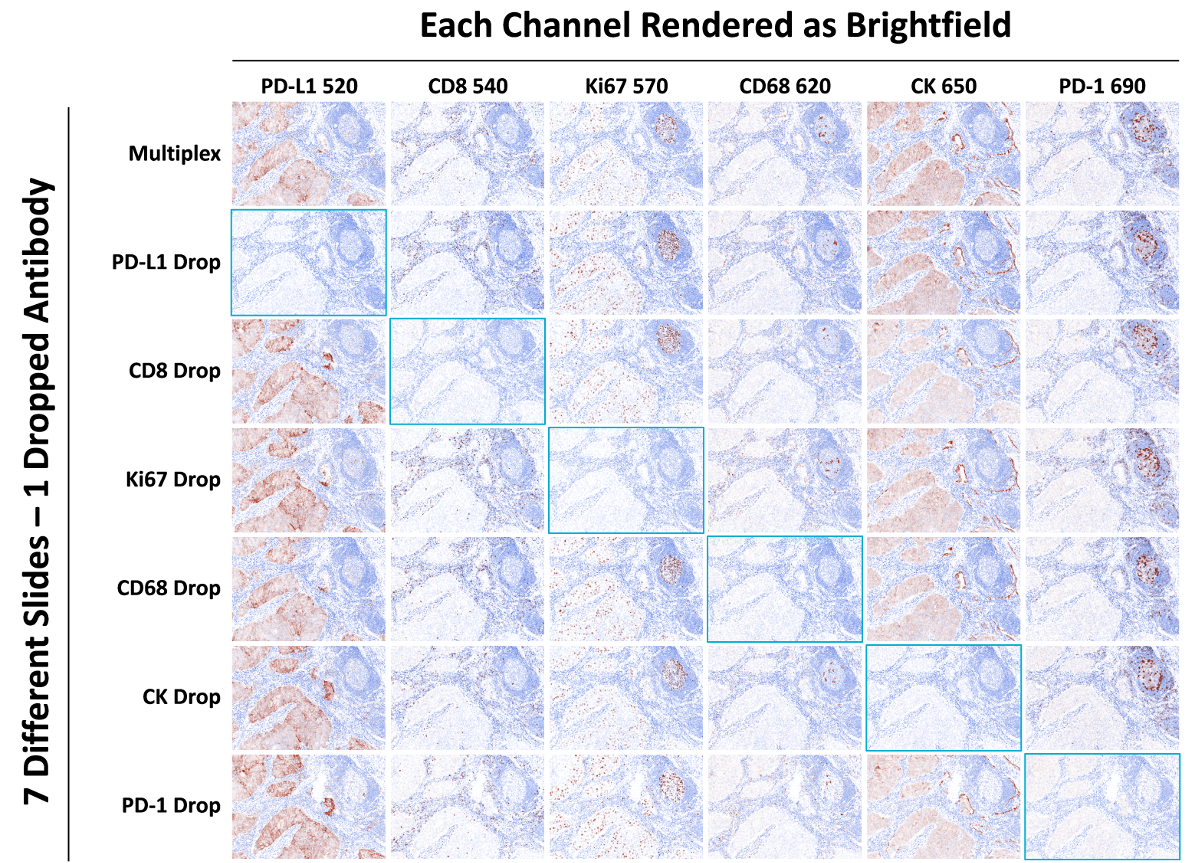
Finally, isotype-negative controls and drop controls need to be evaluated, not only for the detection of background and autofluorescence but also for umbrella effects and spectral bleed (Figure 3 and Figure 4). Isotype controls should not demonstrate any immunostaining across the slide; if any staining is observed, then the imaging or staining procedure must be revisited. Drop controls are important to evaluate potential artifacts in the staining, such as spectral bleed or umbrella effects, due to the mIF method during the optimization of a new multiplex panel (see Figure 5, Supplementary Figure S2, Supplementary Figure S3, and Supplemental Materials). Fluorescent monoplex and drop controls should be evaluated and compared with the full multiplex panel. Each drop control should show the same staining pattern except for the single primary antibody, which should be removed on each specific control. Further details are provided in the Supplemental Materials section.

Figure 1: inForm Counts Tool. The inForm software counts tool is activated by selecting the beige box icon. Normalized counts are corrected for bit depth, exposure time, gain, and binning. The images were taken at 20X magnification; the scale bar = 50 µm. Please click here to view a larger version of this figure.

Figure 2: Representative results. (A) Tonsil and (B) nonsmall-cell lung carcinoma were stained with PD-L1 (520 TSA, green), CD8 (540 TSA, cyan), Ki67 (570 TSA, yellow), CD68 (620 TSA, orange), cytokeratin (650 TSA, red), and PD-1 (690 TSA, magenta). Individual channels are represented separately below in small panels. The marker is indicated in the upper right of each image. The images were taken at 20X magnification; Scale bar = 50 (or 250 µm). Indicated in panel A are 1) lymphoid follicle, 2) germinal center, 3) interfollicular area, and 4) stratified squamous epithelium. Please click here to view a larger version of this figure.

Figure 3: TSA blocking/umbrella effect. This is an example of 690 TSA deposited by a PD-1 antibody-blocking CD3 signal in a manner dependent on the amount of TSA present. The brightest 690 TSA signal blocks the 620 TSA signal most effectively (nonsmall-cell lung carcinoma stained with anti-PD-1 D4W2J for 30 min at 0.52 µg/mL or isotype followed by a 10 min 690 TSA detection at 1:100; then, anti-CD3 F7.2.38 for 30 min at 0.14 µg/mL followed by a 10 min 620 TSA detection at 1:100). The images were taken at 20X magnification; the scale bar = 50 µm. Please click here to view a larger version of this figure.

Figure 4: Spectral bleed. Nonsmall-cell lung carcinoma tissue was stained with the Ki-67 drop-control protocol (complete multiplex protocol with Ki-67 antibody omitted). The 540 TSA channel (CD8) and the 570 TSA channel (Ki-67) are shown. No nuclear staining pattern is apparent, yet a diminished copy of the CD8 staining pattern is observed in the 570 TSA channel. This is best addressed by ensuring comparable staining intensities in all channels. In this case, the addition of a robust Ki-67 signal (normalized counts between 10 and 20) will correct the spectral bleed. The images were taken at 20X magnification; the scale bar = 50 µm. Please click here to view a larger version of this figure.

Figure 5: Drop controls. This figure shows a composite image of a full multiplex compared with the same region of sequential slides of lung adenocarcinoma stained with drop controls in which the indicated primary antibody was omitted. The images were taken at 20x magnification; Scale bar = 50 µm. Please click here to view a larger version of this figure.
| Name | Abbr. Name | Type | Container | Group |
| PKI Blocking Buffer | OPALBLOK | Ancillary | Open 30 mL | General |
| Opal Polymer HRP | OPAL 2AB | Ancillary | Open 30 mL | General |
| OPAL 1x TBS | OPAL1TBS | Ancillary | Open 30 mL | Det. Kit |
| CD68 0.30 µg/mL PG-M1 Mus | OPALCD68 | Ancillary | Open 7 mL | General |
| ki67 0.61 µg/mL MIB-1 Mus | OPALki67 | Ancillary | Open 7 mL | General |
| PD-L1 0.20 µg/mL SP263 Rab | OPALPDL1 | Ancillary | Open 7 mL | General |
| PD-1 0.52 µg/mL D4W2J Rab | OPAL PD1 | Ancillary | Open 7 mL | General |
| CD8 0.70 µg/mL SP239 Rab | OPAL CD8 | Ancillary | Open 7 mL | General |
| CK 0.24 µg/mL AE1/AE3 Mus | OPAL CK | Ancillary | Open 7 mL | General |
| Mouse IgG | OPAL MUS | Ancillary | Open 7 mL | General |
| Rabbit IgG | OPAL RAB | Ancillary | Open 7 mL | General |
| OPAL Peroxidase Block | OPALPERX | Ancillary | Open 7 mL | General |
| Spectral DAPI | OPALDAPI | Ancillary | Titration 6 mL | General |
| Opal 520 Reagent | OPAL 520 | Ancillary | Titration 6 mL | General |
| Opal 540 Reagent | OPAL 540 | Ancillary | Titration 6 mL | General |
| Opal 570 Reagent | OPAL 570 | Ancillary | Titration 6 mL | General |
| Opal 620 Reagent | OPAL 620 | Ancillary | Titration 6 mL | General |
| Opal 650 Reagent | OPAL 650 | Ancillary | Titration 6 mL | General |
| Opal 690 Reagent | OPAL 690 | Ancillary | Titration 6 mL | General |
Table 1: Leica Bond RX Protocol, Opal Reagents
| Reagent | Time (h) | Temperature (degrees Celsius) | |
| 1 | No Reagent | 120:00 | 60 |
| 2 | Bond Dewax Solution | 0:30 | 72 |
| 3 | Bond Dewax Solution | 0:00 | 72 |
| 4 | Bond Dewax Solution | 0:00 | Ambient (room temperature) |
Table 2: OPAL Preparation Protocol
| Target | µg/mL | Clone | Source | Lot | Stock µg/mL | µL Diluent | µL AB |
| CD68 | 0.3 | PG-M1 | Dako | 20043031 | 30 | 2376 | 24 |
| ki67 | 0.61 | MIB-1 | Dako | 20049476 | 46 | 2368.17 | 31.83 |
| PD-L1 | 0.2 | SP263 | Vent. | F09591 | 1.61 | 2101.86 | 298.14 |
| PD-1 | 0.52 | D4W2J | CST | 1 | 100 | 2387.52 | 12.48 |
| CD8 | 0.7 | SP239 | Ventana | 160318 | 70 | 2376 | 24 |
| CK | 0.24 | AE1/AE3 | Dako | 10129428 | 179.5 | 2396.79 | 3.21 |
| Mus IgG | 0.61 | ||||||
| Rab IgG | 0.7 |
Table 3: Primary Antibodies Preparation.
| Opal Fluor | Slides | Dilution | µL Diluent | µL Opal Fluor |
| Opal 520 | 16 | 1:200 | 2736.3 | 13.8 |
| Opal 540 | 16 | 1:700 | 2746.1 | 3.9 |
| Opal 570 | 16 | 1:150 | 2731.7 | 18.3 |
| Opal 620 | 16 | 1:100 | 2722.5 | 27.5 |
| Opal 650 | 16 | 1:350 | 2742.1 | 7.9 |
| Opal 690 | 16 | 1:150 | 2731.7 | 18.3 |
Table 4: OPAL Fluor Preparation.
Supplemental Material Word Document: Please click here to download this document.
Supplemental Figure 1: Please click here to download this figure.
Supplemental Figure 2: Please click here to download this figure.
Supplemental Figure 3: Please click here to download this figure.
Supplemental Table 1: Leica Bond RX Opal Multiplex Protocol. Please click here to download this table.
Supplemental Table 2: Summary and comparison of full multiplex, drop controls, and full isotype controls. Please click here to download this table.
Subscription Required. Please recommend JoVE to your librarian.
Discussion
The ongoing cancer immunotherapy revolution is opening novel and promising therapeutic options for cancer patients13. Advances in the field of immuno-oncology will require increased knowledge of the inflammatory tumor microenvironment, not only to understand the biology of the immunological mechanisms involved in carcinogenesis but also to find predictive biomarkers for new immunotherapy-based treatments1,2. Due to the complex biology of cancer immunology, interrogation of tumor tissue samples is usually required to develop a growing list of immune markers, which interact with each other and are frequently coexpressed by diverse cell populations in the tissue1,2,5. Clinical trials typically employ small biopsies, such as core needle or endoscopic biopsies, which are collected at different points of therapy to evaluate and monitor patient response. Such biopsies provide limited amounts of tissue, which in turn limits the number of tissue sections that can be employed for cancer immunoprofiling. This limitation is particularly onerous when traditional techniques, such as standard monoplex IHC, are used. There is, therefore, a clear need for new methods for cancer immunoprofiling that make use of multiplex techniques with the capacity to simultaneously evaluate the coexpression of different biomarkers and to make more efficient use of valuable tissue specimens.
In the multiplex staining and multispectral imaging methods described in detail here, an mIF panel is used for immuno-oncology studies on FFPE tissues such as biopsies from a clinical trial. This method has been previously described, validated, and successfully applied to cancer immunoprofiling8,9,10,11,12,14,15. Previously published protocols have described similar mIF staining methods with TSA-based systems, such as the seven-color kit, which is time-consuming and requires approximately 4 days of work by a dedicated laboratory scientist12,15. In response to these shortcomings, this protocol has been optimized by using a commercially available automated stainer, dramatically shortening the staining time to 14 h and eliminating the variability introduced by manual operators. Imaging is conducted on a multispectral scanner capable of separating the spectra of the seven or more fluorescent signals in the multiplex slides, including autofluorescence, which can be efficiently removed without degrading the signal quality. This protocol can be replicated, modified, and performed by any laboratory user with access to the instruments and reagents detailed in the Table of Materials.
Critical steps in this protocol are sections 7, 10, 11, 12. Section 7 pertains to the preparation of reagents. A careful preparation of the reagents for multiplex staining is essential, requiring the focused attention of a laboratory scientist or technician to avoid operator-dependent variation. For instance, one of the major issues with the multiplex method is staining variability, which can be reduced by the careful preparation of the dilutions of the reagents, specifically the TSA dyes. Sections 10 and 11 are related to image acquisition. An important risk is the overexposure or oversaturation of the images, which may lead to spectral bleed, an artifact in which the signal from another channel interferes with the channel being imaged (see Supplemental Materials). Carefully regulating the exposure times can help to prevent oversaturation and spectral bleed. Spectral unmixing is conducted in section 12. This relies on the preparation of the spectral library (described in the Multiplex IHC Assay Development Guide, available online). In this step, the inForm software is "trained" to specifically recognize the colors for each TSA dye. The spectral library is created by using sections from a control tissue, such as human tonsil, stained with a uniformly expressed marker, such as CD20, coupled with each individual TSA dye on individual slides. In addition, autofluorescence slides (also described in the Multiplex IHC Assay Development Guide) are needed to train the inForm software to recognize and subtract tissue autofluorescence. Autofluorescence control slides should be prepared by using samples from the same tissues being studied (such as lung cancer, etc.), treated in the same way as the mIF slides, and incubated with primary and secondary antibodies but without the TSA dye. Only a single autofluorescence spectral profile can be selected, so care must be taken to select a representation of the observable autofluorescence which may come from collagen, fibrosis, red blood cells, endogenous pigments, and other sources. Creating a new spectral library at the beginning of each new project and using an autofluorescence spectrum which is representative of the tissue study specimens, as well as running the same tissue blocks as the positive control for each batch within the same project, are valuable methodological steps that will help to improve the consistency of the spectral unmixing across different samples within the same project.
The multiplex method described in this protocol offers several troubleshooting tools, including a signal-to-noise evaluator (counts tool), drop controls (Supplemental Materials), and a pathology view for quality control of the staining. The counts tool helps to evaluate the intensity of the staining and the level of background. If the intensity and/or background levels are high, the first approach is to reduce the dilution of the TSA dye. If the problem persists, the chromogenic IHC slides used for the optimization of that particular marker should be reviewed with a pathologist, looking for the presence of background. The pathology view is generated by the inForm software, using a diaminobenzidine-like pseudocolor representation of the fluorescence from the TSA-linked fluor, as well as a faux hematoxylin representation generated from all fluorescent signals, including DAPI. Images from the pathology view help with the visual evaluation of the staining patterns by a pathologist for improved staining. These tools should always be employed during the optimization of a new panel and as quality control steps during the staining workflow.
The mIF method requires the use of primary antibodies that have been properly validated and optimized for standard chromogenic IHC on formalin-fixed tissues. For instance, one of the major advantages of the mIF TSA method is its compatibility with the use of primary antibodies that have been validated and optimized in the anatomic pathology laboratory for clinical use12. This advantage means that the multiplex panels can be customized by the laboratory user to answer specific cancer immunology questions without the need for preconjugated antibodies, providing rapid and dynamic panel development. In this regard, the actual workflow for the optimization of a new panel begins with the validation and optimization of the antibodies with standard chromogenic IHC, looking for the best dilution and staining conditions that will provide clean and consistent staining. The next step, using the same dilutions optimized for IHC, is to transfer the staining by using TSA fluors instead of diaminobenzidine and to compare the results of monoplex immunofluorescent TSA with the chromogenic IHC as reference. Finally, the antibodies can be combined in mIF staining, always using the chromogenic IHC staining pattern as a control reference to adjust the mIF TSA staining parameters, mainly the TSA dye dilutions and the staining sequence. During this process, collaboration with a pathologist is instrumental to evaluate the quality of the staining.
Limitations of this technique include the time and effort required for the optimization and validation of new panels and the immunophenotyping analysis of mIF panels. The main concern, however, is the proper validation of mIF methods. The lack of proper validation of these techniques carries the risk of generating invalid results, which may add confusing data to the literature, thereby hindering attempts to gain a better understanding of the biology of cancer immunology16. It is, therefore, incumbent on the investigator to make every effort to properly validate multiplex methods, including ensuring close participation and evaluation by pathologists with training and experience in validation and evaluation of tissue histopathology and IHC-based techniques17,18,19,20. The protocol presented here includes some of the tools that can help with the validation of a new multiplex panel, including the pathology evaluation of H&E slides before staining and analysis, the use of chromogenic IHC as a reference to optimize the mIF TSA staining, the drop control method for quality control of a new multiplex panel, and the use of isotype, autofluorescence, and drop controls. Despite the technical complexity of mIF methods, technologies such as multispectral imaging with spectral unmixing, as well as other novel multiplex platforms, are opening a new era for the analysis of tissue specimens from patients and the generation of new forms of data that is not possible with standard IHC alone. Therefore, the development and application of mIF techniques will continue to grow, becoming powerful tools for the cancer immunoprofiling of biopsies for clinical trials and helping to identify new multiparametric predictive biomarkers for immunotherapy, benefiting, above all, the cancer patient.
Subscription Required. Please recommend JoVE to your librarian.
Disclosures
This work was supported by MedImmune, the global biologics R&D arm of AstraZeneca. C.W., K.R., and C.C.H. are employees of Perkin Elmer, which produces the reagents (TSA kit) and multispectral scanners that were used in this work. M.S., K.D., A.H., W.Z., C. Bagnall, C. Brown, J.C., A.L., K.S., M.R., and J.R.C. are employees of MedImmune with stock ownership and/or stock interests or options in AstraZeneca.
Acknowledgments
Editorial support was provided by Deborah Shuman of MedImmune.
Materials
| Name | Company | Catalog Number | Comments |
| "InForm 2.4.2" Software for Spectral Unmixing and Image Analysis | PerkinElmer | CLS151066 | Called "spectral unmixing software" in text |
| "Phenochart 1.0.9" QPTIFF Software for Selection of MSI and Overall Slide Scan Viewing | PerkinElmer | CLS151067 | Called "QPTIFF software" in text |
| #1.5 Coverslips | Sigma Aldrich | 2975246 | |
| 200 Proof Ethanol | Koptec | V1001 | |
| 20x Tris-Buffered Saline | VWR | J640-4L | |
| Antibody Diluent | DAKO | S2203 | |
| Anti-CD68 Mouse Monoclonal | DAKO | M087601-2 | Clone PG-M1 |
| Anti-CD8 Rabbit Monoclonal | Ventana | M5392 | Clone SP239 |
| Anti-CK Mouse Monoclonal | DAKO | M351501-2 | Clone AE1/AE3 |
| Anti-ki67 Mouse Monoclonal | DAKO | M724001-2 | Clone MIB-1 |
| Anti-PD-1 Rabbit Monoclonal | Cell Signaling | #86163 | Clone D4W2J |
| Anti-PD-L1 Rabbit Monoclonal | Ventana | 790-4905 | Clone SP263 |
| Bond Dewax Solution | Leica | AR9222 | Called "dewax solution" in text |
| Bond Epitope Retrieval Solution 1 | Leica | AR9961 | Called "ER1" in text |
| Bond Epitope Retrieval Solution 2 | Leica | AR9640 | Called "ER2" in text |
| Bond Open Containers, 30 mL | Leica | OP309700 | Called "30 mL open containers" in text |
| Bond Open Containers, 7 mL | Leica | OP79193 | Called "7 mL open containers" in text |
| Bond Polymer Refine Detection | Leica | DS9800 | Called "chromogenic detection kit" in text |
| Bond Research Detection Kit | Leica | DS9455 | Called "research detection kit" in text |
| Bond Titration Kit | Leica | OPT9049 | Called "titration kit" in text |
| Bond Universal Covertile Novocastra | Leica | S21.2001 | Called "covertiles" in text |
| Bond Wash Solution 10X Concentrate | Leica | AR9590 | Called "10x wash solution" in text |
| BondRX Autostainer | Leica | Called "automated stainer" in text | |
| BondRX Software Version 5.2.1.204 | Leica | Called "automated stainer software" in text | |
| Opal 7-Color Automation IHC Kit | PerkinElmer | NEL801001KT | Called "multispectral staining kit" in text |
| Peroxidase Block | Leica | RE7101 | |
| ProLong Diamond Antifade Mountant | Thermo | P36965 | Called "slide mountant" in text |
| Starfrost Slides | Fisher | 15-183-51 | |
| Vectra Polaris Multispectral Microscope with "Vectra 3.0.5" Software for Multispectral Microscope Control | PerkinElmer | CLS143455 | Called "microscope control software" in text |
References
- Bethmann, D., Feng, Z., Fox, B. A. Immunoprofiling as a predictor of patient's response to cancer therapy-promises and challenges. Current Opinion in Immunology. 45, 60-72 (2017).
- Taube, J. M., et al. Implications of the tumor immune microenvironment for staging and therapeutics. Modern Pathology. 31 (2), 214-234 (2018).
- Idikio, H. A. Immunohistochemistry in diagnostic surgical pathology: contributions of protein life-cycle, use of evidence-based methods and data normalization on interpretation of immunohistochemical stains. International Journal of Clinical and Experimental Pathology. 3 (2), 169-176 (2009).
- Rebelatto, M. C., et al. Development of a programmed cell death ligand-1 immunohistochemical assay validated for analysis of non-small cell lung cancer and head and neck squamous cell carcinoma. Diagnostic Pathology. 11 (1), 95 (2016).
- Parra, E. R., et al. Immunohistochemical and image analysis-based study shows that several immune checkpoints are co-expressed in non-small cell lung carcinoma tumors. Journal of Thoracic Oncology. 13 (6), 779-791 (2018).
- Rehman, J. A., et al. Quantitative and pathologist-read comparison of the heterogeneity of programmed death-ligand 1 (PD-L1) expression in non-small cell lung cancer. Modern Pathology. 30 (3), 340-349 (2017).
- Dixon, A. R., et al. Recent developments in multiplexing techniques for immunohistochemistry. Expert Review of Molecular Diagnostics. 15 (9), 1171-1186 (2015).
- Stack, E. C., Wang, C., Roman, K. A., Hoyt, C. C. Multiplexed immunohistochemistry, imaging, and quantitation: a review, with an assessment of Tyramide signal amplification, multispectral imaging and multiplex analysis. Methods. 70 (1), 46-58 (2014).
- Feng, Z., et al. Multiparametric immune profiling in HPV- oral squamous cell cancer. JCI Insight. 2 (14), (2017).
- Feng, Z., et al. Multispectral imaging of formalin-fixed tissue predicts ability to generate tumor-infiltrating lymphocytes from melanoma. Journal for ImmunoTherapy of Cancer. 3, 47 (2015).
- Granier, C., et al. Multiplexed immunofluorescence analysis and quantification of intratumoral PD-1+ Tim-3+ CD8+ T cells. Journal of Visualized Experiments. (132), e56606 (2018).
- Parra, E. R., et al. Validation of multiplex immunofluorescence panels using multispectral microscopy for immune-profiling of formalin-fixed and paraffin-embedded human tumor tissues. Scientific Reports. 7 (1), 13380 (2017).
- Ribas, A., Wolchok, J. D. Cancer immunotherapy using checkpoint blockade. Science. 359 (6382), 1350-1355 (2018).
- Gorris, M. A. J., et al. Eight-color multiplex immunohistochemistry for simultaneous detection of multiple immune checkpoint molecules within the tumor microenvironment. Journal of Immunology. 200 (1), 347-354 (2018).
- Parra, E. R., et al. Effect of neoadjuvant chemotherapy on the immune microenvironment in non-small cell lung carcinomas as determined by multiplex immunofluorescence and image analysis approaches. Journal for ImmunoTherapy of Cancer. 6 (1), 48 (2018).
- Rimm, D., Schalper, K., Pusztai, L. Unvalidated antibodies and misleading results. Breast Cancer Research and Treatment. 147 (2), 457-458 (2014).
- Baskin, D. G., Hewitt, S. M. Improving the state of the science of immunohistochemistry: the Histochemical Society's standards of practice. Journal of Histochemistry & Cytochemistry. 62 (10), 691-692 (2014).
- Freedman, L. P., et al. The need for improved education and training in research antibody usage and validation practices. Biotechniques. 61 (1), Letter to the Editor 16-18 (2016).
- Hewitt, S. M. Reproducibility: it is just good science. Journal of Histochemistry & Cytochemistry. 64 (4), 223 (2016).
- Uhlen, M., et al. A proposal for validation of antibodies. Nature Methods. 13 (10), 823-827 (2016).
