Here, a workflow for the culture and gene expression analysis of endothelial cells under fluid shear stress is presented. Included is a physical arrangement for simultaneously housing and monitoring multiple flow chambers in a controlled environment and the use of an exogenous reference RNA for quantitative PCR.
A subscription to JoVE is required to view this content. Sign in or start your free trial.
Method Article
Gene Expression Analysis of Endothelial Cells Exposed to Shear Stress Using Multiple Parallel-plate Flow Chambers
In This Article
Summary
Abstract
We describe a workflow for the analysis of gene expression from endothelial cells subject to a steady laminar flow using multiple monitored parallel-plate flow chambers. Endothelial cells form the inner cellular lining of blood vessels and are chronically exposed to the frictional force of blood flow called shear stress. Under physiological conditions, endothelial cells function in the presence of various shear stress conditions. Thus, the application of shear stress conditions in in vitro models can provide greater insight into endothelial responses in vivo. The parallel-plate flow chamber previously published by Lane et al.9 is adapted to study endothelial gene regulation in the presence and absence of steady (non-pulsatile) laminar flow. Key adaptations in the set-up for laminar flow as presented here include a large, dedicated environment to house concurrent flow circuits, the monitoring of flow rates in real-time, and the inclusion of an exogenous reference RNA for the normalization of quantitative real-time PCR data. To assess multiple treatments/conditions with the application of shear stress, multiple flow circuits and pumps are used simultaneously within the same heated and humidified incubator. The flow rate of each flow circuit is measured continuously in real-time to standardize shear stress conditions throughout the experiments. Because these experiments have multiple conditions, we also use an exogenous reference RNA that is spiked-in at the time of RNA extraction for the normalization of RNA extraction and first-strand cDNA synthesis efficiencies. These steps minimize the variability between samples. This strategy is employed in our pipeline for the gene expression analysis with shear stress experiments using the parallel-plate flow chamber, but parts of this strategy, such as the exogenous reference RNA spike-in, can easily and cost-effectively be used for other applications.
Introduction
Vascular endothelial cells form the inner cellular lining of blood vessels in the closed cardiovascular system of higher species. They form the interface between the blood and tissues and are characterized by luminal and abluminal surfaces. The endothelium is a diverse, active, and adaptive system that regulates blood flow, nutrient trafficking, immunity, and the growth of new blood vessels1. In the body, endothelial cells normally exist in an environment where they are exposed to the frictional force of circulation, shear stress2. Shear stress is an important regulator of endothelial cell gene expression3, and endothelial cells attempt to maintain shear stress within a given range2,4. Endothelial cells demonstrate angiogenic patterning in the absence of shear stress5 that can improve tissue perfusion. Regional patterns of disturbed flow and altered shear stress are associated with the expression of inflammatory genes6 and the development of atherosclerosis7,8. Thus, models that include shear stress are a major component of understanding endothelial gene regulation.
We describe a method for studying the gene regulation in vascular endothelial cells under shear stress. This system uses non-pulsatile flow and mimics fluid shear stress levels and oxygen concentration that model conditions for arterial endothelial cells. This protocol includes details of methods for the gene knockdown using RNA interference (RNAi), the set-up for the application of shear stress using the parallel-plate flow apparatus, and methods for the spike-in of an exogenous reference RNA prior to analysis by reverse-transcriptase quantitative polymerase chain reaction (RT-qPCR). This pipeline is used for studying gene regulation in endothelial cells in the presence and absence of laminar shear stress and includes an adaptation of the parallel-plate flow apparatus described by Lane et al.9. This particular set-up was designed to facilitate the simultaneous assessment of multiple experimental conditions that allows direct comparison of shear stress conditions, as well as the normalization of RNA analysis. A large heated unit with controlled humidity is utilized to allow multiple separate flow chambers and pumps to be running simultaneously with flow rates monitored for each flow chamber assembly in real-time. The application of this set-up is used for gene knockdown using RNAi in the setting of laminar flow/shear stress, but aspects of this protocol can be applied to any assessment of RNA expression.
Common approaches to the application of shear stress for endothelial cells include microfluidic systems10, a cone-and-plate viscometer11, and a parallel-plate flow chamber12. Microfluidic systems from various manufacturers have been useful in studying mechanobiology and mechanotransduction in multiple cell and tissue types and a variety of biophysical stimuli. For endothelial cells, they have been used to study endothelial cells in isolation, as well as the interaction of endothelial cells and the trafficking of immune or tumor cells10. However, these systems are less suitable for the recovery of large numbers of cells9. Both the cone-and-plate viscometer and parallel-plate flow chambers allow the recovery of large numbers of cells in confluent monolayers12. These systems can generate a range of shear forces and patterns12. The parallel-plate flow chamber assembly9 has the advantage that real-time imaging can be performed through the glass window to evaluate cellular morphology at any time point. Furthermore, the perfusate can be collected under sterile conditions. For the system presented here, the flow can also be monitored in real-time and in a multi-chamber set-up, which facilitates the maintenance of shear conditions between chambers.
For representative experiments, human umbilical vein endothelial cells (HUVEC), which represent a macrovascular endothelial cell type, are used, and the shear stress conditions we use (1 Pa) reflect arterial conditions (0.1 - 0.7 Pa). However, this protocol can be used with other endothelial cell types, and the shear stress conditions can be adjusted according to the experimental question. For example, the evaluation of human endothelial cells in conditions that model venous circulation would require lower levels of shear stress (1 - 6 Pa) and studies that model microvascular circulation have utilized shear stress levels of 0.4 - 1.2 Pa13,14. In addition, shear stress can vary even between endothelial cells within the same blood vessel6. In the current set-up, a single monitoring system is used that can simultaneously monitor four separate flow loops. For labs that need more flow loops, there is space in the dedicated environment for an additional monitoring system.
RT-qPCR is used for the absolute quantitation of gene expression in the setting of shear stress. The relative expression of target genes is often used to compare RNA expression across conditions. Some RNA species can exist at very low quantities or be absent, thus complicating relative measurements. For example, long noncoding RNAs in endothelial cells can exert potent effects at relatively low copy numbers per cell5. In addition, differences in primer efficiency can lead to an inaccurate interpretation from utilizing the delta-delta cycle threshold (Ct) method to analyze the data. To address this concern, we perform absolute quantitation by generating a standard curve using a known quantity of plasmid DNA. Furthermore, complementary DNA (cDNA) synthesis is an inefficient process, and differences in cDNA efficiency can account for differences in RNA expression between conditions and between samples15. The application of shear stress and/or transfection reagents can affect cell proliferation, apoptosis, and viability, or add components that may interfere with RNA isolation and/or cDNA synthesis. To account for the possibility of bias from RNA isolation and cDNA synthesis, we use a spike-in RNA control synthesized in the lab, added at the time of RNA extraction and measured with each cDNA synthesis via RT-qPCR. This allows not only the adjustment for technical differences in RNA extraction and cDNA synthesis but also allows the calculation of absolute quantities per cell, when the cell count is known.
This system uses additional steps to maintain similarity or account for technical differences between conditions. We particularly emphasize these steps because of the complex nature of these experiments, which involve multiple physical set-ups and experimental conditions that can lead to experimental variability.
Access restricted. Please log in or start a trial to view this content.
Protocol
1. Preparation of Exogenous Reference RNA
NOTE: Choose an exogenous reference RNA that does not exist in the species or model of interest. For mammalian systems, firefly luciferase RNA may be used.
- Linearization of exogenous reference RNA plasmid
- Prepare exogenous reference RNA at least 48 h prior to the anticipated RNA extraction. Obtain or manufacture a cDNA clone of the chosen exogenous reference RNA, such as a firefly luciferase cDNA clone in a plasmid vector appropriate for in vitro transcription (see Table of Materials).
- Perform restriction enzyme (RE) digestion of 1 µg of full-length plasmid (the firefly luciferase plasmid is pSP-luc+ which has 4100 bp) using single-cutter RE (XhoI) in 1.5-mL microfuge tubes. Choose an RE that is a single cutter (cuts plasmid only 1x) at the 3’ end of the exogenous reference RNA sequence that leaves a 5’ overhang or blunt end. For a typical preparation, perform seven plasmid linearization reactions (steps 1.1.4 - 1.1.7) in parallel to generate sufficient RNA concentration and quantity to complete one set of experiments or one project.
- Measure the plasmid concentration using spectrophotometry or spectrofluorometry.
- Prepare an RE mixture in each tube: add 4 µL of XhoI (20,000 units/mL), 8 µL of RE buffer, x µL of plasmid (1 µg), and sufficient H2O to reach a total solution of 80 µL.
- Incubate the RE mixture for 2 h at 37 °C. Use the RE according to the manufacturer’s protocol, as any modifications can result in increased star activity or non-specific cleavage of target DNA. Heat inactivate the reaction mixture for 20 min at 65 °C.
- Terminate the RE digest with ethanol precipitation in each tube. To the RE mix, directly add 4 µL of 0.5 M EDTA pH 8.0, 8 µL of 3 M sodium acetate pH 5.2, and 184 µL of 100% ethanol. Mix well and freeze the mixture at -20 °C for 30 min.
- Spin down the mixture at 4 °C for 20 min at a relative centrifugal force (RCF) of 16,100 x g.
- Remove the supernatant with a fine tip, without touching the pellet. Air-dry the pellet for 5 min and resuspend it in 6 µL of H2O (warmed to 37 °C) by pipetting up and down 5x - 10x.
- Confirm the linearization of luciferase plasmid by running the digested product on 2% agarose gel containing ethidium bromide (EtBr) along with a 1 kb+ ladder, a supercoiled ladder, and cut and uncut plasmid. Inspect the gel and proceed to the in vitro transcription if the lane for the cut plasmid shows a single band at ~4 kb (the uncut plasmid will have three bands; Figure 1).
CAUTION: EtBr is carcinogenic. Work in a chemical fume hood.
- In vitro transcription of exogenous reference RNA plasmid
- For each tube of digested plasmid products, perform in vitro transcription using an in vitro transcription method (see Table of Materials). Follow the manufacturer’s instructions and use the appropriate phage RNA polymerase. If the method of cDNA synthesis requires a poly(A) tail, or other applications require a poly(A) tail, choose a method of in vitro transcription that includes a poly(A) tail addition (see Table of Materials).
- Combine all in vitro transcribed products into a single 1.5-mL polypropylene tube prior to purification.
- Purification of RNA from the in vitro transcription reaction
- Purify in vitro transcribed products with an in vitro transcription clean-up kit (see Table of Materials). Please follow the manufacturer’s protocol.
- Assess the RNA concentration by measuring absorbance at 260 nm using spectrophotometry.
NOTE: RNA concentration is calculated using the Beer-Lambert law. This states that the absorbance of nucleic acids (which absorb light strongly at 260 nm) is proportional to the concentration. An absorbance of 1.0 is equal to 40 µg/mL of single-stranded RNA.
- Aliquoting the stock RNA into PCR tubes for experimental use
- Ensure the RNA concentration is 1 µg/µL.
- If the RNA concentration is > 1 µg/µL, dilute the stock to 1 µg/µL. Aliquot 1 µL into PCR tubes and store them at -80 °C.
- If the RNA concentration is < 1 µg/µL, additional precipitation using 5 M ammonium acetate (provided in kit) can be performed as per the manufacturer’s protocol. If the RNA concentration is still < 1 µg/µL, proceed with aliquoting 1 µL into PCR tubes.
- Ensure the RNA concentration is 1 µg/µL.
2. Slide Coating
NOTE: Steps 2.1 - 2.10 should be performed 24 - 48 h prior to the anticipated cell seeding.
- Preheat the oven to 250 °C.
- Using sterile gloves, wrap each glass slide 2x with aluminum foil. Avoid touching the surface of the slide directly.
- Bake the slides in the oven for 1 h at 250 °C and allow the slides to cool to room temperature.
NOTE: This step is important for destroying any contaminating endotoxin. - While the slides are cooling, make a fibronectin stock solution of 1 mg/mL with distilled water and incubate it for 30 min at 37 °C to dissolve. Make 100-µL aliquots. Set aside the aliquots for immediate use and freeze the remaining aliquots for future use.
- Unwrap the outer covering of aluminum foil before putting the glass slide into a biosafety cabinet. Perform steps 2.6 - 2.7 and 2.9 in the biosafety cabinet.
- Place the glass slide into a sterile rectangular 4-well cell culture dish.
- Dilute fibronectin stock solution 1:100 with distilled water. Coat each slide with 1 mL of diluted fibronectin, drop by drop, using a pipette. Make sure the whole slide is covered.
- Incubate the slides in a tissue culture incubator at 37 °C for 24 - 48 h.
- After the incubation, aspirate the fibronectin by tilting the 4-well cell culture dish. Avoid touching the slide directly with the aspirator.
3. Cell Seeding onto Glass Slides
- Count the human endothelial cells at early passage (passage 2 - 5) and seed ~1.0 x 10⁶ cells onto each fibronectin-coated glass slide with 1 mL of media (1.0 x 10⁶ cells/mL media). Seed the cells 24 h prior to the anticipated application of laminar flow if no other treatment is to be performed.
NOTE: These numbers are used as a guide for experiments with 24 h of flow.- Adjust the seeding density to achieve a confluent monolayer of cells at the time of cell harvesting and RNA extraction.
- Let the cells adhere to the slide for 15 min at 37 °C.
- Add 3 mL of media in each well of the cell culture dish to cover the slide, and incubate the cells at 37 °C for 24 h with 5% CO2.
4. Small Interfering RNA (siRNA) Transfection
- Preparation of cells on glass slides for siRNA transfection and flow experiments
- Follow the protocol in steps 2 (slide coating) and 3 (cell seeding onto glass slides) for glass slide preparation and coating for flow experiments.
- Seed cells 24 h prior to siRNA treatment (48 h prior to the application of laminar flow).
- Seed human endothelial cells in antibiotic-free media at 750,000 to 1 x 10⁶ cells per slide to achieve 85% - 95% confluence the next day.
NOTE: HUVEC are used in this protocol.
- Preparation of siRNA-lipid-based transfection reagent complexes (per slide)
- Design custom siRNAs or order premade siRNAs for the desired gene of interest.
NOTE: Perform the following steps in a biosafety cabinet. - Add 6 µL of siRNA (20 µM stock) in 414 µL of reduced serum medium (see Table of Materials) and mix gently by pipetting.
- Dilute 49.5 µL of gently mixed lipid-based transfection reagent (see Table of Materials) in 130.5 µL of reduced serum medium.
- Mix gently and incubate at room temperature for 5 min.
- Combine diluted siRNAs and lipid-based transfection reagent, mix gently, and incubate for 15 min at room temperature. Mix gently to avoid disruption of the lipid-based transfection reagent complexes.
NOTE: The solution may appear cloudy as complexes form. - While complexes are forming, remove the growth medium and wash the cells 1x with reduced serum medium.
- Add 2.4 mL of reduced serum medium to each slide.
- Add 600 µL of gently mixed siRNA-lipid-based transfection reagent complexes to each plate, and rock the plate back and forth to mix. Ensure the final concentration of siRNA is 40 nM. Ensure that the slide is completely covered.
- Incubate the cells at 37 °C for 4 h.
- Add 1 mL of antibiotics-free endothelial cell growth media containing 3x the normal concentration of fetal bovine serum (FBS) without removing the transfection mixture.
- Incubate the cells at 37 °C until ready to use.
- Design custom siRNAs or order premade siRNAs for the desired gene of interest.
5. Calculation of the Flow Rate Based on the Desired Shear Stress9
- Calculate the flow rate based on the desired shear stresses according to the following equation:
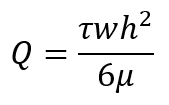
Here,
Q is the flow rate in mL/min;
τ is the desired shear stress in dynes/cm2 (1 Pa = 10 dynes/cm2);
w is the width of the parallel-plate flow chamber in cm;
h is the height of the parallel-plate flow chamber in cm;
µ is the viscosity of the media in cP (g/cm·s).
NOTE: Typical laminar shear stress experiments (non-pulsatile) in this workflow are conducted at τ = 1 Pa (10 dynes/cm2). µ can be measured using a viscometer such as a cone-and-plate viscometer and can vary depending on the contents of the media including the serum and additional dextran9. - To achieve a specific τ (shear stress), adjust the flow rate and/or viscosity. At higher flow rates, adherent cells may dissociate from the slide. Sample flow rates with typical flow chambers are shown in Table 1.
6. Set-up of a Dedicated Environment for Monitoring System and Multiple Parallel-plate Flow Chambers (Figure 2)
- Use a large heated unit/incubator with multiple shelves, internal electricity access, and glass doors—referred to as the BEACH (Built-in Environment with Adjustable CO2 and Heat)—to house multiple flow chambers simultaneously for experiments that require both shear stress and direct comparison between two or more treatments or outputs (i.e., DNA, RNA, and protein).
NOTE: The BEACH allows for frequent monitoring of the flow circuit, including the flow rate, without frequent disruption of the environment. - Ensure adequate CO2 is available for the experiment and that the CO2 monitor is functional. Ensure the water tray is appropriately filled, such that there will be humidified air.
7. Set-up of the Parallel-plate Flow Apparatus
NOTE: For the manufacturing of parallel plates, please see Lane et al.9.
- Autoclave the flow chamber plates, reservoir, dampener, tubing, and Luers for each parallel-plate flow chamber set-up as indicated in Table 2.
- Set-up of the flow loop assembly (Figure 3).
- Place sterile towels into the biological safety cabinet. Assemble the flow loop system, first without the parallel-plate flow chamber, in the biological safety cabinet.
- Connect the tubing assembly for the reservoir:
- Insert a #14 hard tube into one hole and two #14 soft tubes into the other two holes in the cap of the flow reservoir. Ensure that one of the soft tubes touches the bottom of the reservoir as outflow tubing.
- Place a 1/16” male Luer at the end of the #14 hard tube and attach a sterile filter as an air vent.
- Place a 1/16” female Luer at the end of the #14 soft inflow tube, coming from the reservoir, and attach a 4-way stopcock.
NOTE: For gene expression analysis or other studies where perfusates need not be collected, 2-way stopcocks can be used instead of 4-way stopcocks in this protocol. - Place a 1/16” male Luer at the end of the #14 soft outflow tube, coming from the reservoir.
- Connect the reservoir outflow tubing to pump tubing: place a 1/16” female Luer at each end of a #13 hard tube (pump tubing). Connect the #14 soft outflow tube from the reservoir to the #13 hard tube by connecting 1/16” male and female Luers together.
- Connect the pump tubing with ‘dampener bridge’ tubing: place a 1/8” male Luer and a 1/8” female Luer at each end of a #16 soft tube. Connect the 1/16” female Luer of the #13 hard tube (at the outflow end of the pump tubing) with the 1/8” male Luer of the #16 soft tube.
- Assemble tubing for the flow dampener: place a 3/16” male Luer at one end of the #25 soft tubing and repeat this for the other side of the flow dampener. Attach the free ends of the #25 soft tubes to each side of the flow dampener.
- Connect the ‘dampener bridge’ tubing with tubing for the flow dampener: connect a #25 soft tube from the flow dampener with the #16 soft tube of the ‘dampener bridge’ using the 1/8” female Luer from the #16 ‘dampener bridge’ side and the already placed 3/16” male Luer from the #25 soft dampener tube side.
- Assemble ‘chamber bridge’ tubing:
- Place a 1/8” female Luer and a 1/8” male Luer at each end of a #16 soft tube (‘chamber bridge’ tubing).
- Connect the 1/8” female Luer of the ‘chamber bridge’ with the 3/16” male Luer at the #25 soft tube from the free end of the flow dampener.
- At the 1/8” male Luer (free end) of the ‘chamber bridge’ tubing, place a 4-way stopcock.
- Connect the 4-way stopcock from the ‘chamber bridge’ free end to the 4-way stopcock from the reservoir inflow soft tubing (from step 7.2.2.3). Close the stopcocks.
- Add media to the reservoir and dampener. For the 48-h exposure to shear stress, add 35 mL of media to the reservoir and 25 mL to the dampener. Adjust the volume of the media based on the duration of the flow experiment and the number of cells seeded.
- Bring the assembled flow loop system to the pump in the BEACH. Place the #13 hard tube (pump tubing) into the pump head and secure it. Open the stopcocks.
- Turn on the pump and slowly increase the pump speed. Let the media circulate through the loop system. Check for any leakage or blockage (e.g., pressure build-up). Ensure that the media is flowing back to the reservoir.
- Set-up of the flow chamber assembly
- Place a 1/8” female Luer at one end of a #16 soft tube and attach a 4-way stopcock. Attach the free end of the tube to the right side of the top plate (inflow side).
- Place a 1/8” male Luer at one end of a #16 soft tube and attach a 4-way stopcock. Attach the free end of the tube to the left side of the top plate (outflow side).
- Place a 1/8” male Luer and a 1/8” female Luer at each end of a #16 soft tube (bubble trap tubing). Attach the tubing to bubble trap via the 1/8” male Luer. Attach a 4-way stopcock to the other end of the tubing via the 1/8” female Luer.
- Using sterile tweezers, transfer the cell-seeded glass slide from the 4-well cell culture dish to the recess on the bottom plate. Ensure the cell-seeded side of the glass slide is facing up.
- Using a 10-mL syringe, add 10 mL of warm media to the bottom plate within the red gasket line around the plate. Allow the media to flow through the slide and cover the cells. Avoid adding media directly onto the slide.
- Gently place the top plate onto the bottom plate, aligning from one side to the other. Avoid the introduction of air bubbles. Screw the plates together tightly.
- Remove air bubbles from the bubble trap by opening the stopcock on the right side (inflow) of the plate and gently flushing 20 mL of warm media using a 30-mL syringe. Make sure the stopcock on the left side (outflow) of the plate is closed and that the media is flowing through the bubble trap stopcock (open). Discard the flushed media.
- Close the stopcock on the bubble trap and open the stopcock on the left side (outflow) of the chamber. Elevate the left side (outflow) of the chamber to a 45° angle and gently flush 20 mL of warm media using a 30-mL syringe from the right side (inflow) of the chamber to remove air bubbles from the chamber. Bubbles can be visualized through the window. Discard the flushed media.
- Close the stopcocks on both sides of the chamber and cap. Inspect the cells by microscopy.
- Transport the chamber to the BEACH with the previously assembled loop system.
- Slowly decrease the pump speed and pause the pump. Close the stopcocks on the flow loop system to prevent leakage.
- Connect the chamber and loop system together via stopcocks. Open all the stopcocks.
- Slowly increase the pump speed and examine the set-up for any leakage or blockage. Ensure the media circulates in one direction and returns to the reservoir.
- Place the flow sensor on the ‘chamber bridge’ tubing located on the inflow side of the chamber. Make sure the sensor is oriented properly in the direction of flow.
- Adjust the pump speed to obtain the flow rate that was calculated previously, based on the desired shear stress.
NOTE: The flow rate may vary depending on the height and width of each chamber, as well as the viscosity of the media. - Turn on the CO2 tank to achieve 5% CO2 and place a water tray inside the BEACH.
8. Harvesting of the Cells and Extraction of RNA from the Flow Chamber
- Once the desired time-period of flow is complete, slowly turn down the peristaltic pump speed to 0 and turn off the power. Quickly close all the open stopcocks and remove the chamber and the attached tubing with a stopcock on each end.
- Take the chamber to a clean benchtop and gently unscrew all screws to remove the top plate. Using needle-nose tweezers, remove the glass slide from the bottom plate and place it into a 100 mm diameter tissue culture dish.
- Wash the slide with 10 mL of cold phosphate-buffered saline (PBS) -/- and check the cells under a microscope to confirm cell adherence and alignment in the direction of flow.
- Aspirate the PBS from the plate and transfer the slide to a clean 100 mm diameter dish. Add 350 µL of lysis buffer from the RNA extraction kit (see Table of Materials), containing 1/100 of beta-mercaptoethanol, to the slide.
CAUTION: Add beta-mercaptoethanol in a chemical fume hood. - Scrape the cells off the slide using a polyethylene-bladed cell scraper. Tilt the tissue culture dish, enabling the liquid to pool at the bottom, and remove the glass slide with forceps. Pipette the cell lysate into a 1.5-mL tube and keep it on ice.
- Dilute stock exogenous reference RNA (luciferase RNA) to 0.0025 ng/µL through serial dilution prior to adding it to the sample. For example, if the stock concentration is 1 µg/µL, a dilution of 1/400,000 is required to achieve 0.0025 ng/µL. Add 10 µL of diluted luciferase RNA to each sample of cell lysate for downstream RNA isolation and analysis.
- Proceed with the RNA extraction protocol as per the manufacturer’s instructions, or freeze the lysate at -80 °C until able to proceed with the extraction.
9. Calculation of the Efficiency of the RNA Extraction and cDNA Synthesis
NOTE: Calculate the luciferase efficiency after RT-qPCR by comparing the theoretical yield and the experimental yield.
- Determine the theoretical yield for luciferase RNA.
- Determine the total amount of luciferase copies added per sample. (Adding 0.025 ng/sample = 2.73 x 10⁷ copies of luciferase RNA per sample prior to RNA extraction.)
- Calculate the molecular mass of the luciferase RNA by using an average molecular mass per nucleotide of 330 g/mol and multiplying it by the length of the firefly luciferase RNA, 1652 nucleotides.
- Divide the amount of luciferase RNA added (0.025 ng) for each sample prior to RNA extraction by the molecular mass to yield the molar quantity. Then, multiply that by Avogadro’s number to yield the copies added per sample.
- Calculate the theoretical yield for the luciferase copies for each RT-qPCR reaction by using the equation:

- Calculate the experimental yield for the luciferase copies for each RT-qPCR reaction by using the luciferase plasmid to generate a standard curve for RT-qPCR.
- Calculate the luciferase efficiency (%) using the equation:

Access restricted. Please log in or start a trial to view this content.
Results
Successful linearization of luciferase plasmid using restriction enzymes was confirmed by running digested products on an agarose gel (Figure 1). The size of the linearized product was confirmed using DNA ladders and by comparison with uncut plasmid.
We have adapted the parallel-plate flow chamber set-up from Lane et al.9 for experiments that require multiple conditi...
Access restricted. Please log in or start a trial to view this content.
Discussion
Shear stress is a physiologic condition that modulates endothelial function, in part, by affecting steady-state gene expression2,5. Models of gene regulation in various shear stress conditions will contribute to a greater understanding of endothelial function. This pragmatic workflow includes a flow circuit using a parallel-plate flow chamber adapted from Lane et al.9 and represents laminar, non-pulsatile flow. The overall set-up ...
Access restricted. Please log in or start a trial to view this content.
Disclosures
The authors have nothing to disclose.
Acknowledgements
This work was supported by CIHR MOP 142307 to P.A.M. H.S.J.M. is a recipient of a Canadian Institutes of Health Research Training Program in Regenerative Medicine Fellowship. H.S.J.M., A.N.S., K.H.K., and M.K.D. are recipients of the Queen Elizabeth II Graduate Scholarships in the Science and Technology.
Access restricted. Please log in or start a trial to view this content.
Materials
| Name | Company | Catalog Number | Comments |
|---|---|---|---|
| 0.05% Trypsin-EDTA | gibco | 25300-062 | |
| 10 mL Syringe | BD | 302995 | |
| 10 mm2 Culture Dish | Sarstedt | 83.3902 | |
| 30 mL Syringe | BD | 302832 | |
| 4-Way Stopcocks | Discofix | D500 | |
| Aluminum foil | |||
| BEACH | Darwin Chambers Company | MN: HO85, SN: 4947549 | |
| Cell Scrapers | |||
| CO2 Meter | BioSphenix, Ltd. | MN: P120, SN: 0342 | |
| CO2 Sensor | BioSphenix, Ltd. | MN: C700, SN: 52852 | |
| Distilled water | gibco | 15230-170 | |
| Dulbecco's phosphate-buffered saline (DPBS) -/- | gibco | 14190-144 | |
| Endothelial Cell Growth Medium 2 | Promo Cell | C-22011 | |
| Endothelial Cell Growth Medium 2 Supplement Mix | Promo Cell | C-39216 | |
| Fibronectin (pure) | Sigma-Aldrich | 11051407001 | |
| Filter (0.20 um) | Sarstedt | 83.1826.001 | |
| Flow Dampener and Cap | U of T glass blowing shop | ||
| Flow Meter: 400 Series Console | Transonic Scisense Inc. | T402 | |
| Flow Meter: 400 Series Tubing | Transonic Scisense Inc. | TS410 | |
| Flow Reservoir and Cap | U of T glass blowing shop | ||
| Flow Sensor | Transonic Scisense Inc. | ME4PXL | |
| Isotemp 737F Oven | Fisher Scientific | FI-737F | |
| J cloth | J cloth | ||
| Microscope Slide (25 x 75 x 1 mm) | Fisherfinest | 12-544-4 | |
| Paper sterilization pouch | Cardinal Health | 92713 | |
| Pump (Masterflex L/S Economy Drive) | Cole-Parmer | 7554-90 | |
| Pump Head (Masterflex L/S Easy Load) | Cole-Parmer | 7518-00 | |
| Rectangular 4 Well Dish | Thermo Scientific | 267061 | |
| Tweezers | |||
| Name | Company | Catalog Number | Comments |
| Tubing | |||
| Masterflex C-Flex L/S 25 Soft Tubing | Cole-Parmer | 06424-25 | |
| Masterflex C-Flex L/S 14 Soft Tubing | Cole-Parmer | 06424-14 | |
| Masterflex C-Flex L/S 16 Soft Tubing | Cole-Parmer | 06424-16 | |
| Masterflex PharMed BPT L/S 13 Hard Tubing | Cole-Parmer | 06508-13 | |
| Masterflex PharMed BPT L/S 14 Hard Tubing | Cole-Parmer | 06508-14 | |
| Name | Company | Catalog Number | Comments |
| Luer | |||
| 3/16" Male Luer | Cole-Parmer | 45518-08 | For #25 tubing |
| 1/8" Male Luer | Cole-Parmer | 30800-24 | For #16 tubing |
| 1/8" Female Luer | Cole-Parmer | 30800-08 | For #16 tubing |
| 1/16" Male Luer | Cole-Parmer | 45518-00 | For #14 tubing |
| 1/16" Female Luer | Cole-Parmer | 45508-00 | For #14 tubing |
| Name | Company | Catalog Number | Comments |
| Knockdown reagents | |||
| Oligofectamine Reagent | Invitrogen | 12252-011 | |
| Opti-MEM I Reduced Serum Medium | gibco | 31985-070 | |
| Name | Company | Catalog Number | Comments |
| In vitro transcription | |||
| Generuler 1kb+ DNA ladder | Thermo Scientific | SM1331 | |
| MEGAclear Kit | Ambion | AM1908 | |
| mMESSSEGE mMACHINE SP6 Transcription Kit | Ambion | AM1340 | |
| pSP-luc+ | Promega | E4471 | |
| Supercoiled DNA Ladder | New England BioLabs Inc. | N0472S | |
| UltraPure Agarose | Invitrogen | 16500-500 | |
| UltraPure Ethidium Bromide | Invitrogen | 15585011 | |
| XhoI Restriction Enzyme | New England BioLabs Inc. | R0146S | |
| Name | Company | Catalog Number | Comments |
| RNA extraction | |||
| Beta-mercaptoethanol | Sigma | M3148-100mL | |
| RNeasy Mini Kit | Qiagen | 74104 |
References
- Aird, W. C. Endothelial cell heterogeneity. Cold Spring Harbor Perspectives in Medicine. 2 (1), (2012).
- Baeyens, N., Bandyopadhyay, C., Coon, B. G., Yun, S., Schwartz, M. A. Endothelial fluid shear stress sensing in vascular health and disease. Journal of Clinical Investigation. 126 (3), 821-828 (2016).
- Garcia-Cardena, G., Comander, J., Anderson, K. R., Blackman, B. R., Gimbrone, M. A. Biomechanical activation of vascular endothelium as a determinant of its functional phenotype. Proceedings of the National Academy of Sciences of the United States of America. 98 (8), 4478-4485 (2001).
- Cybulsky, M. I., Marsden, P. A. Effect of disturbed blood flow on endothelial cell gene expression: a role for changes in RNA processing. Arteriosclerosis, Thrombosis, and Vascular Biology. 34 (9), 1806-1808 (2014).
- Man, H. S. J., et al. Angiogenic patterning by STEEL, an endothelial-enriched long noncoding RNA. Proceedings of the National Academy of Sciences of the United States of America. 115 (10), 2401-2406 (2018).
- Won, D., et al. Relative reduction of endothelial nitric-oxide synthase expression and transcription in atherosclerosis-prone regions of the mouse aorta and in an in vitro model of disturbed flow. The American Journal of Pathology. 171 (5), 1691-1704 (2007).
- Baeyens, N., et al. Vascular remodeling is governed by a VEGFR3-dependent fluid shear stress set point. eLIFE. 4, 04645(2015).
- Davies, P. F., Civelek, M., Fang, Y., Fleming, I. The atherosusceptible endothelium: endothelial phenotypes in complex haemodynamic shear stress regions in vivo. Cardiovascular Research. 99 (2), 315-327 (2013).
- Lane, W. O., et al. Parallel-plate flow chamber and continuous flow circuit to evaluate endothelial progenitor cells under laminar flow shear stress. Journal of Visualized Experiments. (59), 3349(2012).
- Gray, K. M., Stroka, K. M. Vascular endothelial cell mechanosensing: New insights gained from biomimetic microfluidic models. Seminars in Cell and Developmental Biology. 71, 106-117 (2017).
- Bussolari, S. R., Dewey, C. F., Gimbrone, M. A. Apparatus for subjecting living cells to fluid shear stress. Review of Scientific Instruments. 53 (12), 1851-1854 (1982).
- Resnick, N., Gimbrone, M. A. Hemodynamic forces are complex regulators of endothelial gene expression. The FASEB Journal. 9 (10), 874-882 (1995).
- Malek, A. M., Alper, S. L., Izumo, S. Hemodynamic shear stress and its role in atherosclerosis. The Journal of the American Medical Association. 282 (21), 2035-2042 (1999).
- DeStefano, J. G., Xu, Z. S., Williams, A. J., Yimam, N., Searson, P. C. Effect of shear stress on iPSC-derived human brain microvascular endothelial cells (dhBMECs). Fluids and Barriers of the CNS. 14 (1), 20(2017).
- Thormar, H. G., et al. Importance of the efficiency of double-stranded DNA formation in cDNA synthesis for the imprecision of microarray expression analysis. Clinical Chemistry. 59 (4), 667-674 (2013).
- Johnston, S., Gallaher, Z., Czaja, K. Exogenous reference gene normalization for real-time reverse transcription-polymerase chain reaction analysis under dynamic endogenous transcription. Neural Regenation Research. 7 (14), 1064-1072 (2012).
- Vaughan-Shaw, P. G., et al. A simple method to overcome the inhibitory effect of heparin on DNA amplification. Cellular Oncology (Dordrecht). 38 (6), 493-495 (2015).
- Collins, C., et al. Haemodynamic and extracellular matrix cues regulate the mechanical phenotype and stiffness of aortic endothelial cells. Nature Communications. 5, 3984(2014).
- Fichtlscherer, S., et al. Circulating microRNAs in patients with coronary artery disease. Circulation Research. 107 (5), 677-684 (2010).
- Smith, R. D., Brown, B., Ikonomi, P., Schechter, A. N. Exogenous reference RNA for normalization of real-time quantitative PCR. Biotechniques. 34 (1), 88-91 (2003).
- Kohn, J. C., et al. Cooperative effects of matrix stiffness and fluid shear stress on endothelial cell behavior. Biophysical Journal. 108 (3), 471-478 (2015).
Access restricted. Please log in or start a trial to view this content.
Reprints and Permissions
