This method for the first time describes reliable experimental procedures for efficient inducible methanol-free recombinant protein production in Pichia pastoris (Komagataella phaffii), employing the carbon source regulated promoters PDCand PDF in small scale experiments while cultivation parameters can be monitored online, and a constant glycerol feed is applied.
Method Article
Methanol Independent Expression by Pichia Pastoris Employing De-repression Technologies
Opens in a new tab
In This Article
Summary
Loading...
$$\rightleftharpoonup{xx}$$
$$\longleftharp{xx}$$,
$$\longrightharp{xx}$$,
Abstract
Loading...
$$\rightleftharpoonup{xx}$$
$$\longleftharp{xx}$$,
$$\longrightharp{xx}$$,
Methanol is a well-established carbon source and inducer for efficient protein production employing Pichia pastoris (P. pastoris) as a host on micro-, lab and industrial scale. However, due to its toxicity and flammability, there is a desire to avoid methanol while maintaining the high productivity of P. pastoris. Small scale bioreactor cultivations (0.5-5 L working volume) are commonly used to evaluate a strain and its protein production characteristics since microscale cultivation in deep well plates can be hardly controlled or relies on expensive equipment. Furthermore, traditional protocols for the cultivation and induction of P. pastoris were established for constitutive expression or methanol induction and so far, no reliable protocols were described to screen P. pastoris expression strains with derepressible promoters in (controlled and monitored) parallel cultivations. To simplify such initial cultivations to characterize and compare new protein production strains, we established a simple shake flask cultivation system for methanol free expression that simulates bioreactor conditions including a constant slow glycerol feed and online monitoring, thereby coming closer to the real conditions in bioreactors compared to mostly applied small scale batch cultivations. To drive recombinant protein expression in P. pastoris, the carbon source repressed promoters PDC and PDF were applied. Polymer discs with embedded carbon source, releasing a constant amount of glycerol, assured a feed rate delivering the necessary energy for maintaining the promoters active while keeping the biomass generation low.
Introduction
Loading...
$$\rightleftharpoonup{xx}$$
$$\longleftharp{xx}$$,
$$\longrightharp{xx}$$,
Improvement in yield and reliable cultivation conditions on large scale for recombinant protein production by microorganisms such as bacteria or yeast is one of the major needs of today's biotechnology1 and the commercial success of industrial applications. Dueto simple cultivation procedures and media, high yields and well characterized tools2 Pichia pastoris (Komagataella phaffii) is a widely used non-conventional yeast for recombinant protein production. Additional innovative tools are constantly developed for this species, like new expression vectors including new promoters as alternatives to the widely used PAOX1, the promoter region of the alcohol oxidase 1 gene3,4,5. A 500 bp long DNA sequence upstream of the CAT1 (CTA1) gene was identified as the promoter region, which enables a new methanol-free and versatile expression strategy in P. pastoris. The CAT1 gene is the only catalase gene of P. pastoris and the protein is located in the peroxisomes. The catalase plays an important role in the detoxification of reactive oxygen species, which are arising, e.g., from methanol oxidation in the peroxisomal MUT pathway or during beta oxidation of fatty acids6,7. The expression of the CAT1 gene is repressed in the prescence of glucose or glycerol in the cultivation medium and derepressed upon the depletion of these carbon sources8. Moreover, the expression of the catalase gene can be induced with methanol and remarkebly also with oleic acid, seemingly being the only gene of the P. pastoris MUT pathway that can be induced with oleic acid even reaching similar expression levels as with methanol induction9.
The 500 bp fragment of this P. pastoris CAT1 promoter, which is called PDC (sometimes also abbreviated PCAT1-500), has already been tested for the production of intracellularly expressed and secreted proteins and it proved to be an attractive alternative to the two classical P. pastoris promoters – the strong constitutive PGAP and the methanol inducible PAOX1, which were developed more than 20 years ago. The PDC was able to reach 21% (CalB) and 35% (HRP) of the volumetric activities compared to the PGAP in sugar rich medium. Upon methanol induction, the PDC did not only respond faster than the PAOX1, but could also clearly outperform it by a 2.8 fold higher final titer of CalB9.
Besides the PDC, an orthologous promoter (PDF) had been identified exhibiting a similar regulation profile. However, it is significantly stronger than the PDC under derepressed as well as under methanol-induced conditions (manuscript in preparation)3.
In cases where the strong constitutive PGAP failed because of physiologically problematic or cytotoxic proteins10,11, the PDC and the PDF represent an ideal alternative. In micro scale experiments, the expression driven by these promoters starts after the depletion of the initial carbon source (e.g., glucose or glycerol), which facilitates the biomass production without burdening the cells with the overexpression of the recombinant protein right from the beginning. While both of these promoters are still inducible by methanol, the activation by derepression makes additional use of the preinduction phase compared to the expressions employing PAOX1. Moreover, the PDC and PDF can be used for methanol-free protein production, which is a desirable goal for large industrial processes12.
For the development of applicable production strains and expression constructs, several steps in the development have to be passed in order to narrow down from large numbers of transformants to the preferred candidate for scale-up. Screenings usually are performed in high throughput in multi-well plates (micro scale: less than 0.5 mL) in order to capture a range of clones as large as possible. Subsequent re-screening and re-re-screening is the next step, followed by shake flask (small scale: 50-250 mL) or (micro-) bioreactor screenings12. However, it is desireable to have a method, which is most similar between the different scales from hundreds of microlitres in deep-well plates up to several milliliters in shake flasks up to later scale-up of methanol-free production in well-controlled bioreactors. Although shake flasks can provide already similar volumes as small bioreactors, there are several limitations, which are highly relevant for large scale protein production such as constant feeding, aeration and online-monitoring13 of growth and oxygen supply. Optical monitoring employing adapted shake flasks and shaking devices provide a cost-effective alternative to more sophisticated equipment for parallel cultivation while still providing constant online information about major culture parameters such as biomass and dissolved oxygen concentration. Slow release of carbon source from polymer carriers can be applied to secure a constant and controlled feed without relying on complex technical solutions and devices, simulating more similar conditions of bioreactors than the previously applied simple full depletion of carbon source9,10, where energy for ongoing protein expression becomes limiting.
The following method describes a small to medium scale methanol-free controllable protein expression system in P. pastoris based on the new promoters PDC and PDF. Induction by derepression involves two phases. A first short phase of biomass accumulation without the production of the protein of interest, using a carbon source that represses the promoters and a second phase of target protein production, where a carbon source is supplied in small but constant concentrations maintaining the promoter derepressed. Online monitoring of most critical cultivation parameters is applied during the whole cultivation period. The goal was to provide a methanol free, reliable and scalable cultivation system for P. pastoris.
Protocol
Loading...
$$\rightleftharpoonup{xx}$$
$$\longleftharp{xx}$$,
$$\longrightharp{xx}$$,
1. Media Preparation
- Buffered minimal media (BMG with glycerol, BMD with dextrose as carbon source) preparation (1 L)
- Autoclave 650 mL of distilled water in a 1 L screw cap glass bottle. After cooling down, complete the medium by adding 100 mL of autoclaved 10x YNB (134 g/L yeast nitrogen base w/o amino acids), 200 mL of potassium phosphate buffer (1 M, pH 6), 30-100 mL of 10% w/v glucose or glycerol (depending on the desired generated biomass amount during the batch), 2 mL of sterile 500x Biotin (10 mg/mL) solution and fill up to 1 L with sterile distilled water.
Note: All ingredients have to be autoclaved in separate flasks. Biotin is destroyed when autoclaved, and therefore has to be filter sterilized with 0.2 µm membrane filters.
- Autoclave 650 mL of distilled water in a 1 L screw cap glass bottle. After cooling down, complete the medium by adding 100 mL of autoclaved 10x YNB (134 g/L yeast nitrogen base w/o amino acids), 200 mL of potassium phosphate buffer (1 M, pH 6), 30-100 mL of 10% w/v glucose or glycerol (depending on the desired generated biomass amount during the batch), 2 mL of sterile 500x Biotin (10 mg/mL) solution and fill up to 1 L with sterile distilled water.
- Buffered rich media (BYPG) (1 L)
- Autoclave 700 mL of distilled water with 1% w/v yeast extract and 2% w/v peptone in a 1 L screw cap bottle. After cooling down, add 30-100 mL of the separately autoclaved 10% w/v glycerol, 200 mL of potassium phosphate buffer (1 M, pH 6) and fill up to 1 L with sterile distilled water.
2. Shake Flasks Preparation
- Add 5 mL of distilled water in the 250 mL baffled shake flasks, cover it with two layers of cotton cloth and fix it in place with rubber bands. Cover the cloth with a piece of aluminum foil.
- Autoclave the flasks at 121 °C for 20 min for full sterilization.
- Remove residual water from the flask and aliquot 50 mL of the previously prepared media to each flask.
3. Overnight Culture Inoculation
- Start an overnight culture (ONC) with a single fresh colony of the desired expression strain in 5 mL of YPD (1% w/v yeast extract, 2% w/v peptone, 2% w/v glucose) in a 50 mL centrifuge tube while leaving the lid slightly open to allow proper aeration.
- Let it grow over night at 28 °C, 80% humidity, in a shaker at 100-130 rpm (2.5 cm shaking diameter).
4. Measurement Setup and Main Culture Cultivation
- For setting up the online monitoring system, follow the manufacturer’s instructions for appropriate calibration of the devices.
- Place a computer, where the appropriate software for monitoring is installed in range for a Bluetooth connection to the measurement stations. Start the software to connect the devices via Bluetooth.
- Turn on the Bluetooth connection on the biomass measuring device by pressing the silver button on the front.
- In the software, click Devices then Find Devices.
Note: The devices should appear as a list in the window below the task line. If they do not, it is advisable to check if the batteries are charged and the computer is within reach for a Bluetooth connection. - Drag and drop the found devices to the squares on the right side of the screen Measurement Tray.
- Click Connect.
Note: When the connection was successful, a control screen appears. - To start a test run for the Bluetooth connection, click Measurement.
- Set up the experiment.
- Click Start Measurement, name the experiment and enable all parameters needed to monitor.
Note: Licenses are needed for each of the possible measured parameters. - Set Interval to 3 min.
Note: The interval determines how often measurement points are taken and every measurement point results in a value afterwards. Measuring every minute is very accurate, but lots of data are generated which makes it more laborious to evaluate. - Set Average Measurement Points to 11.
Note: This setting determines how many measurement points are actually taken every 3 min. Therefore, the output is the mean value of 11 measurement points over 11 s. - Enter the names for the samples.
- Skip the next screen, as the angle was already calibrated before (Step 4.1).
Note: A test run for the Bluetooth connection before inoculating the main cultures is advised to ensure stable connections and appropriate location of the connected computer. Also, the batteries have to be charged.
- Click Start Measurement, name the experiment and enable all parameters needed to monitor.
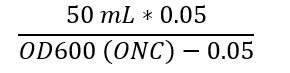
- Measure the cell density of the ONC (Step 3.1) diluted in cultivation media (1:20) in a spectrophotometer at 600 nm wavelength. Inoculate 50 mL of the medium (recommended carbon source concentration 0.3-1%, different media possible as described in Step 1.) with the ONC to an OD600 of 0.05 by using the following calculation.
- Place the flasks in the detectors and shake at 28 °C, 130 rpm and 80% humidity.
Note: It is very important to give the culture 5 min of shaking before starting the measurement to avoid cells sticking to the bottom of the flask and yielding wrong values. - Click Start Measurement in the software.
- Take 0.2 mL samples for cell density measurement 4 h after the inoculation and when the carbon source gets depleted (determination described in step 4.7) in triplicates. Dilute the samples appropriately in cultivation media (first measurement 1:5, second measurement 1:20) and measure the absorption at 600 nm wavelength in a spectrophotometer. Before removing the flasks and even before stopping the shaker, always pause the measurement in the software.
Note: The detectors are calibrated for recording the parameters under defined shaking conditions and will yield to nonsense measurements when recording still cultures. Also, make sure to always wait 5 min of shaking before starting the measurement again. The cell density measurements are essential because the detector is delivering just values for the biomass and not real cell density. A calibration function between the OD600 values (x values) and the values obtained by the online measurement system (y values) can be achieved by measuring several timepoints spectrophotometrically. The values are not in a linear but in a logarithmic relation according to the following calibration function:

y: OD600 values obtained by spectrophotometer
x: values obtained by online measurement system
k: slope
d: axis intercept
The slope and the axis intercept can then be used to convert any value into the corresponding OD600 value. In Excel one can plot the spectrophotometrically obtained OD600 values against the values from the online system from the same timepoint. The addition of a logarithmic trendline and the corresponding equation will give the calibration function shown above. - Cultivate until the carbon source is nearly depleted (app. 12-20 h). For that purpose, let the cultures grow until it can be seen in the software diagrams that the oxygen concentration is approaching zero and the cells are in the exponential growth phase.
Note: This is the case for carbon source concentrations used in this protocol. The timepoint of carbon source depletion can be determined with the online monitoring system as it is shown exemplarily in Figure 1 in the Representative Results section, when the oxygen level approaches zero and the cells are in the exponential growth phase.
5. Protein Expression by De-repression
- When the timepoint described in Step 4.6 is reached, start feeding the cultures by the addition of four feed discs per flask under sterile conditions.
Note: Under the described conditions, four glycerol feed discs release 2 mg/h glycerol according to the manufacturer. - Continue the cultivation for 60-90 h while taking samples every 24 h to monitor the protein expression by an assay of choice (e.g., Bradford assay15, SDS PAGE16 or activity assays) and cell density measurements.
6. Culture Harvesting
- After the 60-90 h of cultivation, fill the cultures in 50 mL centrifuge tubes for harvesting by centrifugation at 4,000 x g, 4 °C for 10 min.
Note: The supernatant (for secreted proteins) or the cells (for intracellular protein expression) can be harvested by centrifugation at 4,000 x g, 4 °C for 10 min and further analyses can be done. - Export the online measurement data as a spreadsheet file from the software for further analysis.
- Fill 5-10 mL of distilled water to all the flasks and autoclave to inactivate the remaining cells.
Results
Loading...
$$\rightleftharpoonup{xx}$$
$$\longleftharp{xx}$$,
$$\longrightharp{xx}$$,
As described in the protocol section, the software records the important cultivation parameters over the whole cultivation. Figure 1 shows the visualization of biomass development and oxygen concentration during a cultivation started with either 0.5 % (Figure 1A) or 0.3 % (Figure 1B) carbon source in the batch followed by the addition of glycerol feed discs. The online monitoring system is especially useful for the de-repressed cultivations as the timepoint of carbon source depletion after the batch can be determined exactly. As it can be seen in Figure 1, the oxygen concentration in the medium is decreasing rapidly and approaching zero, especially for 0.5 % glycerol in the batch (Figure 1A) while the biomass is increasing exponentially at this point. Here, the cells are in the exponential growth phase and in order to make optimal use of the carbon source release, shortly before the culture reaches the stationary phase, the feed discs should be added as it is described in the protocol. The addition of the feed discs before the oxygen concentration reaches zero is important for de-repressed protein expression to prevent the cells from oxygen limitation. Lower glycerol concentrations reduce the effect of short-term oxygen limitations as it can be seen in Figure 1B and are therefore recommended for de-repressed protein expression.
In the following, the results of two different cultivation experiments – employing the described protocol and the monitoring system shown in Figure 1 – are described. In the first experiment, a P. pastoris strain producing the glucose oxidase from Aspergillus niger (A. niger) under the control of the PDC and in the second a P. pastoris strain producing the human growth hormone under control of the PDF is shown.
In this experiment, glucose oxidase production under the control of PDC was investigated. Therefore, different cultivation strategies were compared: glycerol pulsing, constant glycerol feed by addition of feed discs and cultivation without any feed or pulsing. The cultivation was done in 50 mL buffered minimal media with 0.5% glucose as sole carbon source in 250 mL shake flasks (Table 1).
Upon 160 h cultivation, the highest biomass concentrations were obtained, when a feeding strategy using a glucose batch for biomass production (38 h) and glycerol pulsing (0.25% w/v glycerol after 38 h, 61 h and 86 h cultivation) was employed (0.21 g/L total secretory protein, 8.4 U/mL). Although a 2-fold reduction of the biomass concentration and the total amount of secreted protein were obtained, when the feed disks were added after 38 h glucose batch, the volumetric activity was even 1 U/mL higher compared to the cultivation using glycerol pulsing. This indicates that a substantial amount of secreted protein does not contribute to the volumetric activity in the supernatant and may be secreted in an inactive form. Therefore, higher glycerol concentrations from glycerol pulses seemingly favor the formation of biomass instead of target protein production and constant low glycerol release led to more than two-fold higher specific productivity.
Another experiment employing the de-repressed expression method was done by expressing the human growth hormone (hGH) under control of PDF. The construct was stably integrated into the genome of P. pastoris strain BSYBG11. Here, 50 mL of BYPG, buffered rich medium, in 250 mL baffled shake flasks was used with 0.3% (w/v) glycerol as carbon source in the batch. Upon glycerol depletion, the protein expression with constant glycerol feed was ensured by the addition of 4 feed discs per flask and compared to no glycerol feed (Figure 2).
Figure 2 shows the comparison between hGH expression and biomass development of the same strain cultivated with and without constant glycerol feed. As assay sandwich ELISA was used with the secondary antibody fused to HRP and detection was carried out with 3,3′,5,5′-tetramethylbenzidine (TMB) as substrate. Especially for this protein, it seemed to be the case that without any feeding, the cells start to degrade the produced protein after approximately 30 h (light blue squares), whereas by feeding, this degradation could be prevented (dark blue triangles) and even the protein concentration per biomass still increased after 150 h of cultivation. As already observed for Hansenula polymorpha14, this result shows how switching from batch, like it is usually used in shake flask scale, to fed-batch mode can optimize P. pastoris cultivations.
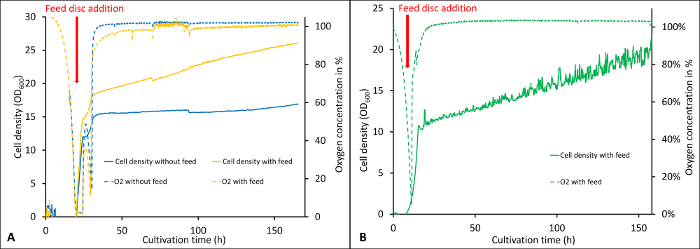
Figure 1: Visualization of online recorded parameters during two cultivations with different glycerol concentrations in the batch. The cultivations were started with 0.5% w/v (A) and 0.3% w/v (B) glycerol in the batch followed by the de-repression phase where the cells were fed by applying 4 feed discs per flask (release rate of 0.5 mg/h/disc according to the manufacturer). The dashed lines show the oxygen concentration in the medium, whereas the continuous lines show the cell density (OD600). Error bars show the standard deviation of six replicates (2 biological, three technical each). Please click here to view a larger version of this figure.
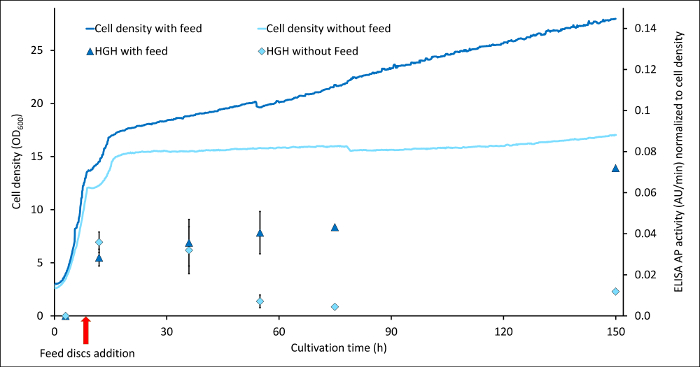
Figure 2: Comparison of human growth hormone (hGH) expression in batch and fed-batch mode. hGH content is indicated by absorption values at 405 nm by an ELISA where the 2nd antibody was an HRP fusion and TMB was used as a substrate for detection. Shown are the results for two different cultures: light blue line and squares display the cell density and hGH concentration normalized by the cell densities of a culture without any feed after the batch, compared to a culture, where the glycerol feed discs were applied (dark blue lines and triangles). Error bars show the standard deviation of six replicates (2 biological, three technical each). Please click here to view a larger version of this figure.
| PDC-GOX at 160 h cultivation time | OD600 | vol. activity [U/mL] | total amount of secreted protein [mg/mL] | volumetric activity per cell density | |||
| Mean | SD | Mean | SD | Mean | SD | Mean | |
| BMD1% batch + glycerol pulsing | 74.6 | 2 | 8.4 | 2.4 | 0.21 | 0.01 | 0.11 |
| BMD1% batch + constant glycerol feed | 32.5 | 0.3 | 9.4 | 0.7 | 0.09 | 0.01 | 0.29 |
| BMD1% batch | 18.8 | 0.6 | 3.7 | 0.7 | 0.01 | 0 | 0.2 |
Table 1: Results of methanol independent GOX expression under the control of the de-repressed promoter PDC.
Discussion
Loading...
$$\rightleftharpoonup{xx}$$
$$\longleftharp{xx}$$,
$$\longrightharp{xx}$$,
This method presents a reliable protocol for efficient methanol independent inducible expression by P. pastoris as an alternative to classical methanol induced protein expression driven by PAOX112. De-repressible promoters, like the PDC, the PDF or previously described mutated PAOX1 variants17, build the molecular basis for this new protein production concept. The shown representative results underline the usefulness and practicability of recombinant protein expression in P. pastoris by de-repressed promoters and small-scale screening with simple online monitoring. On the one hand, the harmful and toxic methanol that is usually used for the induction of the AOX1 promoter can be eliminated from the cultivation. On the other hand, the growth and the protein production phase are uncoupled9 in contrast to constitutive protein expression, e.g., with the commonly used PGAP. This is especially beneficial when the cells should express toxic or harmful proteins that display a burden for them.
The possibility to start the cultivations with different carbon source concentrations enables the decision of how much biomass one would like to gain before the protein production phase starts. When choosing a lower carbon source concentration in the batch, oxygen transfer limitations due to too high cell densities can be reduced while on the other hand higher cell densities can also result in higher protein titers. By monitoring the culture development in terms of biomass generation and oxygen concentrations, the optimal time-point for fed-batch initiation can be determined easily as it is shown in Figure 1.
For online monitoring of these cultivation parameters, an appropriate measurement system should be applied. The biomass measuring device (e.g., SFR Vario) is a simple and economic online measurement system for culture monitoring in shake flasks. The optoelectronic reader determines cell growth in the flask via scattered light detection and reads out the signal of the oxygen sensor integrated in the flask. The optics for biomass measurement consist of an LED that emits a light signal, which is scattered by particles (cells) in the culture broth and detected with a photodiode. The optical sensors emit fluorescence when excited with light of a certain wavelength. Depending on the amount of analyte molecules present, this fluorescence signal changes, which is detected by the reader optics and translated into concentration values. However, a cell density measurement calibration has to be established beforehand, since the measurement system is not measuring actual OD600 values. The oxygen uptake rate can be calculated from the slope of the oxygen curve with the reader software, and the temperature as well as rpm are recorded continuously together with the other parameters. To enable monitoring with this system, the shake flasks have to be previously equipped with the appropriate sensors for the desired parameters.
By the addition of four slow-release polymer discs providing a constant amount of glycerol to the culture broth, biomass accumulation is nearly stopped, and recombinant protein production is continued. The determination of the feed disc addition time point is not a critical step in this experiment, but it should be considered that a premature feed start before the exponential growth phase could be inhibiting the promoter activation as the expression starts upon carbon source depletion. Additionally, the total feeding time due to polymer capacity limitations may be reduced, whereas delaying the feed after the cells have reached the stationary phase might lead to starving and degradation of already produced protein. The amount of feed discs used in this protocol was determined experimentally for the optimal carbon source release to keep the promoter de-repressed while holding biomass generation low (data not shown). In this manner, the cultivations can be performed easily over 160-180 h without any intervention.
Main applications of this new protocol will be in expression clone screening, enzyme evolution and the discovery, the characterization and engineering of new promoters employing a methanol-free cultivation protocol in well-monitored conditions. In principle, the same protocol should be applicable for mixed-feed strategies employing methanol and limited fermentative carbon source feeds such as described by Panula-Perälä et al. in 201418.
Disclosures
Loading...
$$\rightleftharpoonup{xx}$$
$$\longleftharp{xx}$$,
$$\longrightharp{xx}$$,
Although the presented protocol is generally applicable for cultivation and induction under derepressed conditions, bisy e.U. declares to have an interest in commercialization of the new derepressed promoters used in this study.
Acknowledgements
Loading...
$$\rightleftharpoonup{xx}$$
$$\longleftharp{xx}$$,
$$\longrightharp{xx}$$,
ROBOX has received funding from the European Union (EU) project ROBOX (grant agreement n° 635734) under EU's Horizon 2020 Programme Research and Innovation actions H2020-LEIT BIO-2014-1. The views and opinions expressed herein are only those of the author(s), and do not necessarily reflect those of the European Union Research Agency. The European Union is not liable for any use that may be made of the information contained herein.
The PhD thesis of J. Fischer is co-financed by a grant for "Industrienahe Dissertation" of the Austrian Funding agency FFG.
We thank Gernot John (PreSens GmbH) for the helpful discussions and valuable input for the manuscript draft.
Materials
| Name | Company | Catalog Number | Comments |
|---|---|---|---|
| Bacto Yeast Extract | BD Biosciences | 212720 | |
| Baffled Flask 250 mL | DWK Life Science | 212833655 | |
| BBL Phytone Peptone | BD Biosciences | 298147 | |
| BioPhotometer | Eppendorf AG | 5500-200-10 | |
| Certoclav-EL | CertoClav GmbH | 9.842 014 | |
| Difco Yeast nitrogen base w/o amino acids | BD Biosciences | 291920 | |
| Feed discs glycerol | Adolf Kuhner AG | 315060 | |
| Glucose-monohydrate | Carl Roth GmbH + Co. KG | 6887 | |
| Glycerol ≥98 % | Carl Roth GmbH + Co. KG | 3783 | |
| K2HPO4 | Carl Roth GmbH + Co. KG | 6875 | |
| KH2PO4 | Carl Roth GmbH + Co. KG | 3904 | |
| Multitron Standard | Infors AG | 444-4226 | |
| SFR Vario v2 | PreSens GmbH | 200001689 |
References
Loading...
$$\rightleftharpoonup{xx}$$
$$\longleftharp{xx}$$,
$$\longrightharp{xx}$$,
- Bill, R. M. Playing catch-up with escherichia coli: Using yeast to increase success rates in recombinant protein production experiments. Frontiers in Microbiology. 5 (MAR), 1-5 (2005).
- Cregg, J. M., Cereghino, J. L., Shi, J., Higgins, D. R. Recombinant Protein Expression in Pichia pastoris). Molecular Biotechnology. 16, 23-52 (2000).
- Weinhandl, K., Winkler, M., Glieder, A., Camattari, A. Carbon source dependent promoters in yeasts. Microbial Cell Factories. 13, 5(2014).
- Vogl, T., Kickenweiz, T., Sturmberger, L., Glieder, A. Bidirectional Promoter. US patent. , 20150011407 (2005).
- Vogl, T., Glieder, A. Regulation of Pichia pastoris promoters and its consequences for protein production. New Biotechnology. 30 (4), 385-404 (2013).
- Rußmayer, H., et al. Systems-level organization of yeast methylotrophic lifestyle. BMC Biology. 13 (1), 80(2015).
- Sakai, Y., Yurimoto, H., Matsuo, H., Kato, N. Regulation of peroxisomal proteins and organelle proliferation by multiple carbon sources in the methylotrophic yeast, Candida boidinii. Yeast. 14 (13), 1175-1187 (1998).
- Hartner, F. S., Glieder, A. Regulation of methanol utilisation pathway genes in yeasts. Microbial Cell Factories. 5, 39(2006).
- Vogl, T., et al. A Toolbox of Diverse Promoters Related to Methanol Utilization: Functionally Verified Parts for Heterologous Pathway Expression in Pichia pastoris. ACS Synthetic Biology. 5 (2), 172-186 (2016).
- Mellitzer, A., Weis, R., Glieder, A., Flicker, K. Expression of lignocellulolytic enzymes in Pichia pastoris. Microbial Cell Factories. 11 (1), 61(2012).
- Macauley-Patrick, S., Fazenda, M. L., McNeil, B., Harvey, L. M. Heterologous protein production using the Pichia pastoris expression system. Yeast. 22 (4), 249-270 (2005).
- Weis, R., Luiten, R., Skranc, W., Schwab, H., Wubbolts, M., Glieder, A. Reliable high-throughput screening with Pichia pastoris by limiting yeast cell death phenomena. FEMS Yeast Research. 5 (2), 179-189 (2004).
- Ukkonen, K. Improvement of Recombinant Protein Production in Shaken Cultures. , Acta University Oulu C 480 (2014).
- Jeude, M., et al. Fed-batch mode in shake flasks by slow-release technique. Biotechnology and Bioengineering. 95, 433-445 (2006).
- Bradford, M. M. A rapid and sensitive method for the quantitation of microgram quantities of protein utilizing the principle of protein-dye binding. Analytical Biochemistry. 72, 248-254 (1976).
- Smith, B. J. SDS Polyacrylamide Gel Electrophoresis of Proteins. Methods in molecular biology. 1, 41-55 (1984).
- Hartner, F. S., et al. Promoter Library Designed for Fine-Tuned Gene Expression in Pichia Pastoris. Nucleic Acids Research. 36 (12), e76(2008).
- Panula-Perälä, J., Vasala, A., Karhunen, J., Ojamo, H., Neubauer, P., Mursula, A. Small-scale slow glucose feed cultivation of Pichia pastoris without repression of AOX1 promoter: towards high throughput cultivations. Bioprocess and Biosystems Engineering. 37 (7), 1261-1269 (2014).
Reprints and Permissions
Request permission to reuse the text or figures of this JoVE article
Request Permission