Measuring alterations in metabolic rates is central to understanding the progression of various diseases and aging. Here, we present a novel technique to measure whole head oxygen consumption that more closely resembles the physiological state and may aid in revealing novel drugs that modify mitochondrial activity.
Method Article
Measuring and Interpreting Oxygen Consumption Rates in Whole Fly Head Segments
In This Article
Summary
Abstract
Regulated metabolic activity is essential for the normal functioning of living cells. Indeed, altered metabolic activity is causally linked with the progression of cancer, diabetes, neurodegeneration, and aging to name a few. For instance, changes in mitochondrial activity, the cell's metabolic powerhouse, have been characterized in many such diseases. Generally, the oxygen consumption rates of mitochondria were considered a reliable readout of mitochondrial activity and measurements in some of these studies were based on isolated mitochondria or cells. However, such conditions may not represent the complexity of a whole tissue. Recently, we have developed a novel method that enables the dynamic measurement of oxygen consumption rates from whole isolated fly heads. By utilizing this method, we have recorded lower oxygen consumption rates of the whole head segment in young versus aged flies. Secondly, we have discovered that lysine deacetylase inhibitors rapidly alter the oxygen consumption in the whole head. Our novel technique may therefore aid in uncovering new properties of various drugs, which may impact metabolic rates. Furthermore, our method may give a better understanding of metabolic behavior in an experimental setup that more closely resembles physiological states.
Introduction
Regulated metabolic activity is essential for the survival of cells and healthy function of a tissue. Deregulated metabolic activity has been extensively shown to be linked to the onset and progression of various maladies1. For example, lower metabolic activity was previously described in neurodegenerative diseases such as Alzheimer's and age-associated memory impairment2,3. Furthermore, mitochondrial dysfunction is believed to be causally involved in the aging process4,5. On the other hand, higher mitochondrial and metabolic rates were described in cancer cells6, where the use of mitochondrial inhibitors reduced tumorigenesis7.
One readout of metabolic activity is the oxygen consumption rate (OCR) of mitochondria. Interestingly, this type of readout is primarily obtained from isolated mitochondria or cells, thus the majority of what is described in the literature is mainly based on a readout that does not resemble the physiological state. However, there are several drawbacks to this technique. First, the protocol of mitochondrial isolation can potentially damage its integrity8, which may be a relevant artefact when comparing mitochondria isolated from young versus older tissues9. Furthermore, the isolation process is long and may result in loss of relevant protein posttranslational modifications which regulate mitochondrial function9,10,11. Moreover, it has been shown that isolated mitochondria do not consistently represent whole tissue metabolic rates12,13. Such cellular biological complexity could be viewed as, 'the whole is greater than the sum of its parts', i.e., mitochondria may display different metabolic rates inside a complex cell compared with their metabolic rate when isolated.
While cells may offer a better OCR readout than isolated mitochondria, cell to cell communication in the context of a whole tissue may be lost. For example, in the brain, the metabolic activity of neurons is highly dependent on the metabolic activity of neighboring glial cells14. As such, establishing new techniques to investigate OCR in whole tissue or whole organisms may prove more insightful for the onset and progression of various disorders.
Recently, new techniques have emerged to address these issues and enable the measurement of OCR from whole tissue, segment, or living organisms. For example, a recent work reported the oxygen measurement from a beetle flight muscle by using a permeabilized fiber approach with a respirometer15. New machines for micro-respirometry allow the measurement of OCR of pancreatic islets16,17. Consequently, it has been reported that this technology enables the measurement of OCR from whole worms18 and Zebra fish19. However, the presence of the digestive barrier may pose a challenge for testing various drugs in the context of OCR alterations. Interestingly, recent reports by Neville and colleagues have shown a new technique for measuring single drosophila larva brain with the well plate20,21.
In this study, we have used a similar setup to enable the measurement of whole OCR from whole living and non-mobile Drosophila22. This technique also offers a secondary advantage in measuring the impact of various drugs on metabolic activity in a whole segment, without having to pass through the digestive system barrier13,22. For example, it was previously demonstrated that direct injection of lysine deacetylase inhibitor (KDACi), a drug believed to alter epigenetic mechanism in the brain, resulted in an improved memories formation23. However, by using our novel technique, we discovered that KDAC inhibition resulted in a rapid increase of OCR, which may be a contributing factor by itself in the neuronal activity. Our protocol provides a simple and novel method to assess the impact of various drugs, genetic manipulation, or physiological states (disease, aging) on OCR in the context of a whole head.
Protocol
1. Instrument Preparation
Note: For this experiment, we have used a Seahorse XF24 device with “islet plates”. The operation of the technique uses different cycles of mixing, waiting and measurements as well as the possibility to add substances to the measurement compartment.
- Turn on the machine well before the start of the experiment so that there is adequate time to reach the desired temperature and remain stable.
- In the software setup (administration mode), choose the length of the cartridge calibration (here, 20 min was chosen) and the desired temperature.
Note: While mitochondria or mammalian tissue measurements are typically carried out at 37 °C, fly head ambient temperature is 25 °C but results of measurements at 31 °C are published. We used 31 °C since this is the lowest temperature setting for the device at room temperature. To reach temperatures of 25 °C or lower, place the machine in a colder room or at 11 °C as recently published21. - In the software, use the following protocol: 3 min mixing – 2 min waiting – 2 min measuring. Depending on the experimental design, add injection steps from ports A-D after a chosen measurement step.
- For quality check, and determination of basal OCR, wait for at least three measurement cycles before injecting the first drug via port A. For a detailed timeline of the protocol, please see reference Becker et al.13.
2. Cartridge Preparation
- Pre-calibrate the cartridge a day (or at least 4 h) prior to testing. Add 1.0 mL of Calibrant (pH 7.4) to each well and place the sensor cartridge on top of the plate and store at 37 °C without CO2 for overnight or up to 72 h. Prevent the evaporation of cartridge with parafilm if it is being hydrated for more than 24 h.
- Ensure that the experimental drugs are well dissolved in the medium (fresh medium + 2.5% glucose) before the start of the experiment.
- Measure and adjust the pH of the drug solution to the pH of the vehicle at the desired temperature to avoid any pH difference during drug injection.
- Pipet the drug solution to its allocated injection port. For example, use 77 μL for port A to achieve a 1:10 dilution in a 770 μL solution and subsequently 85 μL for port B.
- Load the cartridge into the machine and begin calibration.
3. Plate Preparation
Note: It is strongly recommended that two people prepare the plate simultaneously. The duration of one plate preparation per two people may require ~45-60 minutes.
- Adjust the freshly prepared media + 2.5% glucose to the desired pH with 1 N HCl. Make sure that the pH is not affected by changes in temperature.
- Prepare an ice box and place a metal plate on the ice.
- Open the islet plate (the 24-well plate) package and immerse the nets in a Petri dish (92 mm x 16 mm) with media.
- Collect one net with the inserter (a small instrument that places the net firmly in the well) and have the inserter stand up next to the microscope. Add a small drop of media to the net attached to the inserter.
- Anesthetize the flies (one week or 4 weeks old canton males were used here) by placing the flies on the ice-cold metal plate.
- Using forceps, grab the abdomen of a fly and immerse it in the media in a Petri dish under the microscope.
- Using a second pair of forceps, gently remove the head of the fly. Place it in the middle of the net attached to the inserter and verify that the head is immersed in media.
- Center the heads when there are 16 of them on the net. Remove superfluous fluid before centering the heads to prevent loss of heads while placing them in the well.
Note: 16 fly heads were used as this number gave sufficient and stable data within a reasonable time of plate preparation during method establishment. - Using the inserter, place the net in the well. Ensure that the heads are trapped under the net. Slowly add 700 μL of media + 2.5% glucose (Figure 1). Repeat the process for each of the wells.
Note: 20 wells of fly head samples and 4 empty wells for background calibration per plate is recommended. Make sure that empty wells also contain a net with 700 μL of the buffer + 2.5% glucose. - Check the wells for air bubbles under the nets via the microscope. Pipet gently up and down using a 1 mL pipet to remove any bubbles. Keep the heads centered for a reliable OCR reading.
- Add the plate to the machine and start the measurement.
4. Analysis of the OCR Measurements
- At the end of the protocol, remove the cartridge.
- As a quality check, observe any visible leftovers in the port fillings. Discard the cartridge and plate (Option 1) if the heads are not to be used for protein extraction, e.g., (see Option 2).
- Extract the spreadsheet files and quality check each well for oxygen and pH levels. Make sure that the background wells show no OCR and that oxygen levels are stable.
- Use an algorithm for data analysis, some of which can be chosen in the respective software. Use the AKOS algorithm for OCR values2 if the range of oxygen levels during the entire measurement, between the first and last tick (= sub-measurement) are similar between two biological samples and the oxygen levels of the last ticks are not lower than 95 (mmHg) (the heads’ OCR is markedly lower at this oxygen level), (Figure 2).
- Some conditions will cause the sample to generate a rapid OCR and may display lower oxygen levels during the 1st tick and/or in the last tick (anoxia) (Figure 3A). In such a scenario, use an alternate measurement method such as the FIXED algorithm. In anoxia, the OCR is greatly reduced due to low levels of oxygen in the solution. As such, the AKOS algorithm yields misleading readings.
Note: The newer machine lacks the FIXED algorithm. Therefore, it is preferred to extract the total oxygen levels and plot the rate per time for the first 3-5 ticks (Figure 3).
5. (Option 2) Biochemical Analysis of the Head Segment
- To measure the biochemical (metabolites, proteome, etc.) properties of a head segment, adjust the run time to the requirement; however, it is possible to abort the protocol at any time and remove the plate.
- Once the plate is removed, use non-sharpened forceps to make a hole in the net and remove it thereby releasing the heads to float.
- Using a 1 mL pipet with a cut tip and transfer the heads to a vial.
- Quickly discard the buffer and snap-freeze the heads in liquid nitrogen. Store the heads at -80 °C for future analysis.
Results
The ability to record high quality OCR measurement relies on centering the head in the middle of the net (Figure 1). This is important for the XF24 machine, which has a rather small oxygen sensor spot compared to the newer XFe24 machine in which the sensor is larger. As previously shown, centering the heads display a steady OCR for at least 20 consecutive measurements in young flies13.
One critical aspect of using the machines is to apply the correct analysis. It is recommended to check the oxygen levels during the experiments. Each 2 min measurement is subdivided into 10 sub-measurements (ticks). A well with 16 healthy heads usually displays an oxygen partial pressure (pO2) of 140-170 (mmHg) for the first tick. In the first example, we compared young vs. midlife fly heads (Figure 2A and 2B). While the oxygen levels drop quicker in the middle-aged heads, the observed difference is small (Figure 2A). Moreover, the range of the oxygen levels is similar between the conditions, with 165 during the first tick to 120 during the last tick. In such a case, it is preferable to use the AKOS algorithm to automatically generate the OCR (pmol/min)2, which reliably mirrors the oxygen level drop between young versus midlife heads (Figure 2B). Of note, the analysis program by the machine automatically chooses the AKOS algorithm.
However, based on our observations, automatically using the AKOS algorithm may give misleading, if not opposite results for the correct OCR. Such artefacts can be generated in conditions of a highly consuming sample which reaches anoxia13,22. For example, the addition of sodium butyrate (SB), a KDAC inhibitor, transiently changes the dynamics of the oxygen levels (Figure 3A). Whereas the vehicle controls display steady levels of oxygen during the first and last ticks, SB addition causes a considerable and transient drop of the oxygen levels in these ticks (Figure 3A). SB by itself does not alter the oxygen levels in the background wells, where no heads are added (data not shown). The data supports the notion that SB increases oxygen consumption. As the collection of first tick is delayed (12 seconds until the first tick is recorded in the measuring phase) the first data point is already lower in the SB treated wells. Therefore, it is difficult to capture the early changes in oxygen consumption following the addition of this HDAC inhibitor. Furthermore, the oxygen levels in the SB treated samples are reduced to already low levels (anoxia) as indicated by the collection of the last ticks. At anoxia, the heads slow down their oxygen consumption in the last ticks (Figure 3A). Because the AKOS calculation takes into account all ticks and ignores an anoxic state, it generates a misleading OCR. Indeed, the non-normalized AKOS based OCR levels show little change upon the injection (dashed line) of port A (Veh/SB) (Figure 3B).
Normalizing the OCR levels to the pre-injection measurement based on the AKOS reveals very similar levels of OCR before and after the injection of port A, which does not support the oxygen level changes (Figure 3A). Under these circumstances, the FIXED algorithm, which more closely models/resembles the OCR and oxygen level changes is recommended (Figure 3C). Consequently, the FIXED algorithm based normalized measurement reveals an increased OCR upon SB treatment (Figure 3C).
A drawback with the new machine is the absence of the FIXED algorithm. Therefore, in experiments where highly consuming sample/treatment is used, it is recommended to calculate the OCR measurements manually, and calculating the decrease in oxygen level per time for the first 3-5 ticks in each measurement.
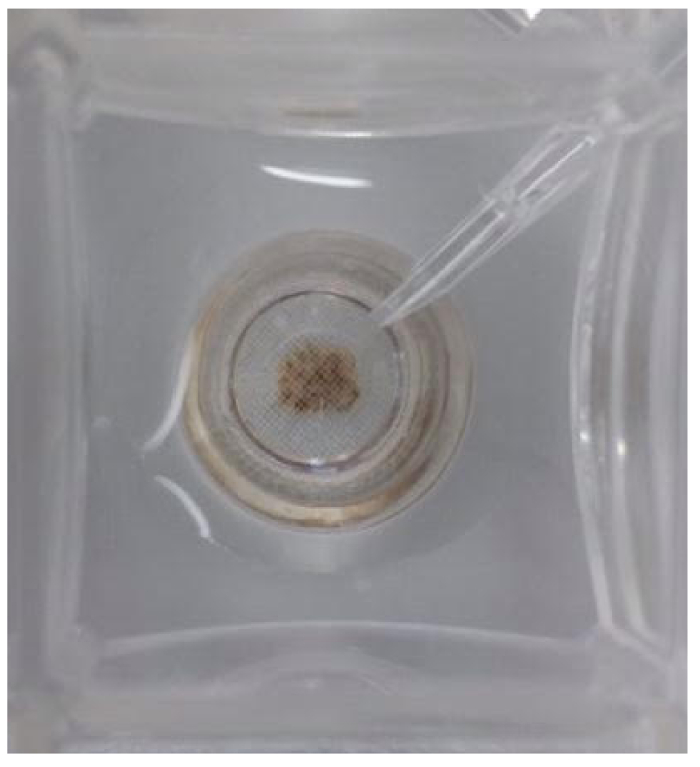
Figure 1. An example of a well containing 16 one-week old heads of male flies. The heads are centered below a net and floating in the media. Please click here to view a larger version of this figure.
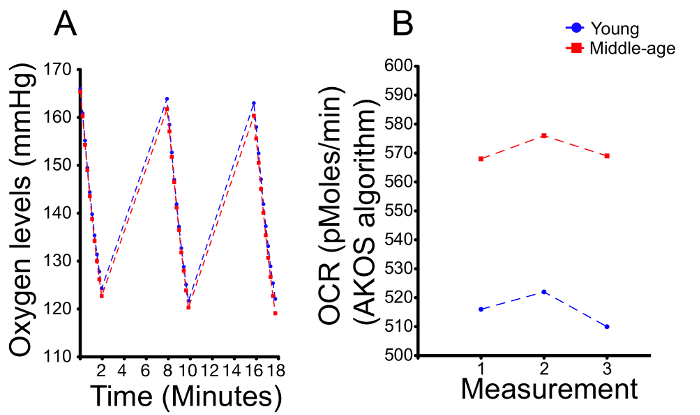
Figure 2. A representative example of OCR measurement comparison between one-week old fly heads (young) and four-week old fly heads (middle-age). (A) The oxygen levels are shown for three separate measurements; each 2 min measurement is subdivided into ten sub-measurements (ticks). (B) A quantification of (A). The levels of the first and last ticks are similar, although the levels of the middle-age sample are slightly lower. A quantification of the slope of the decrease in oxygen levels is used to generate the OCR levels. As previously described22, the OCR of middle aged flies is 10%-15% higher than young flies. Please click here to view a larger version of this figure.
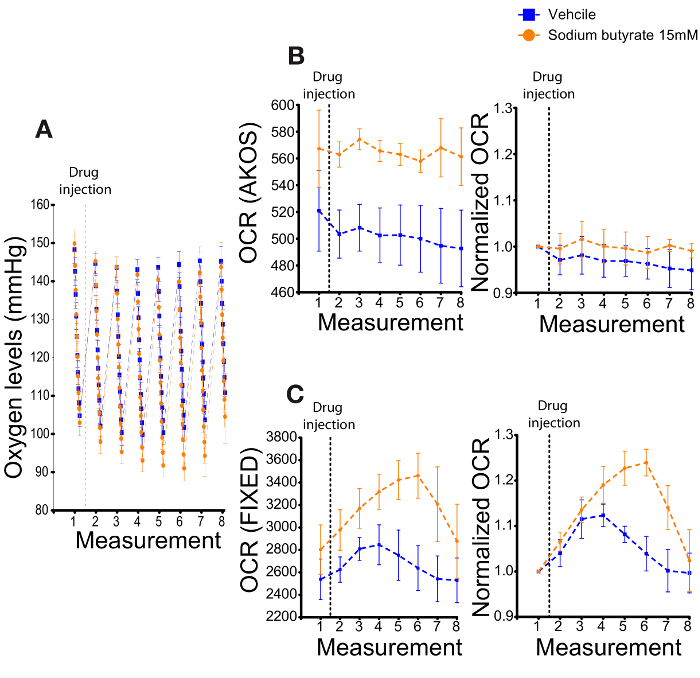
Figure 3. An example of the alteration of OCR by sodium butyrate (SB) in young fly heads. (A) Oxygen levels recorded from seven measurements following the addition of 15 mM SB. The dashed line marks the injection of the drug (or vehicle) from port A. Of note, while the oxygen levels of ticks 1 and 10 remain stable in the control group (Blue), the levels of oxygen during these ticks are transiently (six measurements following the injection) reduced in the SB treated samples (orange). In addition, the decrease in oxygen levels is greatly reduced during the last ticks of SB treated samples. N=3 per group (B) [Left] Non-normalized OCR levels calculated from the AKOS algorithm. The calculation incorrectly shows similar levels of OCR before and after the injection of SB by port A. [Right] Normalization of the OCR to the measurement prior to the injection of port A. (C) [Left] 'Fixed' algorithm calculation of (A) showing the non-normalized OCR. Here, the OCR closely represents the transient increase in oxygen usage of the heads upon SB treatment; [Right] Normalization of the OCR to the measurement prior to the injection of port A. Error bars indicate the S.E.M. in all the graphs. Please click here to view a larger version of this figure.
Discussion
Our new technique offers a novel approach to study metabolic changes in aging and disease in the context of whole fly head segments22. The method can also be suited to study the impact of KDAC sodium butyrate on oxygen consumption. As we have demonstrated, lysine deacetlyase inhibitors (HDACs/KDACs) result in OCR changes. Essentially, as the targets of such inhibitors are normally not localized in the mitochondria (these inhibitors do not impact the Class III deacetylases, the Sirtuins)24, such drugs could only be tested on an at least tissue level. Indeed, various drugs are injected directly to the brain, thus bypassing possible processing/modification/inactivation by the digestive system. As such, our technique offers novel insight into how such drugs directly impact the head segment.
There are several critical steps. First, as stated in the protocol, we highly recommend preparing a plate under one hour, with two pairs of hands preparing the plate. From our experience, the quality and stability of the OCR measurements are better when prepared in a timely manner. When taking too long, the occurrence of low OCR consuming wells is increasing, as well as shorter duration of stable OCR. Second, it is important to conduct a quality check and ensure that the experimental conditions between various samples are similar (pH, oxygen levels). Finally, a critical step is choosing the correct algorithm to analyze the samples. As we have demonstrated, the default AKOS algorithm yielded a misleading and sometimes opposing calculation in samples that consumed oxygen at high rates13. We therefore stress the importance of checking the raw data for oxygen levels and comparing the resulting OCR.
Currently, there are several limitations with this technique. At room temperature, the machine heats up to 31 °C (this is the minimal measuring temperature while the machine is at room temperature), which may represent a stress state for the fly heads25. This however can be overcome by placing the machine in a cold room, which will enable measurements at 25 °C and hence without a possible heat stress to the fly heads. Recent report has demonstrated placing the machine at 11 °C, thus enabling the OCR recording of flies at 25 °C21. Nevertheless, the fly head separation should be performed at room temperature. Furthermore, temperature fluctuations make it challenging to control pH changes and therefore it is highly recommended to test the impact of physiological conditions/drugs on OCR by using similar experimental setups. In addition, the contribution of oxygen consumption by non-mitochondrial-independent mechanisms has not yet been established26. By using various respiratory inhibitors that are efficient in fly heads, it would be possible to establish such non-mitochondrial oxygen consumption rates.
It is noteworthy that various mammalian maladies are characterized by alterations in energy metabolism. Among them are diseases that are characterized by either metabolic reduction such as Alzheimer's disease or metabolic rewiring such as cancer. Interestingly, KDAC inhibitors are used for both Alzheimer's disease and cancer treatment27. While the precise mechanisms by which KDAC inhibitors are achieving the therapeutic aspect remain unclear, the data from our technique supports the novel notion that such inhibitors may modulate metabolism.
In summary, this method is valuable for measuring overall oxygen consumption rates in vivo and more accurately displays drug effects on general metabolism, which may be overlooked in isolated mitochondria protocols12. For example, results obtained from this method, rather than previous techniques, have implicated novel insights for age-associated metabolic inflexibility upon KDAC treatment. While additional work is necessary to optimize the experimental conditions for fly heads, the combination of our technique and suitable analysis may lead to further elucidation of the mitochondrial activity in the context of whole living tissues.
Disclosures
The authors declare that they have no competing financial interests.
Acknowledgements
We thank Andreas Ladurner, Carla Margulis and their teams for extensive experimental support. We thank Caitlin Ondracek for her comments on the manuscript. We would like to thank Sofia Vikstrom for assisting us in establishing the early phases of this technique. We also thank May Sanderhoff for her technical help. LB is funded by the German Federal Ministry of Education and Research (Infrafrontier grant 01KX1012). SP was funded by an AXA Research Fund postdoctoral fellowship and the NSFC (Grant number 81870900). AVV is funded by the QBM.
Materials
| Name | Company | Catalog Number | Comments |
|---|---|---|---|
| Glucose | Sigma-Aldrich | G8644 | D-(+)-Glucose solution 100 g/L in H2O, sterile-filtered |
| XF assay Medium | Agilent | 103575-100 | Seahorse XF DMEM Medium, pH 7.4 |
| Sodium butyrate | Merck | 817500 | Dissolved in XF assay buffer |
| Seahorse XF24/e24 analyzer | Agilent | ||
| XF24/e24 Extracellular Assay Kit | Agilent | 100850-001 | Cartridge |
| XF24/e24 Islet Capture Microplates | Agilent | 101122-100 | Plate |
| Seahorse Capture Screen Insert Tool | Agilent | 101135-10 | Insertor |
| Petri dish | Sarstedt | 821,472 | Petri dish 92 x 16 mm |
References
- Wallace, D. C. Mitochondrial diseases in man and mouse. 283 (5407), Science. New York, N.Y. 1482-1488 (1999).
- Gerencser, A. A., et al. Quantitative microplate-based respirometry with correction for oxygen diffusion. Analytical chemistry. 81 (16), 6868-6878 (2009).
- Cunnane, S., et al. Brain fuel metabolism, aging, and Alzheimer's disease. Nutrition. 27 (1), Burbank, Los Angeles County, Calif. 3-20 (2011).
- Wang, Y., Hekimi, S. Mitochondrial dysfunction and longevity in animals: Untangling the knot. 350 (6265), Science. New York, N.Y. 1204-1207 (2015).
- Wallace, D. C., Fan, W., Procaccio, V. Mitochondrial energetics and therapeutics. Annual review of pathology. 5, 297-348 (2010).
- Zhang, X., et al. Induction of mitochondrial dysfunction as a strategy for targeting tumour cells in metabolically compromised microenvironments. Nature communications. 5, 3295(2014).
- Wheaton, W. W., et al. Metformin inhibits mitochondrial complex I of cancer cells to reduce tumorigenesis. eLife. 3, e02242(2014).
- Picard, M., et al. Mitochondrial structure and function are disrupted by standard isolation methods. PloS one. 6 (3), e18317(2011).
- Baker, D. J., Peleg, S. Biphasic Modeling of Mitochondrial Metabolism Dysregulation during Aging. Trends in biochemical sciences. 42 (9), 702-711 (2017).
- Zhao, S., et al. Regulation of cellular metabolism by protein lysine acetylation. 327 (5968), Science. New York, N.Y. 1000-1004 (2010).
- Baeza, J., Smallegan, M. J., Denu, J. M. Mechanisms and Dynamics of Protein Acetylation in Mitochondria. Trends in biochemical sciences. 41 (3), 231-244 (2016).
- Picard, M., et al. Mitochondrial functional impairment with aging is exaggerated in isolated mitochondria compared to permeabilized myofibers. Aging cell. 9 (6), 1032-1046 (2010).
- Becker, L., Nogueira, M. S., Klima, C., de Angelis, M. H., Peleg, S. Rapid and transient oxygen consumption increase following acute HDAC/KDAC inhibition in Drosophila tissue. Scientific reports. 8 (1), 4199(2018).
- Volkenhoff, A., et al. Glial Glycolysis Is Essential for Neuronal Survival in Drosophila. Cell metabolism. 22 (3), 437-447 (2015).
- Newell, C. Physiological Entomology. 41, 96-102 (2016).
- Rogers, G. W., et al. High throughput microplate respiratory measurements using minimal quantities of isolated mitochondria. PloS one. 6 (7), e21746(2011).
- Wikstrom, J. D., et al. A novel high-throughput assay for islet respiration reveals uncoupling of rodent and human islets. PloS one. 7 (5), e33023(2012).
- Koopman, M., et al. A screening-based platform for the assessment of cellular respiration in Caenorhabditis elegans. Nature. 11 (10), 1798-1816 (2016).
- Kumar, M. G., et al. Altered Glycolysis and Mitochondrial Respiration in a Zebrafish Model of Dravet Syndrome. eNeuro. 3 (2), (2016).
- Neville, K. E., et al. A novel ex vivo method for measuring whole brain metabolism in model systems. Journal of neuroscience. 296, 32-43 (2018).
- Neville, K. E., et al. Metabolic Analysis of Drosophila melanogaster Larval and Adult Brains. Journal of visualized experiments: JoVE. (138), (2018).
- Peleg, S., et al. Life span extension by targeting a link between metabolism and histone acetylation in Drosophila. EMBO reports. 17 (3), 455-469 (2016).
- Peleg, S., et al. Altered histone acetylation is associated with age-dependent memory impairment in mice. 328 (5979), Science. New York, N.Y. 753-756 (2010).
- Drazic, A., Myklebust, L. M., Ree, R., Arnesen, T. The world of protein acetylation. Biochimica et biophysica acta. 1864 (10), 1372-1401 (2016).
- Miquel, J., Lundgren, P. R., Bensch, K. G., Atlan, H. Effects of temperature on the life span, vitality and fine structure of Drosophila melanogaster. Mechanisms of ageing and development. 5 (5), 347-370 (1976).
- Banh, R. S., et al. PTP1B controls non-mitochondrial oxygen consumption by regulating RNF213 to promote tumour survival during hypoxia. Nature cell biology. 18 (7), 803-813 (2016).
- Falkenberg, K. J., Johnstone, R. W. Histone deacetylases and their inhibitors in cancer, neurological diseases and immune disorders. Nature reviews. Drug discovery. 13 (9), 673-691 (2014).
Reprints and Permissions
