We describe here a protocol to investigate cytotoxicity of pre-activated CD8+ T cells against cancer cells by detecting apoptotic cancer cells via real-time microscopy. This protocol can investigate mechanisms behind myeloid cell-induced T cell suppression and evaluate compounds aimed at replenishing T cells via blockade of immune suppressive myeloid cells.
Method Article
Real Time Detection of In Vitro Tumor Cell Apoptosis Induced by CD8+ T Cells to Study Immune Suppressive Functions of Tumor-infiltrating Myeloid Cells
1Royal (Dick) School of Veterinary Studies and Roslin Institute, University of Edinburgh, 2MRC Centre for Reproductive Health, University of Edinburgh, 3Edinburgh Phenotypic Assay Centre, University of Edinburgh, 4Cancer Research UK Edinburgh Centre, MRC Institute of Genetics, Molecular Medicine, University of Edinburgh
* These authors contributed equally
Opens in a new tab
In This Article
Summary
Loading...
$$\rightleftharpoonup{xx}$$
$$\longleftharp{xx}$$,
$$\longrightharp{xx}$$,
Abstract
Loading...
$$\rightleftharpoonup{xx}$$
$$\longleftharp{xx}$$,
$$\longrightharp{xx}$$,
Potentiation of the tumor-killing ability of CD8+ T cells in tumors, along with their efficient tumor infiltration, is a key element of successful immunotherapies. Several studies have indicated that tumor infiltrating myeloid cells (e.g., myeloid-derived suppressor cells (MDSCs) and tumor-associated macrophages (TAMs)) suppress cytotoxicity of CD8+ T cells in the tumor microenvironment, and that targeting these regulatory myeloid cells can improve immunotherapies. Here, we present an in vitro assay system to evaluate immune suppressive effects of monocytic-MDSCs and TAMs on the tumor-killing ability of CD8+ T cells. To this end, we first cultured naïve splenic CD8+ T cells with anti-CD3/CD28 activating antibodies in the presence or absence of suppressor cells, and then co-cultured the pre-activated T cells with target cancer cells in the presence of a fluorogenic caspase-3 substrate. Fluorescence from the substrate in cancer cells was detected by real-time fluorescence microscopy as an indicator of T-cell induced tumor cell apoptosis. In this assay, we can successfully detect the increase of tumor cell apoptosis by CD8+ T cells and its suppression by pre-culture with TAMs or MDSCs. This functional assay is useful for investigating CD8+ T cell suppression mechanisms by regulatory myeloid cells and identifying druggable targets to overcome it via high throughput screening.
Introduction
Loading...
$$\rightleftharpoonup{xx}$$
$$\longleftharp{xx}$$,
$$\longrightharp{xx}$$,
It is known that CD8+ T cells can eliminate tumor cells when they exert their full cytotoxicity. After activation of the T cell receptor (TCR), CD8+ T cells proliferate and differentiate into cytotoxic effector cells. The expanded and activated CD8+ T cells secrete cytotoxic granules, including perforin and granzymes, that are transferred into target cells and initiate various lytic pathways such as caspase-3 mediated apoptosis1. CD8+ T cells can also induce tumor cell apoptosis by activating receptors on target cells, such as receptors for tumor necrosis factor-α (TNF-α), first apoptosis signal ligand (FasL), or TNF-related apoptosis-inducing ligand (TRAIL). Furthermore, the activated CD8+ T cells secrete interferon-γ (IFN-γ) that can suppress tumor cell proliferation and increase the sensitivity of tumor cells to CD8+ T cells via the up-regulation of FasL receptor1. Given the potential for CD8+ T tumor killing ability, several strategies to boost their cytotoxicity (e.g., checkpoint inhibitors, cancer vaccination, and adoptive transfer of chimeric antigen receptor (CAR) expressing T cells) have been established and shown significant therapeutic effects on certain types of cancer2. However, accumulating evidence suggests that tumor-infiltrating immune cells such as regulatory T cells, myeloid-derived suppressor cells (MDSCs), and tumor-associated macrophages (TAMs) can suppress CD8+ T cell functions and restrict efficacy of immunotherapies3,4,5. To improve such immunotherapies, it is important to understand how immune suppressor cells limit CD8+ T cell cytotoxicity. The identification of CD8+ T cell suppression mechanisms as well as druggable targets to overcome it, will require the development and utilization of in vitro assays.
The gold standard method of measuring CD8+ T cell cytotoxicity is the chromium release assay in which the release of the radioactive probe (51Cr), from target cells that are lysed by CD8+ T cells, is determined6. However, this assay has several drawbacks including relatively low sensitivity, high background, inability to detect early apoptotic events, hazardous disposal problems, and limited compatibility with automated liquid handling and detection to support higher throughput applications. Another common method is flow cytometric analyses in which apoptosis of target tumor cells is detected by annexin V binding7. In this assay, it is possible to detect other parameters such as target cell death using propidium iodide (PI) or 7-aminoactinomycin D (7-AAD) and effector cell activation indicated by CD107a or CD69 expression, in addition to the apoptosis in target cells7. However, this assay requires large numbers of suppressor cells compared to the chromium release assay. It also requires the detachment and disaggregation of adherent target cells and this can bias the results. Indeed, the chromium release assay or flow cytometric assay are not commonly used to investigate suppressor cell effects on T cell functions. Instead, the measurement of T-cell proliferation indicated by dilution of a fluorescent dye (e.g., CFSE) pre-loaded into T cells is frequently used to evaluate the inhibition of CD8+ T cell function by suppressor cells. Detection of IFN-γ production from cultured T cells is another standard method to evaluate the effects of suppressor cells on T cell activation8,9. However, the results from these assays do not necessarily correlate to the target cell killing ability of CD8+ T cells.
We present here an alternative functional assay to evaluate effects of suppressor cells, particularly macrophages in metastatic tumors, on the cytotoxicity of CD8+ T cells. This method determines cytotoxicity of CD8+ T cells, pre-cultured with or without the suppressor cells in the presence of anti-CD3/CD28 activating antibodies, by detecting tumor cell apoptosis, indicated by fluorescence from a fluorogenic caspase-3 substrate6 using automated time-lapse microscopy (Figure 1). This protocol has several advantages compared to other methods; it requires only a small number of cells, enables detection of adherent tumor cell death with high sensitivity, can image real-time effector-to-target interaction and is amenable to high throughput screening.
In this protocol, metastasis-associated macrophages (MAMs) and their progenitor monocytic-MDSCs (M-MDSCs) isolated from metastatic tumors in mice are used as suppressor cells. In mouse models of metastatic breast cancer, a distinct population of macrophages characterized as F4/80highLy6G-CD11bhighLy6Clow accumulates in the lung containing metastatic tumors. This macrophage population is infrequently found in the normal lung and thus called metastasis-associated macrophages (MAMs)10. In these mouse models, another myeloid cell population, defined as F4/80highLy6G-CD11bhighLy6Chigh, also accumulates predominantly in the metastatic lung where it gives rise to MAMs11. Based on their characteristics, the CD11bhighLy6Chigh MAM progenitor cells might represent M-MDSCs12.
Protocol
Loading...
$$\rightleftharpoonup{xx}$$
$$\longleftharp{xx}$$,
$$\longrightharp{xx}$$,
All procedures involving mice were conducted in accordance with licensed permission from UK Home Office (P526C60B3). Information about commercial reagents and equipment are listed in the Table of Materials.
1. Preparation of target cells that express red fluorescent protein in their nuclei
- Obtain a target mouse cancer cell line from an appropriate source.
NOTE: In this protocol, a highly metastatic derivative of E0771 mouse mammary tumor cells (E0771-LG)13 are used. Parental E0771 cells originate from C57BL/6 mice14. - Thaw and maintain a vial of E0771-LG cells with Dulbecco’s Modified Eagles Medium (DMEM) including 10% (v/v) fetal bovine serum (FBS) in a cell culture incubator at 37 °C, 95% humidity, and 5% CO2.
NOTE: It should be confirmed that cells are negative for mycoplasma. To this end, culture E0771 cells (or cells to be tested) for 2-3 days as described above (in the absence of antibiotics and antimycotics), collect 500 μL of culture medium. Centrifuge the medium at 12,419 x g for 60 s to eliminate cell debris and transfer supernatant into new tubes. Determine mycoplasma contamination using a commercially available mycoplasma test kit (refer to Table of Materials) and/or PCR15 following the manufacturer’s instructions. - Seed 5 x 10³ E0771-LG cells per well into a 12-well plate, and culture the cells with 10% (v/v) FBS-DMEM overnight in an incubator at 37 °C, 95% humidity, and 5% CO2.
NOTE: If the proliferation rate of target cells is low (population doubling time greater than 36 h), the number of cells can be increased to 1 x 10⁴. - Replace the medium with 1 mL of 10% (v/v) FBS-DMEM including 10 μg/mL polybrene and add 25 μL of lentiviral particles (1 x 10⁶ TU/mL) encoding a nuclear restricted red fluorescent protein (mKate2, refer to Table of Materials).
- Culture the cells for 24 h in an incubator at 37 °C, 95% humidity, and 5% CO2.
- Replace the medium with 10% (v/v) FBS-DMEM and culture the cells for 24-48 h in an incubator at 37 °C, 95% humidity, and 5% CO2.
- Replace the medium with 10% (v/v) FBS-DMEM including 1 μg/mL puromycin when cells start to express red fluorescent protein, and culture the cells until they are 80-90% confluent.
NOTE: Concentration of puromycin will be different between target cell types and should be optimized using un-transfected cells. - Subculture the surviving cells for 1-3 passages with 10% (v/v) FBS-DMEM including 1 μg/mL puromycin, and cryopreserve stocks in a liquid nitrogen vapor phase storage system until use.
2. Isolation of suppressor cells from the tumors in mice
NOTE: In this protocol, suppressor cells (i.e., MAMs and M-MDSCs) are isolated from the lung containing metastatic tumors established by E0771-LG cells. Conditions for tissue dissociation and cell sorting should be optimized to isolate the cells from different tissues.
- Inject 1 x 10⁶ cancer cells (E0771-LG) into the tail vein of syngeneic (C57BL/6), female, 7-10 week old mice.
- After 14 days, isolate the lung containing metastatic tumors and prepare single-cell suspensions from the perfused lungs via enzymatic digestion as previously described11.
NOTE: In this protocol, four mice are injected with cancer cells and their metastatic lungs are combined to obtain sufficient suppressor cells. - Incubate the single cell suspensions with anti-mouse CD16/CD32 antibody for 30 min on ice, and stain with fluorescent antibodies to CD45, F4/80, CD11b, Ly6C, and Ly6G (refer to Table of Materials) for another 30 min10,11,13.
- Wash the stained cells once with 1 mL of PBS containing 2% (w/v) bovine serum albumin (BSA), and re-suspend the cell pellet with 500–1000 μL of PBS containing 2% (w/v) BSA.
- Add 3 μM of DAPI, and sort M-MDSCs (DAPI–CD45+F4/80+Ly6G–CD11bhighLy6Chigh) and MAMs (DAPI–CD45+F4/80+Ly6G–CD11bhighLy6Clow) using a cell sorter (Supplementary Figure 1).
NOTE: The threshold of Ly6C level to distinguish MAMs (Ly6Clow) and M-MDSCs (Ly6Chigh) is based on that of resident alveolar macrophages (RMAC). The purity of the sorted cells is measured via flow cytometry with an expected purity of more than 90%. - Resuspend the sorted cells with 400 μL of DMEM containing 20% (v/v) FBS, 1% (v/v) penicillin/streptomycin, 2 mM L-glutamine, 1% (v/v) non-essential amino acid, 1 mM sodium pyruvate, and 50 nM 2-mercaptoethanol (called enriched-DMEM, E-DMEM).
- Count the number of live cells using the Trypan blue exclusion method16 and adjust to 2 x 10⁶ cells/mL with E-DMEM.
- Keep the cells on ice until use.
3. Isolation of CD8+ T cells from the spleen of mice
- Isolate the spleen from a mouse that is syngeneic to the target cancer cell line (i.e., C57BL/6 mice in this protocol) as follows:
- Euthanize the animal by CO2 inhalation.
- Place the animal on a clean dissection board and wipe the skin with 70% (v/v) ethanol.
- Cut the abdominal skin using scissors to expose the spleen
- Isolate the spleen, which is located inferior to the stomach, and place it into a tube containing 5 mL of ice-cold PBS.
- Using the inner plunger of a sterile 5 mL syringe, grind the spleen on a 100 μm cell strainer set on a 50 mL tube.
- Pass the cells through the filter using total 10 mL of PBS.
- Centrifuge the cell suspension at 337 x g for 5 min, and aspirate the supernatant.
- Resuspend the cell pellet in 1 mL of PBS containing 2 mM EDTA and 0.5% (w/v) BSA (running buffer) and filter through a 40 μm cell strainer.
- Count the live cell number and adjust to 1 x 10⁸ cells/mL using the running buffer.
NOTE: Keep a small aliquot of cells as a pre-enrichment sample for a purity check. - Enrich for CD8+ T cells using a negative selection kit and a magnetic sorter (refer to Table of Materials).
- Transfer 1 x 10⁸ (1 mL) of the splenocytes cells to a 5 mL polystyrene round-bottom tube.
- Add 50 μL of biotinylated antibodies, and incubate at room temperature for 10 min.
- Add 125 μL of streptavidin conjugated magnetic beads, and incubate at room temperature for 5 min.
- Add 1.325 mL of running buffer, and gently mix by pipetting.
- Place the tube into the magnet, and incubate at room temperature for 2.5 min.
- Pick up the magnet, and pour the enriched cell suspension into a new tube.
- Resuspend the enriched cells with 200 μL of E-DMEM (i.e., DMEM containing 20% (v/v) FBS, 1% (v/v) penicillin/streptomycin, 2 mM L-glutamine, 1% (v/v) non-essential amino acid, 1 mM sodium pyruvate, and 50 nM 2-mercaptoethanol).
- Count the number of live cells and adjust to 2 x 10⁶ cells/mL with E-DMEM. Keep the cells at 37 °C in a CO2 incubator until use.
NOTE: Keep a small aliquot of cells as a post-enrichment sample for a purity check. - Determine the purity of CD8+ T cells by flow cytometry as follows:
- Take 1 x 10⁴ cells from pre-enrichment (step 3.6) or post-enrichment (step 3.9) samples and adjust total volume of each to 100 μL using running buffer.
- Incubate the single cell suspensions with anti-mouse CD16/CD32 antibody for 30 min on ice, and stain with fluorescent antibodies to CD45, CD3, CD4, and CD8 (refer to Table of Materials) for another 30 min.
- Wash the stained cells with 500 μL of PBS containing 2% (w/v) BSA, and re-suspend the cell pellet with 500–1000 μL of PBS containing 2% (w/v) BSA.
- Add 3 μM of DAPI, and determine the percentage of CD3+CD4–CD8+ cells in the total CD45+ cell population.
4. Activation and expansion of the isolated CD8+ T cells
- Aliquot 1 x 10⁵ cells per 50 μL CD8+ T cells (prepared in step 3.9) into wells of a U-bottom 96-well plate.
- Add 1 x 10⁵ cells per 50 μL suppressor cells (prepared in step 2.7) or 50 μL of E-DMEM into the wells.
- Prepare activation medium that consists of E-DMEM, 4 x 10⁴ U/mL colony-stimulating factor 1 (CSF-1), 240 U/mL interleukin-2 (IL-2), 8 μg/mL anti-mouse CD3ε antibody, and 16 μg/mL anti-mouse CD28 antibody.
NOTE: CSF-1 is not required for T cell activation, but is essential for survival of suppressor cells in this protocol (i.e., MAMs and M-MDSCs). Thus, it is retained in the co-culture of T cells with target cancer cells to maintain consistency in culture conditions. Since CSF-1 is found in nano-molar concentrations in all tissues and is required for monocyte/macrophage viability in vivo, this is a physiological context for these cells. - Add 50 μL of activation medium (step 4.3) and 50 μL of E-DMEM with or without reagents to be tested.
- Place the plate into an incubator at 37 °C, 95% humidity, and 5% CO2 and culture the cells for 4 days.
5. Setup of co-culture of target cells with pre-activated CD8+ T cells
- Add 30 μL of 1:100 diluted growth factor-reduced soluble basement membrane matrix (Table of Materials) into the wells of flat bottom 96-well plate suitable for microscopy, and incubate at 37 °C in a CO2 incubator for at least 1 h.
- Prepare target cells (i.e., E0771-LG cells expressing nuclear-restricted red fluorescent protein).
- Incubate the target cells with 1 mL of 0.05% trypsin/EDTA at room temperature for 1 min, and harvest the cells by gentle pipetting.
- Add 9 mL of DMEM including 10% (v/v) FBS, and centrifuge the cell suspension at 337 x g for 5 min.
- Re-suspend the cells with 500 μL of E-DMEM, and count the number of live cells.
NOTE: Before counting the target cells, filter the cells through a 40μm cell strainer to produce single cell suspension. - Adjust the density to 2 x 10⁴ cells/mL (= 1 x 10³ cells per 50 μL) by adding E-DMEM, and keep the cells on ice.
- Prepare effector cells (i.e., pre-activated CD8+ T cells).
- Resuspend the cells in a well of 96-well plate (step 4.5) thoroughly by pipetting, and transfer the floating CD8+ T cells into a new 1.5 mL tube.
NOTE: MAMs and M-MDSCs tightly adhere to the well and are not detached by the pipetting. - To collect remaining cells, add 200 μL of PBS into the well and transfer into the tube in step 5.3.1.
- Wash the cells with 1 mL of E-DMEM once (centrifuge at 337 x g) for 5 min, aspirate and discard supernatant), and resuspend them with 100 μL of E-DMEM.
- Count the number of live cells (using the trypan blue exclusion method), adjust the density to 1.6 x 10⁵ cells/mL (= 4 x 10³ cells/25 μL), and keep the cells on ice.
- Resuspend the cells in a well of 96-well plate (step 4.5) thoroughly by pipetting, and transfer the floating CD8+ T cells into a new 1.5 mL tube.
- Aspirate the basement membrane matrix from each well of the plate in step 5.1.
- Add 1 x 10³ cells/50 μL of target cells (step 5.2.4) into each well and mix well.
NOTE: To avoid edge effects due to evaporation of medium, only the inner 60 wells of the 96 well plate should be used for analysis. - Add 25 μL of E-DMEM including 4 x 10³ U/mL IL-2 and 10 μM fluorogenic caspase-3 substrate (refer to Table of Materials).
- Add 4 x 10³ cells/25 μL of CD8+ T cells (step 5.3.4) into appropriate wells and mix well.
NOTE: The presence of too many cells in a well makes the analysis more difficult. In this model, a 4:1 effector: target ratio (total cell number 5 x 10³ cells/well) was optimal, but an 8:1 ratio was suboptimal. Wells containing the following four controls are necessary to aid with data analysis: target cells at the density used for the co-culture wells (1 x 10³ cells/well) in medium with and without caspase-3 substrate, effector cells (1 x 10³ cells/well) in medium with and without caspase-3 substrate. - Add 200 μL of PBS or sterile water into all empty wells (particularly wells on the periphery of the plate) to reduce evaporation of medium from experimental wells.
- Set the plate into a time-lapse fluorescence microscope that is maintained at 37 °C, 95% humidity, and 5% CO2.
NOTE: Shake the plate in a cross-pattern to distribute all cells evenly, and then allow the plate to remain at room temperature on a flat surface for 10-20 min before transferring to the incubator.
6. Imaging of the cells
NOTE: Detailed image acquisition settings will vary with the microscope and fluorophores used; the following general acquisition parameters should be employed for optimal results.
- Using an appropriate autofocus routine on the microscope, acquire images covering at least 25% of the total surface area in each experimental well of the 96-well plate.
- Set the microscope to acquire images in phase contrast as well as a fluorescent channel suitable for the nuclear-restricted red fluorescent protein (mKate2) and a fluorescent channel suitable for the green fluorogenic activated caspase-3 substrate (with excitation at 488 nm) (Figure 2).
- Capture images in experimental wells in phase contrast and the 2 fluorescent channels every 1 to 3 h for at least 72 h.
7. Image analysis using image analysis software
NOTE: Detailed image analysis settings will vary with the software used (refer to Table of Materials); the following general analysis procedures should be employed for optimal results.
- Determine whether spectral un-mixing is required to separate the fluorescent signal emitted by target cell nuclei from that emitted by apoptotic nuclei and if required, set up an analysis protocol to accomplish this;
- View a control well containing only target cells (mkate2-labeled) in medium without caspase-3 substrate in the green fluorescent channel.
- Observe whether green fluorescence is being emitted by the red nuclei (nuclei appear green)
- If green fluorescence is apparent in the nuclei, access the spectral unmixing control in the imaging software and increase the percentage of red removed from green until the green signal disappears (in our experience, this is usually 6-7% for bright mKate2 fluorescence).
- If green fluorescence is not apparent in any nuclei, no spectral unmixing is necessary.
NOTE: This spectral unmixing correction test can also be carried out using a well of target cells in medium containing caspase-3 substrate. However, there is usually a very low level of spontaneous apoptosis in target cells (less than 10%), resulting in a few target cell nuclei emitting green fluorescence due to activation of caspase-3 rather than fluorescence bleed through. True fluorescence bleed through is evident under these conditions when green fluorescence is apparent in all nuclei. - View a control well containing only effector cells (nuclei unlabeled) in medium without caspase-3 substrate in the red and green channel individually.
- Observe whether either green or red fluorescence is being emitted by the nuclei. If neither red nor green fluorescence is apparent in the individual channels no spectral unmixing is necessary.
NOTE: In our experience, the mouse CD8+ T cells are not auto-fluorescent and thus no spectral unmixing is necessary for these cells. This spectral unmixing correction test can also be carried out using a well of effector cells in medium containing caspase-3 substrate. However, there is usually some level of spontaneous apoptosis resulting in effector cell nuclei emitting green fluorescence due to activation of caspase-3. True fluorescence bleed through is evident under these conditions when green fluorescence is apparent in all nuclei.
- Use a fluorescence background subtraction method (e.g., TopHat), with relevant parameters for the sample, to resolve the fluorescent objects in both fluorescent channels.
NOTE: In the green channel we used TopHat (nuclei radius = 10.0 µm, green fluorescence threshold = 0.7 green calibration units). In the red channel we used TopHat (nuclei radius = 10.0 µm, red fluorescence threshold = 0.5 red calibration units). - Use appropriate parameters for edge-splitting to resolve individual fluorescent nuclei.
NOTE: We did not use edge splitting in the green or red fluorescence channel. - Use images in the red channel from the wells containing only target cells (with caspase substrate) to determine the minimum size of target nuclei.
NOTE: We used 80 µm2. - Use images in the green channel from the wells containing only effector cells (with caspase substrate) to determine the average size of apoptotic effector nuclei.
NOTE: Single apoptotic effector nuclei ranged from 40 – 80 µm2 in these experiments. - Set up an analysis procedure to count the number of fluorescent target cell nuclei using an appropriate minimum size restriction (e.g., minimum area, minimum diameter) (Figure 2, target detection mask).
NOTE: We used a minimum nuclei area (red fluorescence) = 80 µm2. - Set up an analysis procedure to count the number of apoptotic nuclei which are larger than the mean size of apoptotic effector nuclei (Figure 2, size restricted apoptosis mask).
NOTE: Size filter was set to 80 µm2 (i.e., only areas of green fluorescence larger than this size were counted, thus excluding single apoptotic effector nuclei). Using these parameters increases the accuracy of the analysis in counting apoptotic target cell nuclei although some aggregates of apoptotic effector cells may be counted. - Set up an analysis procedure to count the number of apoptotic target cells by counting nuclei where red fluorescent signal (from step 7.6) and size-restricted green fluorescent signal (from step 7.7) significantly co-localize (Figure 2, R/G overlap mask).
NOTE: An appropriate co-localization may range from 30% to 100% of the mean size of target nuclei. Overlap size filter was set to 40 µm2. - Determine the number of apoptotic target cell nuclei as well as the number of target cell nuclei in the wells for each experimental condition over the entire time course.
8. Data analysis using calculation and graphing software
- Graph the number of apoptotic target cell nuclei obtained in step 7.9 over the entire time course for the experimental wells. If multiple wells were used for each experimental condition, graphically present the results as mean ± standard deviation.
- Calculate the apoptotic fraction of the population of target cells by dividing the number of apoptotic cells in each well by the number of target cells in each well at each time point.
- Graph the results obtained in step 8.2.
- Determine the area under the curve (AUC) for each curve. The peak apoptotic fraction of the population for each curve may also be determined as well as the time point at which the peak occurs, if desired. Determine whether the AUC determined for the experimental conditions are significantly different using appropriate statistical tests.
NOTE: The unpaired t-test with Welch’s correction was applied to the AUC results.
Results
Loading...
$$\rightleftharpoonup{xx}$$
$$\longleftharp{xx}$$,
$$\longrightharp{xx}$$,
This method is based on simple co-culture of target cancer cells with effector CD8+ T cells that have been pre-cultured with or without suppressor cells in the presence of anti-CD3/CD28 activating antibodies. It detects CD8+ T cell-induced cancer cell apoptosis over time following co-culture, thus enabling evaluation of effects of suppressor cells on cytotoxicity of CD8+ T cells.
Typically, cancer cells increase green fluorescence in their nuclei following activation of a nuclear-targeting caspase biosensor when these cells make contact with CD8+ T cells that are pre-activated by antibodies in the absence of suppressor cells (Figure 3; Supplementary Movie 1). Green fluorescence from the caspase substrate was detectable for at least 15 h after apoptosis was initiated. Some spontaneous apoptosis of effector CD8+ T cells was also observed over time even if these cells were cultured in isolation (Figure 4; Supplementary Movie 2). However, nuclei sizes of CD8+ T cells are smaller than those of cancer cells and thus apoptotic 'effector' cells can be excluded from apoptotic 'target' cell counts by a size restriction image analysis method (Figure 2 and Figure 4). Although some target cancer cells show a small rounded shape without green fluorescence, this does not affect the analysis as these cells are undergoing mitosis rather than apoptosis (Supplementary Movie 3), and thus are excluded from apoptotic 'target' cell counts by a red/green overlap mask (Supplementary Figure 2). Spontaneous apoptosis of target cancer cells is occasionally found even in the single culture (Supplementary Movie 3). However, the co-culture of target cancer cells with pre-activated CD8+ T cells increased tumor cell apoptosis above the levels of spontaneous apoptosis in monoculture of cancer cells (Figure 4). Generally, when using an optimal ratio of target cancer cells to effector cells, a peak in the number of apoptotic target cancer cells can be observed (Figure 5A). This peak is more distinct when the data is expressed as the apoptotic fraction of the target cell population (Figure 5B). In this experiment the basal apoptosis of target tumor cells peaked at 24 h (with apoptotic fraction = 0.08), but CD8+ T cell-induced apoptosis reached a maximum level at 17 h (with apoptotic fraction = 0.66).
We further found that CD8+ T cells pre-incubated with MAMs or M-MDSCs could make contact with target cancer cells but this contact seemed to result in fewer instances of cancer cell apoptosis compared to CD8+ T cells pre-activated without suppressor cells (Figure 3 and Figure 4; Supplementary Movie 4 and Supplementary Movie 5). Although the CD8+ T cells pre-incubated with the myeloid cells occasionally induced cancer cell apoptosis, there was also some proliferation of target cancer cells that have not been stimulated to undergo apoptosis during the time course of the experiment (Supplementary Movie 6). Consistent with these findings, the peak fraction of apoptotic cancer cells cultured with CD8+ T cells pre-incubated with myeloid cells (apoptotic fraction = 0.38 at 23 h for MDSC-E and 0.25 at 20 h for MAM-E) was significantly lower than that of cancer cells cultured with CD8+ T cells which were not pre-incubated with the suppressor cells (Figure 6).

Figure 1: A scheme showing the experimental procedure. Naïve splenic CD8+ T cells are cultured with anti-CD3/CD28 activating antibodies with or without metastasis-associated macrophages (MAMs) or monocytic-myeloid-derived suppressor cells (M-MDSCs). After 4 days, floating CD8+ T cells are collected and co-cultured with target cancer cells in the presence of fluorogenic caspase-3 substrate. Apoptotic cancer cells are detected under real-time fluorescence microscopy. Images shown were acquired using a live cell-imaging platform (refer to Table of Materials). Please click here to view a larger version of this figure.
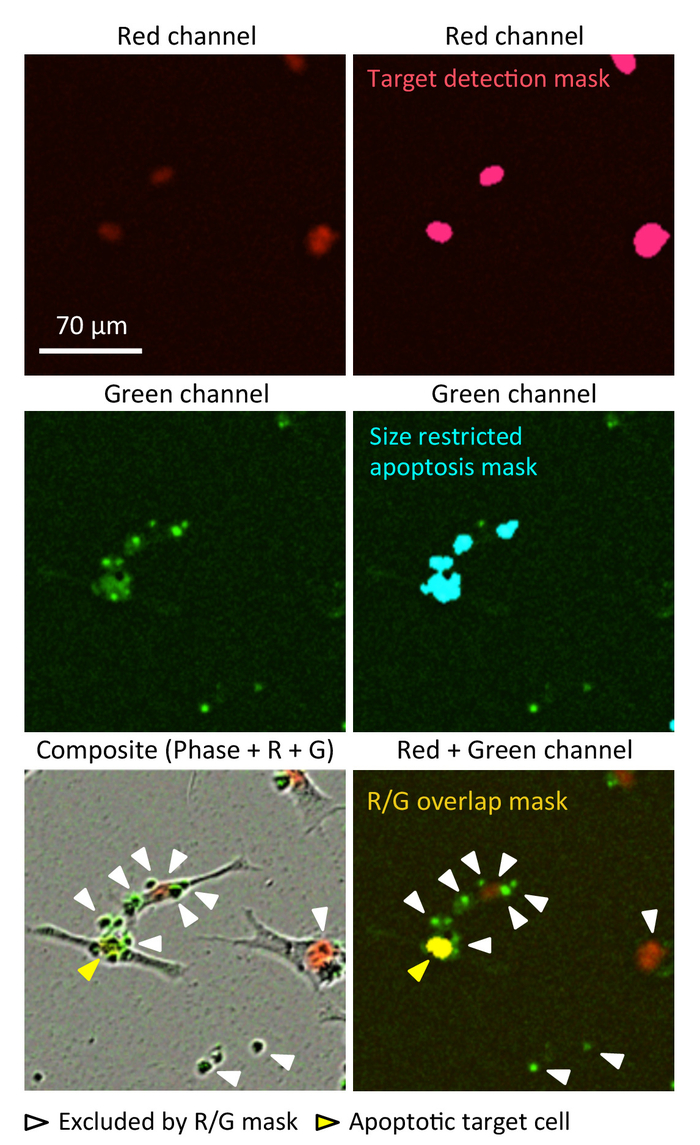
Figure 2: Identification of apoptotic target cells distinct from apoptotic effector cells. Top row:Image acquisition in the red channel allows the identification of target cell nuclei by target detection mask (pink analysis mask). Middle row: Images acquired in the green channel indicate apoptotic effector and target cells.Asize restricted apoptosis mask (teal analysis mask; greater than 80 µm2) allows single apoptotic effector cells to be excluded from the analysis. Bottom row: composite images merged red and green channels with phase contrast image (left) or red/green overlap mask (right). Identification of co-localized, size-restricted green fluorescence with red fluorescence (yellow analysis mask), allows more accurate detection of apoptotic target nuclei (yellow arrowhead) by excluding aggregates of apoptotic effector cells (white arrowheads). Please click here to view a larger version of this figure.
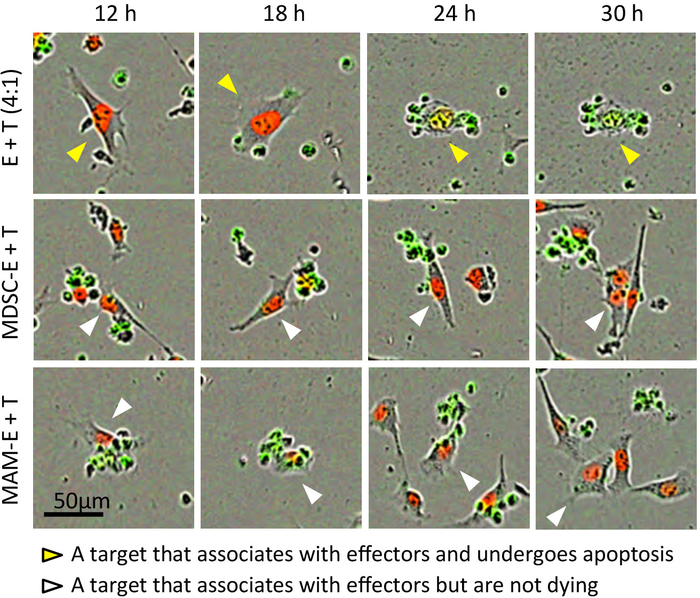
Figure 3: Interaction between CD8+ T cells and cancer cells. Stills from representative time-lapse movies of target E0771-LG_NLR cells (T) co-cultured with effector CD8+ T cells (E) at 4:1 effector/target ratio. MDSC-E and MAM-E indicate effector cells pre-incubated with M-MDSCs and MAMs respectively. Composite images (including images from phase contrast, red and green channels) are shown. Arrowheads are tracking the same cells through the different fields and time points. Yellow arrowheads: a target that associates with effectors and undergoes apoptosis, white arrowheads: a target that associates with effectors but does not undergo apoptosis. Please click here to view a larger version of this figure.
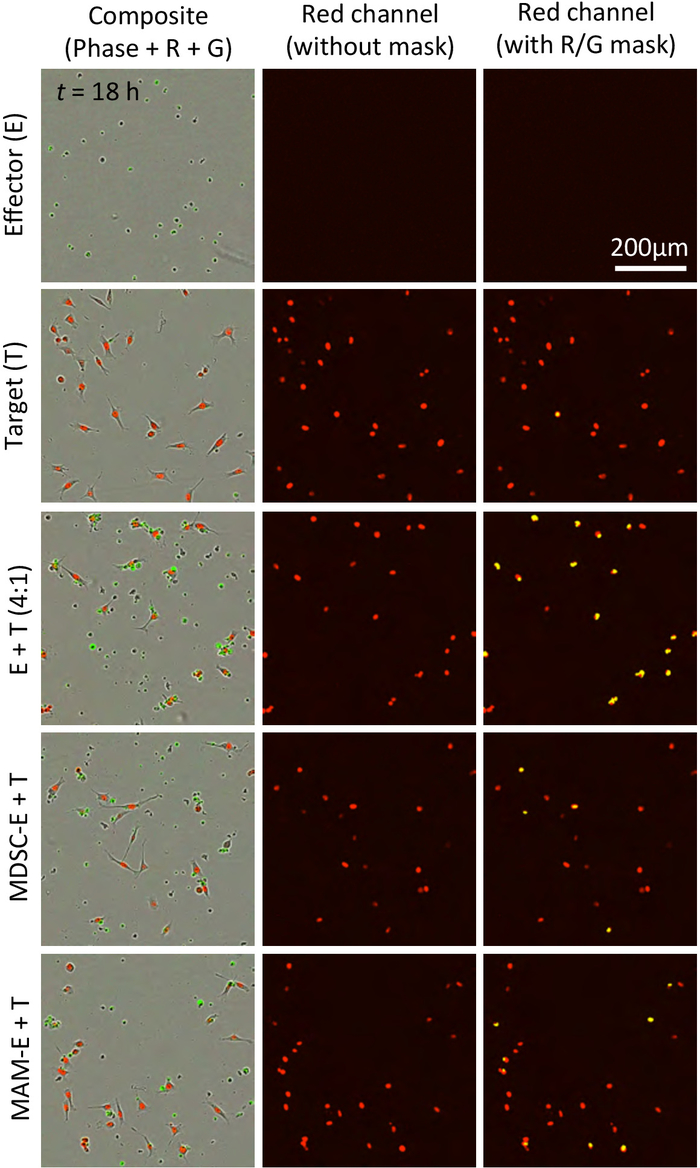
Figure 4: Detection of apoptotic cancer cells. Representative fields extracted from time-lapse movies at 18 h after imaging. Composite images (left; phase contrast, red and green channels) and images from red channel without (middle) or with (right) red/green overlap mask (yellow) are shown. Yellow dots in the right column represent apoptotic cancer cells. Please click here to view a larger version of this figure.
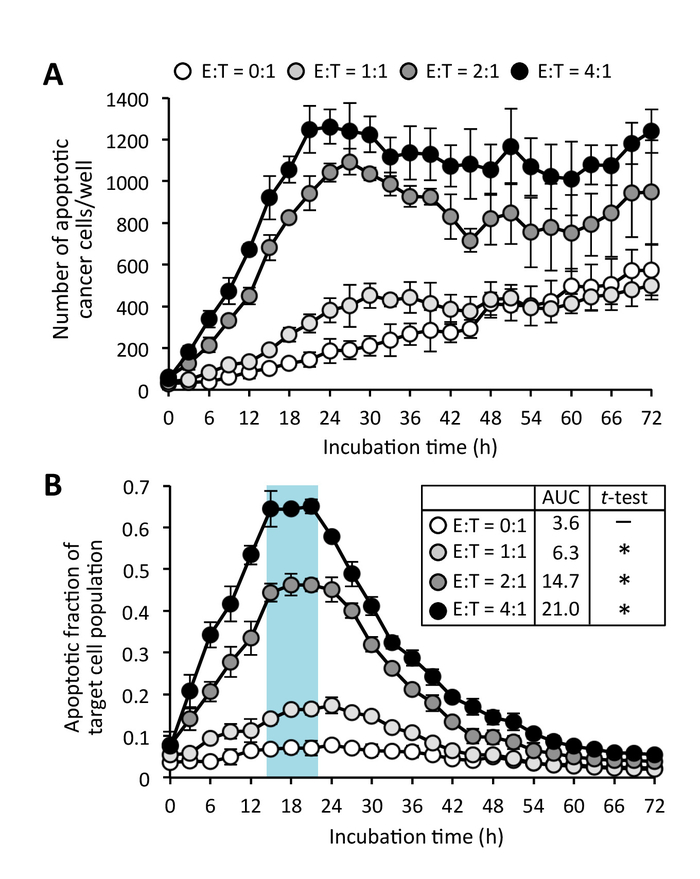
Figure 5: CD8+ T cell-induced cancer cell apoptosis. (A) Number of apoptotic cancer cells cultured with effector C8+ T cells at different effector to target ratio (E:T). (B) Apoptotic fraction of target cell population. Data are means ± SD. Mean area under the curve (AUC) is also shown. Unpaired t-test with Welch's correction was used to analyze the AUC. *P<0.0001 compared to E:T=0:1. Please click here to view a larger version of this figure.
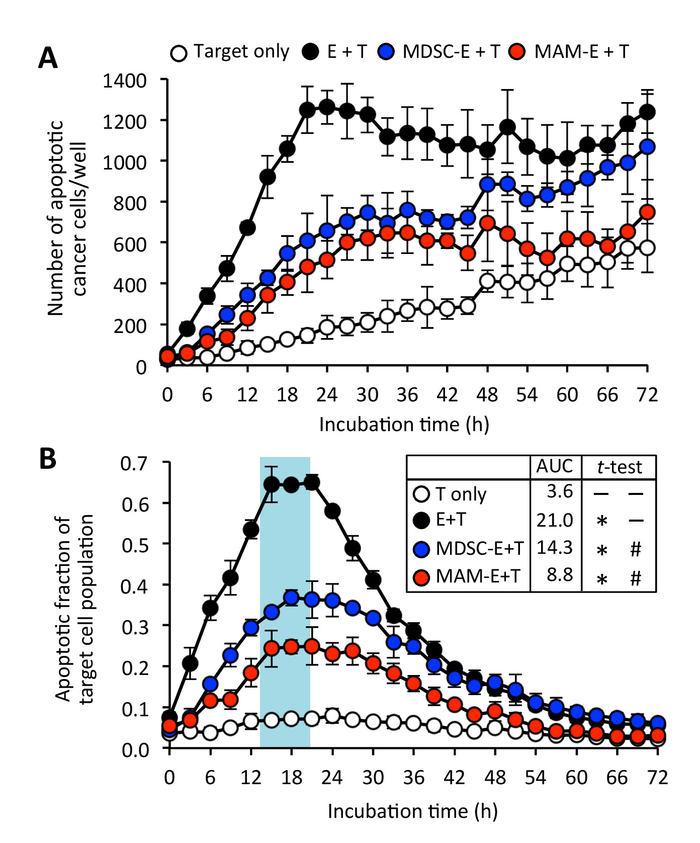
Figure 6: Effects of tumor-infiltrating myeloid cells on cytotoxicity of CD8+ T cells. (A) Number of apoptotic cancer cells (target: T) cultured with C8+ T cells (effector: E) at 4:1 of E:T ratio. CD8+ T cells were pre-cultured in the absence (black circle) or presence of monocytic-myeloid-derived suppressor cells (MDSC-E: blue circle) or metastasis-associated macrophages (MAM-E: red circle). Data are means ± SD. (B) Apoptotic fraction of target cell population. Data are means ± SD. Mean AUC is also shown. Unpaired t-test with Welch's correction was used to analyze the AUC. *P<0.0001 compared to T only, #P<0.0001 compared to E+T. Please click here to view a larger version of this figure.
Supplementary Figure 1. Gating strategy to isolate suppressor cells from the metastatic lung. (A) Representative dot plots to isolate monocytic myeloid-derived suppressor cells (M-MDSCs) and metastasis-associated macrophages (MAMs). The threshold of Ly6C level to distinguish MAMs (Ly6Clow) and M-MDSCs (Ly6Chigh) is based on that of resident alveolar macrophages (RMAC). (B) Purity of the sorted M-MDSCs (CD45+Ly6G-CD11b+Ly6Chigh) and MAMs (CD45+Ly6G-CD11b+Ly6Clow). Please click here to download this file.
Supplementary Figure 2. Representative images of mitotic target cells. Stills from representative time-lapse movies of target E0771-LG_NLR cell mono-culture. Top: composite images including images from phase contrast, red and green channels. Bottom: composite images (red and green channels) with red/green overlap mask. Please click here to download this file.
Supplementary Figure 3. Effects of tumor-infiltrating myeloid cells on proliferation of CD8+ T cells. (A) Representative histograms showing dilution of fluorescent labeling with CFSE in CD8+ T cells. Naïve splenic CD8+ T cells were isolated as described in Protocol-3 and labeled with 5 µM of CFSE at 37 °C for 15 min. The labeled T cells were cultured in the presence of IL-2 and anti-CD3/CD28 activating antibodies with or without myeloid cells as described in Protocol 4. After 4 days, green fluorescence in T cells was detected by flow cytometer. (B) Division index of CD8+ T cells calculated as previously described17. Data are means ± SEM. *P<0.01 compared to control, #P<0.05 compared to αCD3/CD28 Ab. Please click here to download this file.
Supplementary Movie 1. Movie of Figures 3 and 4; E+T. Please click here to download this file.
Supplementary Movie 2. Movie of Figures 3 and 4; Effector (E). Please click here to download this file.
Supplementary Movie 3. Movie of Figures 3 and 4; Target (T). Please click here to download this file.
Supplementary Movie 4. Movie of Figures 3 and 4; MDSC-E +T. Please click here to download this file.
Supplementary Movie 5. Movie of Figures 3 and 4; MAM-E +T. Please click here to download this file.
Supplementary Movie 6. Movie of Figures 3 and 4; MAM-E +T (proliferation). Please click here to download this file.
Discussion
Loading...
$$\rightleftharpoonup{xx}$$
$$\longleftharp{xx}$$,
$$\longrightharp{xx}$$,
This method is based on two separate co-culture steps: co-culturing CD8+ T cells with potential suppressor cells, and co-culturing the ‘pre-conditioned’ CD8+ T cells with target tumor cells (Figure 1). The first co-culture step is quite similar to that for CD8+ T cell proliferation assays commonly used to determine the effect of suppressor cells on CD8+ T cell function. However, T cell proliferation does not always correlate with their cytotoxicity. For example, we have found that co-culture with M-MDSCs or MAMs increased rather than reduced proliferation of CD8+ T cells in the presence of CD3/CD28 activating antibodies (Supplementary Figure 3), whereas these pre-conditioned CD8+ T cells demonstrated reduced cytotoxicity against target cancer cells (Figure 4, Figure 5, Figure 6). These results highlight the importance of the evaluation of functional activity, evidenced by target cancer cell apoptosis, offered by this CD8+ T cell cytotoxicity assay.
In this assay, we have identified that CD8+ T cells requires approximately 15 h of co-culture in order to induce maximum apoptosis of E0771-LG mouse mammary tumor cells (Figure 5). This delay might be due to the lag between initial contact of effector cells with targets and accompanying immune synapse formation, as well as time required to induce apoptotic signals in targets as measured by activation of caspase-3 (Supplementary Movie 1). We also identified that the number of apoptotic tumor cells reached a plateau after 24 h, which is probably due to the elimination of targets by T cells and/or loss of fluorescent signal from dead cells. This capability to identify the time of peak apoptosis is one major advantage of this assay since determination of an optimal time point is important for appropriate comparisons between different conditions. In our case for example, the difference in cytotoxicity between control CD8+ T cells and MDSC/MAM-educated CD8+ T cells was much larger at 15 - 18 h compared to 72 h (Figure 5), and thus an endpoint experiment using a 72 h incubation period would yield misleading results.
This method also enables visualization of real-time effector-to-target cell interaction, which would provide greater insights into the mechanism underlying limited cytotoxicity of CD8+ T cells pre-incubated with suppressor cells. For example, we observed that CD8+ T cells pre-incubated with M-MDSCs or MAMs encountered and interacted with target tumor cells but did not always induce apoptosis (Supplementary Movie 4, Supplementary Movie 5, Supplementary Movie 6). Although we did not quantify this event, it would be feasible and interesting to quantify and compare the proportion of encounters and their interaction time in correlation with apoptosis induction. Another major advantage is that this method requires a small number of cells (e.g., 1 x 10³ of target and 4 x 10³ of effector cells per well). In fact, this protocol can be further miniaturized for the 384-well plate format if desired. Therefore, this assay is suitable for high throughput screening and experiments where cell numbers are limited such as in vitro testing using precious cells derived from in vivo or ex vivo samples.
On the other hand, a limitation of the current assay is the presence of significant numbers of dead effector cells in some conditions. In order to increase accuracy in distinguishing apoptosis of target cancer cells from that of effector CD8+ T cells, the nuclei of target cells are labeled and a nuclei size restriction (that excludes effector cells) is applied for data analysis in this assay (Figure 2). However, there are some instances where overlay of aggregates of (green) apoptotic CD8+ T cells onto non-apoptotic target cancer cells, which may confound the results. This limitation could be mitigated by use of a dead cell removal column on effector cells prior to co-culture with target tumor cells, assuming sufficient numbers of effector cells are available. With more complex microscopy systems, it may also be possible to reduce the false positive signal by labeling the effector CD8+ T cells with a fluorophore distinct from the target cell nuclei and the fluorogenic caspase-3 substrate.
So far, this protocol has been utilized to investigate the antigen non-specific activation of CD8+ T cells. Although MDSCs and TAMs in the tumor microenvironment suppress T cell functions through antigen non-specific mechanisms, MDSCs in the peripheral lymphoid tissues suppress T cell responses in an antigen specific manner18. To investigate immune suppressive functions of such cell types, an in vitro proliferation assay using CD8+ T cells from OT-1 transgenic mice is commonly used. In this assay, the OT-1 T cells (expressing ovalbumin (OVA) specific T cell receptor) are co-cultured with suppressor MDSCs in the presence of OVA peptides, which is applicable for the first culture in our cytotoxicity assay (i.e., activation of T cells in the presence or absence of suppressors). It is also feasible to manipulate target cancer cells to express OVA, which can induce antigen-specific cancer cell killing by OT-1 T cells. Therefore, the assay will also enable investigation of the MAM/MDSC-mediated suppression of antigen-specific T cell activation. It is also possible to apply the assay to investigate human cells, as activation antibodies against human CD3 and CD28 are commercially available, and a protocol to isolate human TAMs from clinical samples has been established19.
Collectively, this assay is quite versatile and can be used to examine cytotoxicity of other immune cell types. Currently, in our labs, it is being extended to examine antigen-dependent cell cytotoxicity under various conditions and is also being developed for high throughput screening.
Disclosures
Loading...
$$\rightleftharpoonup{xx}$$
$$\longleftharp{xx}$$,
$$\longrightharp{xx}$$,
The authors have nothing to disclose.
Acknowledgements
Loading...
$$\rightleftharpoonup{xx}$$
$$\longleftharp{xx}$$,
$$\longrightharp{xx}$$,
This work was supported by grants from the Wellcome Trust (101067/Z/13/Z (JWP), 109657/Z/15/Z (TK), 615KIT/J22738 (TK), UK), and the MRC (MR/N022556/1 (JWP, TK), UK). NOC and DDS acknowledge support from the National Phenotypic Screening Centre Phenomics Discovery Initiative and Cancer Research UK (NOC)
Materials
| Name | Company | Catalog Number | Comments |
|---|---|---|---|
| 0.05% Trypsin EDTA (1X) | Gibco | 25300-054 | |
| 12-Well Cell Culture Plate | Freiner Bio-One | 665-180 | |
| 1x PBS | Gibco | 14190-094 | |
| 2-mercaptethanol | Sigma | M6250-10ML | |
| 5mL Plystyrene Round-Bottom Tube | FALCON | 352054 | |
| 96-Well Cell Culture Plate (Round Bottom ) | Costar | 3799 | Co-culture of CD8+T cells with sorted myeloid cells |
| 96-well plate (Flat bottom) | Nunc | 165305 | Co-culture of CD8+T cells with target cells for cytotoxicity assay |
| AF647 anti-mouse F4/80 Antibody | BIO-RAD | MCA497A647 | Clone: CIA3-1, Lot#: 1707, 2 μL/1x10^6 cells |
| AlexaFluor700 anti-mouse CD8 Antibody | Biolegend | 100730 | Clone: 53-6.7, Lot#: B205738, 0.5 μL/1x10^6 cells |
| anti-mouse CD28 Antibody | Biolegend | 102111 | Activation of isolated CD8+ T cells, Clone: 37.51, Lot#: B256340 |
| anti-mouse CD3e Antibody | Biolegend | 100314 | Activation of isolated CD8+ T cells, Clone: 145-2C11, Lot#: B233720 |
| APC anti-mouse CD3 Antibody | Biolegend | 100236 | Clone: 17A2, Lot#: B198730, 0.5 μL/1x10^6 cells |
| APC/Cy7 anti-mouse Ly6C Antibody | Biolegend | 128026 | Clone: HK1.4, Lot#: B248351, 1 μL/1x10^6 cells |
| Bovine Serum Albmin | Sigma | A1470-100G | |
| Cell Strainer (100μm Nylon) | FALCON | 352360 | To smash the spleen |
| Cell Strainer (40μm Nylon) | FALCON | 352340 | To filter the lung digestion |
| DAPI | Biolegend | 422801 | |
| Dulbecco′s Modified Eagle′s Medium | Gibco | 41966-029 | |
| EasySep Mouse CD8+ T Cell Isolation Kit | StemCell Technologies | 19853 | |
| Fetal Bovine Serum | Gibco | 10270-106 | |
| FITC anti-mouse CD4 Antibody | Biolegend | 100406 | Clone: GK1.5, Lot#: B179194, 0.5 μL/1x10^6 cells |
| Geltrex Ready-to-Use | Gibco | A1596-01 | Coating the 96-well plates for cytotoxicity assay |
| IncuCyte NucLight Red Lentivirus Reagent | Essen BioScience | 4476 | Lenti viral particules encoding mKate2 |
| IncuCyte ZOOM | Essen BioScience | Detector (fluorescence microscope) | |
| IncuCyte ZOOM 2018A | Essen BioScience | Analysis software | |
| L-Glutamine (100X) | Gibco | A2916801 | |
| Lung Dissociation Kit | Miltenyi | 130-095-927 | Preparation of single cell suspension from the tumor-bearing lung |
| MycoAlert Mycoplasma Detection Kit | Lonza | LT07-318 | |
| Non-essential amino acid (100X) | Gibco | 11140-035 | |
| NucView488 | Biotium | 10403 | Fluoregenic caspase-3 substrate |
| PE anti-mouse Ly6G Antibody | Biolegend | 127607 | Clone: 1A8, Lot#: B258704, 0.5 μL/1x10^6 cells |
| PE/Cy7 anti-mouse CD11b Antibody | Biolegend | 101216 | Clone: M1/70, Lot#: B249268, 0.5 μL/1x10^6 cells |
| Pen Strep | Gibco | 15140-122 | Penicillin Streptomycin for primary culture of cells |
| PerCP/Cy5.5 anti-mouse CD45 Antibody | Biolegend | 103132 | Clone: 30-F11, Lot#: B249564, 0.5 μL/1x10^6 cells |
| Polybrene (Hexadimethrine bromide) | Sigma | H9268 | |
| Puromycin | Gibco | A11138-03 | |
| RBC Lysis Buffer (10X) | Biolegend | 420301 | |
| Recombinant murine IL-2 | Peprotech | 212-12 | Activation of isolated CD8+ T cells |
| Sodium pyruvate (100X) | Gibco | 11360-070 | |
| TruStain fcX (anti-mouse CD16/32) Antibody | Biolegend | 101320 | |
| : Nikon 10X objective (resolution 1.22 µm) : Green channel excitation: 440 - 480 nm : Green channel emission: 504 - 544 nm : Red channel excitation: 565-605 nm : Red channel emission: 625 - 705 nm | |||
References
Loading...
$$\rightleftharpoonup{xx}$$
$$\longleftharp{xx}$$,
$$\longrightharp{xx}$$,
- Barry, M., Bleackley, R. C. Cytotoxic T lymphocytes: all roads lead to death. Nature Reviews in Immunology. 2, 401-409 (2002).
- Durgeau, A., Virk, Y., Corgnac, S., Mami-Chouaib, F. Recent advances in targeting CD8 T-cell immunity for more effective cancer immunotherapy. Frontiers in Immunology. 9. , 14(2018).
- Tanaka, A., Sakaguchi, S. Regulatory T cells in cancer immunotherapy. Cell Research. 27, 109-118 (2017).
- Fleming, V., et al. Targeting myeloid-derived suppressor cells to bypass tumor-induced immunosuppression. Frontiers in Immunology. 9, 398(2018).
- Cassetta, L., Kitamura, T. Macrophage targeting: opening new possibilities for cancer immunotherapy. Immunology. 155, 285-293 (2018).
- Chahroudi, A., Silvestri, G., Feinberg, M. B. Measuring T cell-mediated cytotoxicity using fluorogenic caspase substrates. Methods. 31, 120-126 (2003).
- Zaritskaya, L., Shurin, M. R., Sayers, T. J., Malyguine, A. M. New flow cytometric assays for monitoring cell-mediated cytotoxicity. Expert Review of Vaccines. 9, 601-616 (2010).
- Azimi, M., et al. Identification, isolation, and functional assay of regulatory T Cells. Immunological Investigation. 45, 584-602 (2016).
- Bruger, A. M., et al. How to measure the immunosuppressive activity of MDSC: assays, problems and potential solutions. Cancer Immunology Immunotherapy. , (2018).
- Qian, B., et al. A distinct macrophage population mediates metastatic breast cancer cell extravasation, establishment and growth. PLoS One. 4, e6562(2009).
- Kitamura, T., et al. Monocytes differentiate to immune suppressive precursors of metastasis-associated macrophages in mouse models of metastatic breast cancer. Frontiers in Immunology. 8, 2004(2018).
- Bronte, V., et al. Recommendations for myeloid-derived suppressor cell nomenclature and characterization standards. Nature Communications. 7, 12150(2016).
- Kitamura, T., et al. CCL2-induced chemokine cascade promotes breast cancer metastasis by enhancing retention of metastasis-associated macrophages. Journal of Experimental Medicine. 212, 1043-1059 (2015).
- Ewens, A., Mihich, E., Ehrke, M. J. Distant metastasis from subcutaneously grown E0771 medullary breast adenocarcinoma. AnticancerResearch. 25, 3905-3915 (2005).
- Choppa, P. C., et al. Multiplex PCR for the detection of Mycoplasma fermentans, M. hominisandM. penetransin cell cultures and blood samples of patients with chronic fatigue syndrome. Molecular and Cellular Probes. 12, 301-308 (1998).
- Strober, W. Trypan blue exclusion test of cell viability. Current protocols in immunology. , Appendix 3:Appendix 3B (2001).
- Koyanagi, M., Kawakabe, S., Arimura, Y. A comparative study of colorimetric cell proliferation assays in immune cells. Cytotechnology. 68, 1489-1498 (2016).
- Gabrilovich, D. I., Nagaraj, S. Myeloid-derived-suppressor cells as regulators of the immune system. Nature Reviews in Immunology. 9, 162-174 (2009).
- Cassetta, L., et al. Isolation of mouse and human tumor-associated macrophages. Advances in Experimental Medicine and Biology. 899. 899, 211-229 (2016).
Reprints and Permissions
Request permission to reuse the text or figures of this JoVE article
Request Permission