

Summary
The goal of the study was to develop protocols to prepare consistent specimens for accurate mechanical testing of high-strength aramid or ultra-high-molar-mass polyethylene-based flexible unidirectional composite laminate materials and to describe protocols for performing artificial ageing on these materials.
Abstract
Many body armor designs incorporate unidirectional (UD) laminates. UD laminates are constructed of thin (<0.05 mm) layers of high-performance yarns, where the yarns in each layer are oriented parallel to each other and held in place using binder resins and thin polymer films. The armor is constructed by stacking the unidirectional layers in different orientations. To date, only very preliminary work has been performed to characterize the ageing of the binder resins used in unidirectional laminates and the effects on their performance. For example, during the development of the conditioning protocol used in the National Institute of Justice Standard-0101.06, UD laminates showed visual signs of delamination and reductions in V50, which is the velocity at which half of the projectiles are expected to perforate the armor, after ageing. A better understanding of the material property changes in UD laminates is necessary to comprehend the long-term performance of armors constructed from these materials. There are no current standards recommended for mechanically interrogating unidirectional (UD) laminate materials. This study explores methods and best practices for accurately testing the mechanical properties of these materials and proposes a new test methodology for these materials. Best practices for ageing these materials are also described.
Introduction
The National Institute of Standards and Technology (NIST) helps law enforcement and criminal justice agencies ensure that the equipment they purchase and the technologies that they use are safe, dependable, and highly effective, through a research program addressing the long-term stability of high-strength fibers used in body armor. Prior work1,2has focused on the field failure of a body armor made from the material poly(p-phenylene-2,6-benzobisoxazole), or PBO, which led to a major revision to the National Institute of Justice’s (NIJ’s) body armor standard3. Since the release of this revised standard, work has continued at NIST to examine mechanisms of ageing in other commonly used fibers such as ultra-high-molar-mass polyethylene (UHMMPE)4 and poly(p-phenylene terephthalamide), or PPTA, commonly known as aramid. However, all of this work has focused on the ageing of yarns and single fibers, which is most relevant for woven fabrics. However, many body armor designs incorporate UD laminates. UD laminates are constructed of thin fiber layers (<0.05 mm) where the fibers in each layer are parallel to each other5,6,7 and the armor is constructed by stacking the thin sheets in alternating orientations, as depicted in Supplemental Figure 1a. This design relies heavily on a binder resin to hold the fibers in each layer generally parallel, as seen in Supplemental Figure 1b, and maintain the nominally 0°/90° orientation of the stacked fabrics. Like woven fabrics, UD laminates are typically constructed out of two major fiber variations: aramid or UHMMPE. UD laminates provide several advantages to body armor designers: they allow for a lower-weight armor system compared to those using woven fabrics (due to strength loss during weaving), eliminate the need for woven construction, and utilize smaller diameter fibers to provide a similar performance to woven fabrics but at a lower weight. PPTA has previously been shown to be resistant to degradation caused by temperature and humidity1,2, but the binder may play a significant role in the performance of the UD laminate. Thus, the overall effects of the use environment on PPTA-based armor are unknown8.
To date, only very preliminary work has been performed to characterize the aging of the binder resins used in these UD laminates and the effects of binder aging on the ballistic performance of the UD laminate. For example, during the development of the conditioning protocol used in NIJ Standard-0101.06, UD laminates showed visual signs of delamination and reductions in V50 after ageing1,2,8. These results demonstrate the need for a thorough understanding of the material properties with ageing, in order to evaluate the material’s long-term structural performance. This, in turn, necessitates the development of standardized methods to interrogate the failure properties of these materials. The primary goals of this work are to explore methods and best practices for accurately testing the mechanical properties of UD laminate materials and to propose a new test methodology for these materials. Best practices for ageing UD laminate materials are also described in this work.
The literature contains several examples of testing the mechanical properties of UD laminates after hot-pressing multiple layers into a hard sample9,10,11. For rigid composite laminates, ASTM D303912 can be used; however, in this study, the material is approximately 0.1 mm thick and not rigid. Some UD laminate materials are used as precursors to make rigid ballistic protective articles such as helmets or ballistic-resistant plates. However, the thin, flexible UD laminate can also be used to make body armor9,13.
The objective of this work is to develop methods for exploring the performance of the materials in soft body armor, so methods involving hot pressing were not explored because they are not representative of the way the material is used in soft body armor. ASTM International has several test-method standards relating to testing strips of fabric, including ASTM D5034-0914 Standard Test Method for Breaking Strength and Elongation of Textile Fabrics (Grab Test), ASTM D5035-1115 Standard Test Method for Breaking Force and Elongation of Textile Fabrics (Strip Method), ASTM D6775-1316 Standard Test Method for Breaking Strength and Elongation of Textile Webbing, Tape and Braided Material, and ASTM D395017 Standard Specification for Strapping, Nonmetallic (and Joining Methods). These standards have several key differences in terms of the testing grips used and the specimen size, as mentioned below.
Methods described in ASTM D5034-0914 and ASTM D5035-1115 are very similar and focus on testing standard fabrics rather than high-strength composites. For the tests in these two standards, the jaw faces of the grips are smooth and flat, although modifications are allowed for specimens with a failure stress greater than 100 N/cm to minimize the role of stick-slip-based failure. Suggested modifications to prevent slipping are to pad the jaws, coat the fabric under the jaws, and modify the jaw face. In the case of this study, the specimen failure stress is approximately 1,000 N/cm, and thus, this style of grips results in excessive sample slippage. ASTM D6775-1316 and ASTM D395017 are intended for much stronger materials, and both rely on capstan grips. Thus, this study focused on the use of capstan grips.
Further, the specimen size varies considerably among these four ASTM standards. The webbing and strapping standards, ASTM D6775-1316 and ASTM D395017, specify to test the full width of the material. ASTM D677516 specifies a maximum width of 90 mm. In contrast, the fabric standards14,15 expect the specimen to be cut widthwise and specify either a 25 mm or 50 mm width. The overall length of the specimen varies between 40 cm and 305 cm, and the gauge length varies between 75 mm and 250 mm across these ASTM standards. Since the ASTM standards vary considerably regarding specimen size, three different widths and three different lengths were considered for this study.
The terminology referring to specimen preparation in the protocol is as follows: bolt > precursor material > material > specimen, where the term bolt refers to a roll of UD laminate, precursor material refers to an unwound amount of UD fabric still attached to the bolt, material refers to a separated piece of UD laminate, and specimen refers to an individual piece to be tested.
Subscription Required. Please recommend JoVE to your librarian.
Protocol
1. Cutting procedure for warp-direction specimens that are cut perpendicular to the axis of the roll
- Identify a bolt of unidirectional material to be tested.
NOTE: There is no warp (used to describe the direction perpendicular to the axis of the roll) and weft (used to describe the direction parallel to the axis of the roll) in the traditional textile sense, as the material used here is not woven, but these terms are borrowed for clarity. - Manually unroll the bolt to expose the precursor material (i.e., the identified material unwound from the bolt but still connected to the bolt).
NOTE: The width of this bolt will become the material’s total length (refer to Supplemental Figure 1b), so for a 300 mm gauge length (corresponding to a 600 mm total specimen length), using the procedure and testing grips specified below, the piece of material cut from the bolt should be 600 mm wide. The length of this piece of material will be that of the width of the bolt on which the material is rolled (approximately 1,600 mm, in this case). This is depicted in Supplemental Figure 1b. - Visually verify that the principal fiber direction is parallel to the width of the bolt, as shown in Supplemental Figure 1b. The fiber direction of the top layer of the material (i.e., that which a viewer sees when looking down onto the specimen) is termed the principal fiber direction.
- Cut a small tab in the precursor material with a scalpel, approximately 3 mm wide, with the tab’s length aligned nominally parallel with the principal fiber direction of the precursor material, as shown in Supplemental Figure 1c.
- Manually grasp the tab and pull it up to tear the tab away and expose the fibers on the layer underneath, running perpendicular to the tab. Keep pulling on the tab until the two layers have been separated across the whole length of the precursor material (Supplemental Figure 1d).
NOTE: This step will produce a region where only cross fibers are visible, as shown in Supplemental Figure 1d. - Remove any loose fibers neighboring the exposed cross fibers remaining from the edge of the tab.
NOTE: In the current UD laminate system, it was observed that the fibers are not perfectly parallel (as shown in Figure 1) and that they may cross over neighboring fibers. Thus, fibers neighboring those being separated will frequently become separated in this process. The neighboring fibers that become loose may be as much as 1–2 mm away from the expected path of the tab used for separation. - Using a medical scalpel, cut along the exposed cross fibers, thus separating the piece of precursor material from the bolt.
- Determine the distance cut that dulls the blade, causing a less clean cut (i.e. after 400 cm of cutting this material, a scalpel could become dull and scratched, as shown in Supplemental Figure 2 and Supplemental Figure 3). Replace the blade before it becomes dull, or if it is damaged. Examine several cutting instruments when testing a different type of material to determine the best one.
CAUTION: Care must be taken with all sharp blades or cutting tools to avoid injury. Cut-resistant gloves may be worn in this step to reduce the risk of injury.
- Determine the distance cut that dulls the blade, causing a less clean cut (i.e. after 400 cm of cutting this material, a scalpel could become dull and scratched, as shown in Supplemental Figure 2 and Supplemental Figure 3). Replace the blade before it becomes dull, or if it is damaged. Examine several cutting instruments when testing a different type of material to determine the best one.
- Turn over the material, so that now, the principal fiber direction is in the warp direction.
NOTE: Since the principal fiber direction refers to the layer that is being viewed (the top layer), turning the material over will change the principal fiber direction from weft to warp (see Supplemental Figure 1b). - Mark the grip lines on the material aligned in the weft direction.
NOTE: These lines run from manufactured edge to manufactured edge, parallel to the cut edges and 115 mm from these cut edges. These will be further explained in step 4.4.1, but the grip lines are lines used when loading specimens (which are cut later) into the tensile testing grips. - Determine the principal fiber direction for the specimen to be cut from the material, using step 1.3.
NOTE: Be aware that fiber orientation may not be exactly perpendicular to the manufactured edge; in that case, follow the exact fiber line. Avoid the area near the manufactured edge because it may not accurately reflect bulk material properties. - Orient the material on a suitable self-healing gridded cutting mat that is large enough to fit the width of the material (between the cut edges) and a length (weft direction) of at least 300 mm, as referenced in step 1.16.
- Carefully align the fiber direction with the gridlines on the cutting mat. Use the cut edge of the material as a guide in lining up the material; however, aligning the fiber direction of the specimen is most important.
- Tape the material to the cutting mat.
NOTE: Tape should never be placed anywhere near the center of the specimen; instead, it should be used at what will be the ends of the specimens to be cut from the material. The ends will be in the grips when a specimen is tested; therefore, any damage caused to the material by the tape is minimized. Taping only the corners of the material that are far from the cut will ensure that the material will not move and that, when cutting a specimen, the blade will not also be cutting tape. Low-tack adhesive tape (e.g., painter’s tape) works well because it adheres well enough to keep the fabric in place without damaging the material when it is removed.
- Cut the specimens from the material using the blade and a straight edge. The strips formed are the specimens. Do not let the material move in this process; otherwise, determine the fiber direction anew and reorient the material accordingly.
- Place the straight edge at the desired location corresponding to the appropriate specimen width (i.e., 30 mm). Note that the medical scalpel is thin enough that no offset in the placement of the straight edge is necessary to account for the cutting location. Align the straight edge to the grid on the cutting mat or any other user-established reference line on the cutting mat.
- Clamp the straight edge in place by clamping on either end of the straight edge. Check the positioning of the straight edge after clamping, as it may have moved during the clamping process.
- Cut the specimen away from the material along the straight edge, using the medical scalpel. Ensure a single, clean, smooth cut, with a constant velocity and pressure.
NOTE: Some pressure can be applied by the blade against the straight edge to keep the blade cutting precisely at the edge of the straight edge.
CAUTION: Care must be taken to avoid injury, so it is advisable to wear cut-resistant gloves when handling the medical scalpel. Furthermore, since the smoothest cut can be obtained while cutting toward the body, wearing a cut-resistant apron or lab coat is advised. - Examine the cut edge of the strip under the microscope. Change the blade if the cut edge has significantly more protruding fibers or other defects when compared to a cut made with a new, sharp blade.
- Unclamp the straight edge, taking care that the material does not move in the process. If the material did move, redetermine the fiber direction and reorient the material appropriately.
- Repeat steps 1.12–1.15 until the maximum number of specimens that can be cut from 300 mm of material has been obtained.
NOTE: For specimens with a width of 30 mm, 300 mm of material is equivalent to 10 specimens, while for specimens with a width of 70 mm, this is equivalent to 4 specimens. This 300 mm limit has been determined to work well for the unidirectional laminate studied here but may vary for other laminates. - Repeat steps 1.10–1.11 as needed (i.e., redetermine the principal fiber direction and reorient the material before continuing to cut more specimens).
NOTE: The protocol can be paused here. If specimens are not to be used immediately, store them in a dark, ambient location.
2. Cutting procedure for weft-direction specimens that are cut along the axis of the roll
NOTE: There is no warp and weft in the traditional textile sense, as the material used here is not woven, but these terms are borrowed for clarity.
- Determine the width and length of the material desired according to the number and size of the specimens to be cut.
NOTE: For this unidirectional laminate and for specimens with a gauge length of approximately 300 mm, two specimens placed end to end can be cut along the width of the bolt. Thus, a set of 40 specimens may be cut out in two columns of 20 specimens each, as shown in Supplemental Figure 4, prior to severing the material from the roll. If the width of the specimens is 30 mm, then the material should be cut at 20x the specimen’s width (as there are 20 specimens per column) with some extra space (i.e., 610 mm).- Determine the fiber direction along the weft for the width of interest, following the instructions from steps 1.4–1.6.
- Cut the exposed cross fibers (i.e., across the warp fibers) using a blade, thus separating the precursor material from the bolt.
CAUTION: Care must be taken with all sharp blades or cutting tools, to avoid injury. Cut-resistant gloves may be worn in this step to reduce the risk of injury.
- Prepare to cut off lengths that match the desired specimen length (i.e., cut in the warp direction at the specimen length of interest). To obtain a 300 mm gauge length (corresponding to a 600 mm total specimen length), using the procedure and testing grips specified below, keep in mind that the material should now be 600 mm x 610 mm.
- Follow steps 1.9–1.17 to cut out the desired specimens.
NOTE: The protocol can be paused here. If the specimens are not to be used immediately, store them in a dark, ambient location.
3. Analysis of cutting methods by scanning electron microscopy
- Prepare the samples for an analysis by scanning electron microscopy (SEM) by cutting squares of approximately 5 mm in length and width, preserving at least two edges of the square from the cutting technique of interest. These preserved edges should be identified and are the edges that will be evaluated under the microscope.
- Mount the samples on the SEM sample holder by adhering them with tweezers onto suitable double-sided carbon tape.
- Coat the samples with a thin (5 nm) layer of conductive material, such as gold palladium (Au/Pd), to mitigate surface-charging effects under the scanning electron microscope.
- Load the samples into a scanning electron microscope and image them at about 2 kV of accelerating voltage and with a 50–100 pA electron current. Apply charge neutralization settings to counter charging effects where necessary.
4. Tensile testing of UD laminate specimens
- Measure the grips to determine the difference between the crosshead initial location value and the distance between where the specimen contacts the top and bottom grips under minimal tension. Read the crosshead location from the testing software. Calculate an effective gauge length from this by measuring the effective gauge length at this crosshead location. Add the offset (amount of displacement) to the crosshead location to determine the effective gauge length (the measured effective gauge length minus the crosshead location).
- Number the specimens prepared according to sections 1 and 2 with a soft-tipped permanent marker so the order in which they were prepared is clear. Mark other information as well, such as the date of preparation and orientation.
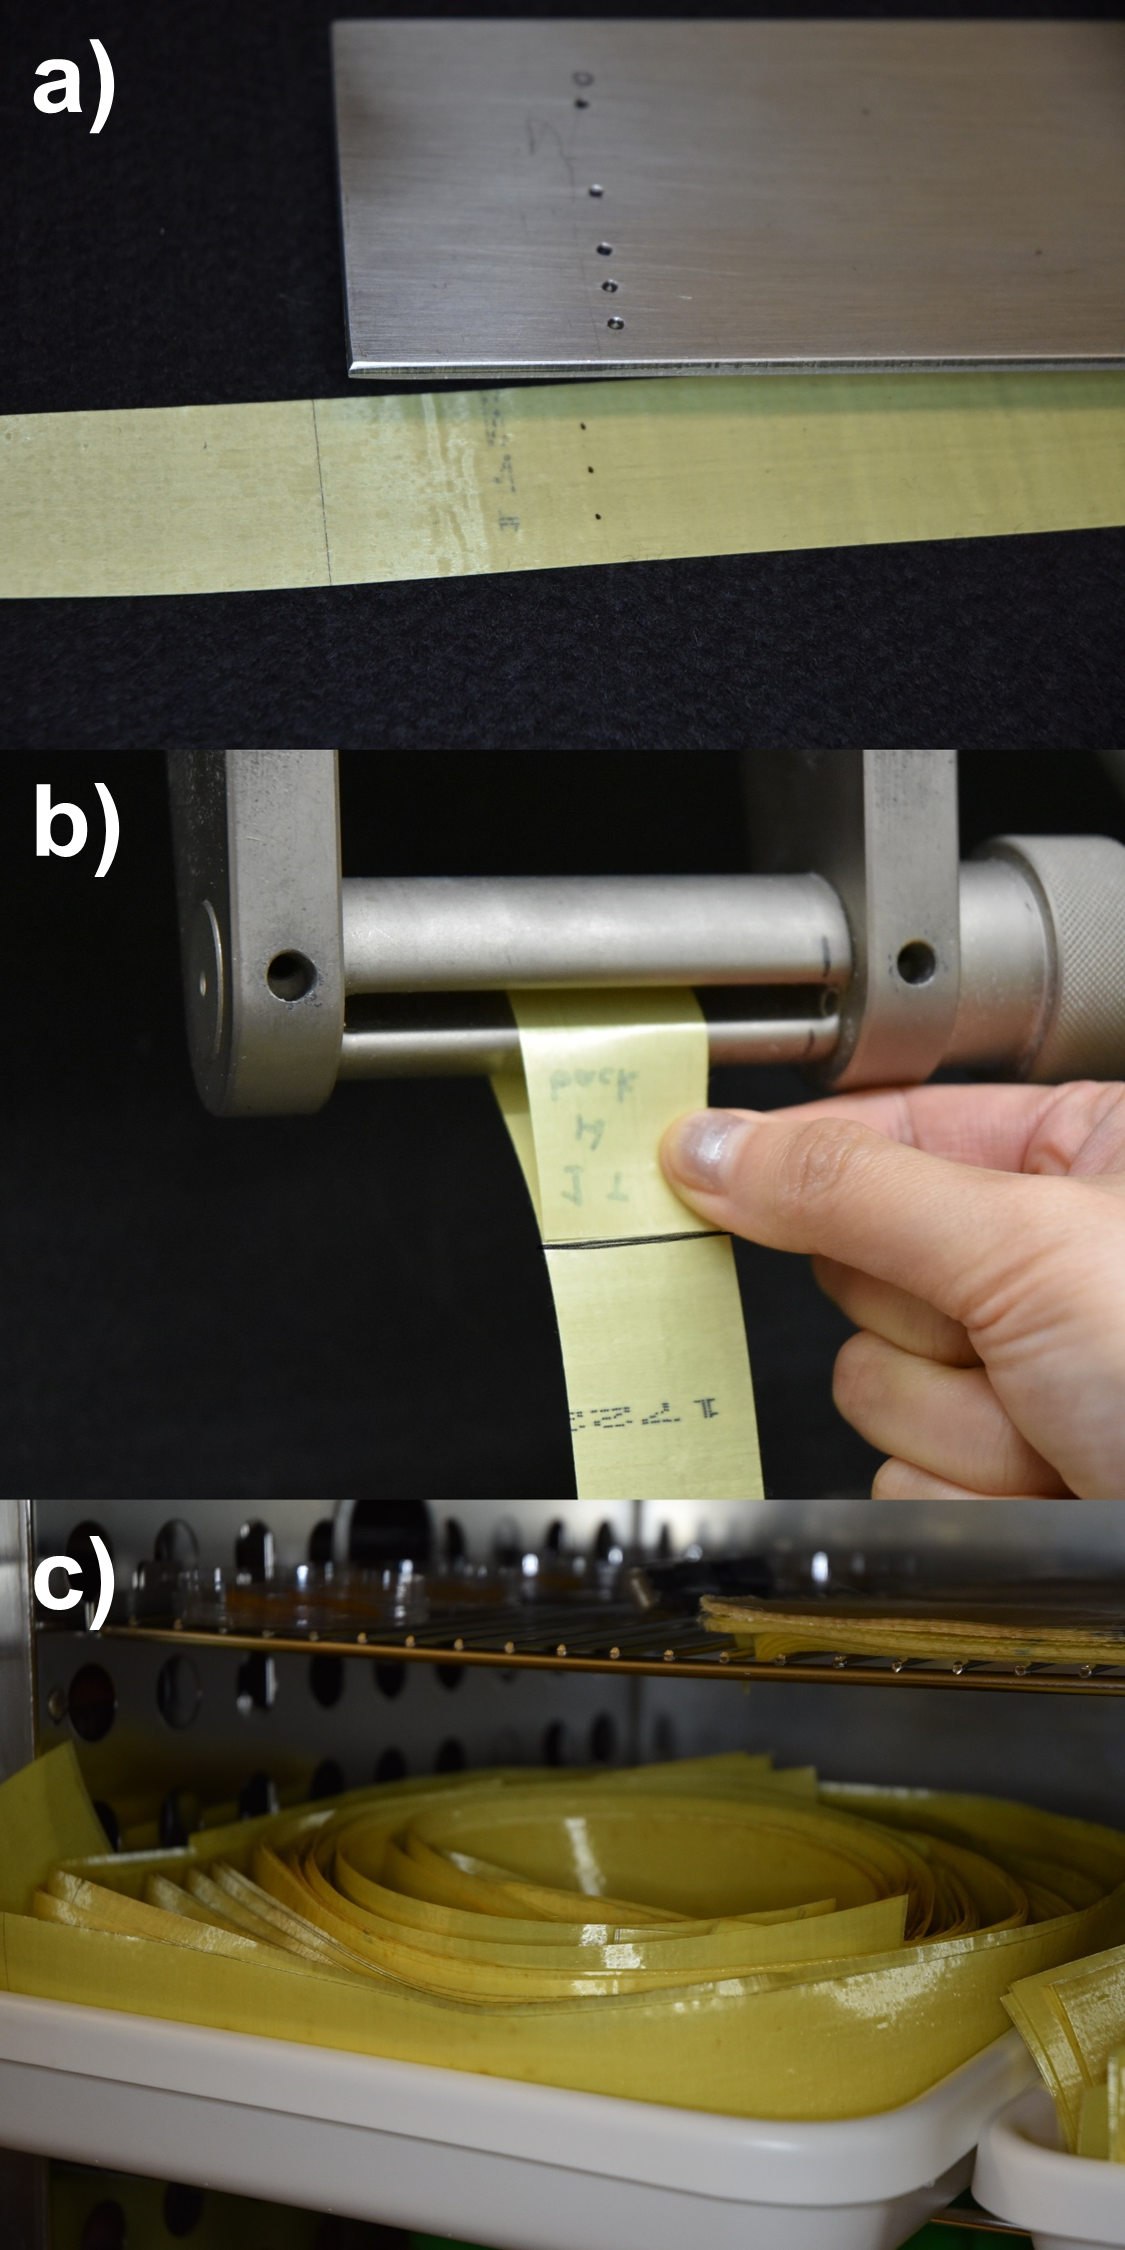
NOTE: The specimens used herein have dimensions of 30 mm x 400 mm—but sample dimensions may vary for other materials—and were obtained by following either section 1 or section 2. If the specimens are not to be used immediately, store them in a dark, ambient location. - If the strain will be measured using a video extensometer, manually mark the gauge points with a permanent marker, using a template for consistency, as shown in Supplemental Figure 5a, to give points for the video extensometer to track and, thus, measure strain. If the strain will be calculated from the crosshead displacement, skip this step.
- Load the specimen into the center of the capstan grips.
- Insert the end of the specimen through the gap in the capstan and position the end of the specimen at the grip line drawn in step 1.9, as shown in Supplemental Figure 5b. Take care to center the specimen on the capstan grips by aligning the center of the specimen within approximately 1 mm of the center of the capstan grips.
- Turn the capstan to the desired position, making sure to keep the specimen centered. Use a tensioning device—for example, a magnet placed on the specimen if the grips are magnetic—to gently hold the specimen in place, and lock the capstan in place with the locking pins.
- Repeat steps 4.4.1 and 4.4.2 for the other end of the specimen.
- Apply a preload of 2 N, or some other suitably small load.
- Record the crosshead displacement/actual gauge length.
- Program the instrument to perform the tensile test, at a constant rate of extension of 10 mm/min, using the video extensometer or crosshead displacement to record the strain, and press start to begin the test.
- Monitor the display and stop the test when the sample has broken, as evidenced by a loss of 90% in the observed load on the display. Record the maximum stress, which is the same as the failure stress due to the nature of the material, and the corresponding failure strain. Repeat steps 4.3–4.8 for the remaining specimens.
- Save the broken specimens for further analysis.
- Check for stress at failure as a function of specimen number and original specimen placement in the material, as well as other indications of problematic data, for instance, data points that deviate extremely from the Weibull18 distribution, and investigate possible causes, such as samples damaged during preparation or handling, before continuing.
5. Preparation of specimens for ageing experiments
- Beginning an ageing experiment
- Calculate the total amount of material needed for the study per environmental condition and based on a specimen extraction plan of every month for 12 months.
NOTE: For this study, 40 specimens per extraction and a total of 12 extractions were used for planning purposes. - Cut the total amount of material needed for each condition. Cut each strip wide enough to accommodate the required number of specimens plus at least 10 mm.
NOTE: An extra 5 mm of material will be trimmed from each side of the specimen before performing tensile testing. The extra material is used because the edges of the samples may be damaged due to handling during the ageing protocol. - Place the cut ageing strips in trays to be placed in the environmental chamber as shown in Supplemental Figure 5c. The trays used in this study could each hold approximately 120 strips.
- Select exposure conditions for the environmental study based on the expected use and storage environment of the material2.
NOTE: In this study, nominally 70 °C at 76% relative humidity (RH) was used. - Program an environmental chamber for dry, room temperature conditions (e.g., about 25 °C at 25% RH). Allow the chamber to stabilize at these conditions and, then, place the sample tray on a rack in the chamber, away from the walls and any locations in the chamber that appear to attract condensation.
- Program the environmental chamber to the desired temperature as determined in step 5.1.4, leaving the humidity about 25% RH.
- Once the chamber has stabilized at the target temperature from step 5.1.4, program the chamber to increase the humidity to the desired level as determined in step 5.1.4.
- Check the chambers daily to ensure that water supply and filtration are adequate, and note when out-of-tolerance conditions are observed. Recording deviations and interruptions in a log on the front of each chamber or in a nearby notebook is a good practice.
- Repeat steps 5.1.5–5.1.8 for all other specimens of interest.
- Calculate the total amount of material needed for the study per environmental condition and based on a specimen extraction plan of every month for 12 months.
- Extracting aged material strips for analysis
- When ready to extract the aged material strips from an environmental chamber for analysis, first program the chamber to decrease the relative humidity to approximately 25% RH.
- After the environmental chamber has stabilized at the low-humidity condition, program the temperature to drop to, approximately, room temperature or 25 °C. This step prevents condensation when the chamber door is opened.
- Once the environmental chamber has stabilized at the conditions of step 5.1.5, open the chamber, remove the tray containing the aged material strips of interest, take out the desired strips, and place them in a labeled container.
- Return the tray to the environmental chamber.
- Following the procedure given in steps 5.1.6 and 5.1.7, return the chamber to the conditions of interest, if continuing the ageing study. If not, then it may remain at the nominally ambient state.
- Record the extraction on the chamber log, if one is being used.
- Cut the aged specimens from the aged material strips, following steps 1.7–1.17.
- Test the specimens as described in section 4.
Subscription Required. Please recommend JoVE to your librarian.
Representative Results
Many iterations of cutting and testing were performed to investigate several different variables. Some variables that were examined include the cutting technique and cutting instrument, the testing rate, the specimen dimension, and the grips. One critical finding was the importance of aligning the specimens with the fiber direction. Data analysis procedures (consistency analysis, Weibull techniques, outlier determination, etc.) are discussed below, as are considerations for ageing.
Cutting technique/instrument
The cutting instrument may influence the measured failure stress because of the various levels of precision associated with each type of cutting instrument. The specimens referenced in Figure 2, Figure 3, and Figure 4 were all cut with an electrically powered fabric cutter. In contrast, all other specimens were cut using the procedure outlined above in section 1 of the protocol, and the results for these specimens are presented in Figure 8 and Figure 10. The specimens cut with the powered fabric cutter had an average failure stress of 872 MPa (standard deviation of 46 MPa, 102 specimens), while similarly sized specimens cut with a medical scalpel had an average failure stress of 909 MPa (standard deviation of 40 MPa, 40 specimens). These results are not surprising, as a closer examination of the edges of the specimens shows that the powered fabric cutter saw creates a much more jagged edge than the scalpel, as seen in Figure 5, effectively narrowing the width of the specimen.
The difference in mechanical performance between specimens cut using these two cutting tools led to a structured investigation of various cutting tools. Specimens were cut using each tool and then imaged. Figure 6, Figure 7, and Supplemental Figure 7 show the resulting edges at high magnification, and Supplemental Figure 8 at lower magnification, for a) an electrically powered fabric cutter, b) a ceramic knife, c) a precision ceramic cutter, d) a rotary blade, e) a utility knife, and f) a medical scalpel.
There appear to be both localized areas of damage and broader regions of damage exhibited in these images. The most localized damage is observed when fibers protrude from the frayed fiber edges or the edge of the fiber is bent and flattened by the blade as in Figure 6a. The broader regions of damage are observed as shearing and potential debonding, which occur in the cross fibers.
Figure 6 and Figure 7 show that the use of the scalpel provides the cleanest cut with the most localized damage, as Figure 6f and Figure 7f depict cleaner cuts than seen in the other panels of Figure 6 and Figure 7. The cross fibers show no evidence of the fibers shearing due to the cut, and the damage at the end of the cross fibers is restricted to approximately half the fiber diameter. The utility knife creates a slightly larger damaged zone; however, the resulting fiber cross sections are cleaner than those utilizing cutting methods other than the scalpel. All the other cutting methods create localized damage to an extent greater than one fiber diameter. Both the scalpel and the utility knife are sharp enough to split a fiber along its length and can result in a slightly ragged edge, as seen in Figure 5f,g. This is in contrast to Supplemental Figure 7d, where the precision ceramic cutter damages the edge fibers by flattening them instead of cutting through them. Slicing through the edge fiber does not result in a large damaged zone in the bulk of the specimen, which would be created if an edge fiber were to be pulled out.
Figure 5, Figure 6a, and Supplemental Figure 7b show typical damage due to the electrically powered fabric cutter. It creates an extremely frayed edge at a variety of length scales. The ceramic utility knife cuts in small sections, causing large-scale delamination and shear in groups of fibers, as can be seen in Figure 6b and Figure 7c. This is less prevalent with the precision ceramic cutter, although those results are not devoid of uneven cuts and frayed fibers, as seen in Supplemental Figure 8e. Cuts made with the rotary blade are not as straight as the other cutting methods (as seen in Supplemental Figure 7e, Supplemental Figure 8f,g, and Figure 7a,b) and can have large-scale fiber pullout (Supplemental Figure 7e). The images of cuts made by the utility knife and medical scalpel show little evidence of large-scale shear, delamination, or fiber pullout, as seen in Figure 6e,f, Figure 7e,f, and Supplemental Figure 7g,h. Comparing Supplemental Figure 8h with Supplemental Figure 8i, the medical scalpel does result in a better edge than the utility knife, with fewer frayed fibers sticking out, although for both methods, such fibers are only observed occasionally.
When cutting precision samples for an examination by SEM, the scalpel gives the best performance. The ceramic utility knife pulls at the fibers at the beginning and ends of cuts, as does the precision ceramic cutter. The metal utility knife introduces maximum fiber pulls at the beginning of a cut. Cutting smaller sample pieces with either the powered fabric cutter or the rotary blades can be challenging and is impractical.
The medical scalpel is the most precise in cutting nearest to the straight edge. The precision ceramic cutter has a large offset from the straight edge, in contrast, leading to more error in cutting a precise width of specimen. The rotary fabric cutter does not always cut the material but, instead, folds it at the point of the blade. The electric fabric cutter cannot be used against a straight edge, so it is difficult to make a perfectly straight cut with this tool. Thus, the medical scalpel tends to give the straightest cut nearest to the straight edge. It is also recommended that the cutting blade is replaced if it becomes nicked or damaged, or if the cut edges on the specimens no longer appear smooth when compared under a microscope to the edges cut with a fresh blade.
Importance of aligning specimens with fiber direction
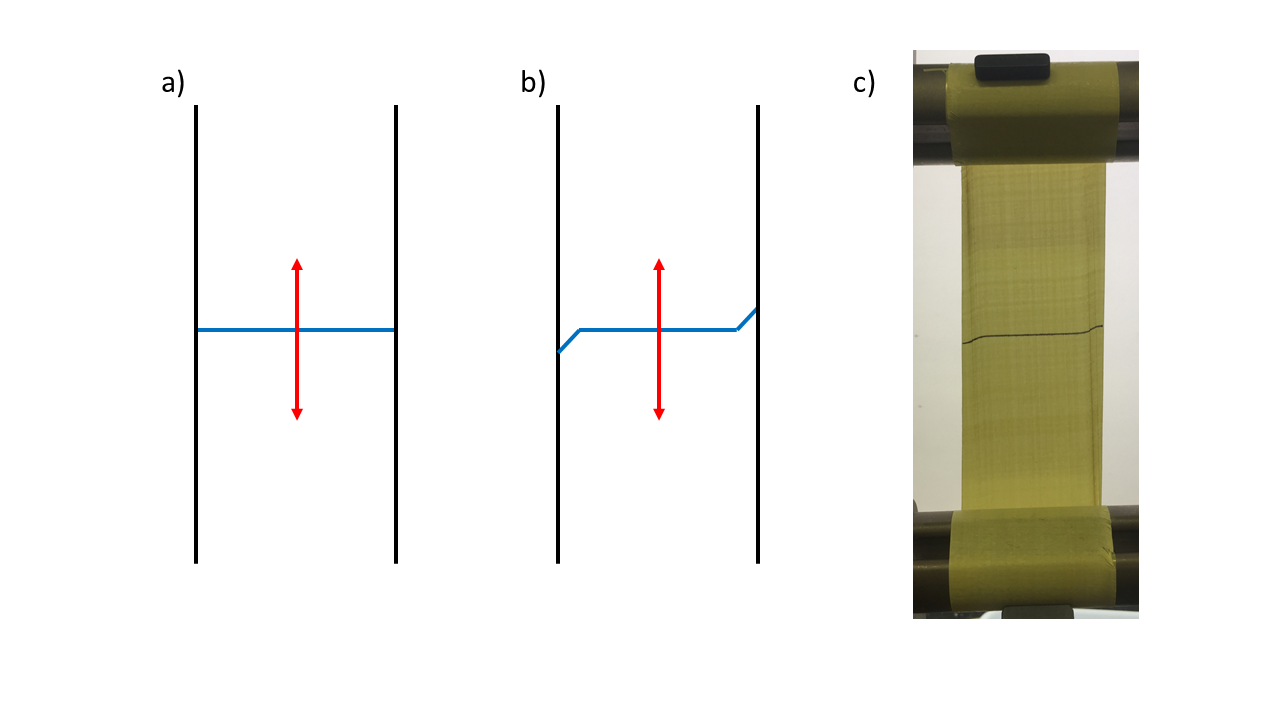
An early set of tests consisted of 40 specimens that were cut using the electrical fabric cutter and had a width of 25 mm and a gauge length of 150 mm. These specimens were tested at a displacement loading rate of 40 mm/min, using the nonoptimized initial grip design. The testing showed that specimens 1 through 20 were well aligned with the fiber direction, while specimens 21 through 40 were accidentally misaligned by less than 2° (i.e., the fiber direction was not parallel to the main length direction of the specimen). When a specimen is misaligned, a characteristic behavior is observed during the test. One side of the specimen will shear upward while the opposite side shears downward, such that a line that was drawn straight across the specimen before testing will no longer be straight. This is depicted in Supplemental Figure 6 and is due to the edge fibers not being in both capstans.
Due to the misalignment of specimens 21 through 40, there is a distinct difference between the maximum stress (occurring at failure) of specimens 1 through 20 as compared to specimens 21 through 40, as can be seen in Figure 2. Figure 2a presents the maximum stress (occurring at failure) as a function of the specimen number for the misaligned specimens. A homogeneous population of maximum stress would be evenly distributed across the whole area, as in Figure 2b. However, in Figure 2a, there are no data in the first and third quadrants, other than one outlier in quadrant 3, marked as specimen number 13. Figure 2c is a Weibull plot of the two groups and includes the 99% confidence bounds for the associated Weibull distributions. The distributions from the first 20 specimens, group 1, and the second 20 specimens, group 2, are again different, with specimens 1 through 20 exhibiting a higher stress-to-failure than specimens 21 through 40. This observation is further clarified in Figure 2d, where the outlier specimen, number 13, has been removed. In Figure 2d, only one data point barely overlaps with the 99% confidence bounds of the other group; otherwise, there is no overlap in the data.
A misalignment of the specimen with the fiber direction of the material has been shown to give deceptively weaker results, as the misalignment effectively narrows the specimen width. This can be avoided by frequently determining the fiber direction during cutting, taking care to prevent the material from shifting, and measuring from a fixed point on the cutting mat (as compared to the specimen edge) when cutting the specimens. A misalignment can be observed experimentally during testing through its characteristic distortion pattern, as shown in Supplemental Figure 6. If the specimens are all equally misaligned, the effect will be mostly in the Weibull scale parameters. In contrast, if the specimens are randomly misaligned, both the Weibull shape and scale parameters will be affected.
Theory
When tested in tension along the fiber direction, UD laminates can be assumed to behave similarly to a fiber tow, comprised of parallel fibers in a matrix. When a fiber breaks, it will redistribute its load over neighboring fibers over some width and length, and a useful model could be built around the concept of a chain of small bundles of filaments, where the surviving filaments share the load equally. So inevitably, fiber strength properties and strip properties are related, as described by Coleman19–23. A detailed discussion of applicable theory can also be found in Phoenix and Beyerlein24, and the time-dependent properties of fibers were addressed by Phoenix and Newman25, 26. This theory develops a Weibull failure distribution starting from the assumption that the occurrence of natural, inherent flaws along a fiber is well described by a Poisson-Weibull model. From this, a size effect naturally falls out. Simply put, the larger the volume of material, the lower the failure stress. This is due to the fact that, in a larger volume of material, there is a higher probability that the natural, inherent flaws in the fibers will collocate, creating a weak spot, and thus, lowering the failure stress.
Testing rate
Table 1 shows a comparison of results using three different loading rates. As the loading rate increases, the failure stress also increases. There does not appear to be an effect on the failure strain, so the modulus also appears to increase with an increasing loading rate.
The advantage of testing at different loading rates is that the tests interrogate different aspects of the composite. Slow tests are more reliant on the matrix properties, particularly matrix shear creep, while fast tests primarily explore fiber failure stress25, 26. It is important in choosing a loading rate to pick one that captures the behavior of interest.
Specimen width
Table 2 shows the effect of increasing the specimen width. By increasing the specimen width, the edge effects from cutting should become less important as they take up less of the specimen width. Also, any inaccuracies in measuring the width of the specimens become less important. The increased consistency with increased specimen width is observed in the decrease of the standard deviation of the failure stress. At a width of 10 mm, the mean failure stress is lower, and the standard deviation is higher than that of wider specimens, suggesting that narrow specimens can suffer from significant edge effects. The failure strain decreases with increasing width, perhaps also due to the lessened impact of edge effects.
The wider the specimen width, the smaller the influence will be from edge effects and, therefore, the increased consistency of the specimens. Thus, wider specimens yield better results. However, there is a trade-off in terms of material expense and the cost of grips to test wider, and thus stronger, specimens.
As discussed above, theory predicts a decrease in failure stress with increasing width24. This is noted when comparing the specimens that are 30 mm with the 70 mm-wide specimens. The large decrease in failure stress of the 10 mm-wide specimens is probably due to the increased significance of edge effects at such narrow widths.
Specimen length
As previously discussed, the theory predicts a decrease in failure stress with increasing length24. The results presented in Table 3 show this but are also confounded by the loading rate being constant at 10 mm/min, rather than holding the strain rate constant. Decreasing the strain rate (as happens with a fixed loading rate of 10 mm/min and an increasing gauge length) also causes a decrease in failure stress. The standard deviation for the failure stress increases more than can simply be explained by the different strain rates. This phenomenon could be because longer specimens are more difficult to cut, and edge fibers invariably get cut somewhere along the edge length, effectively reducing the width of the specimen in a random way. Specimens longer than the length of the cutter’s arm are particularly difficult, as it no longer becomes possible to cut them with a single smooth cut with constant velocity. The decrease in the failure strain as the length increases indicates that not all the decrease in failure stress is due to the slower strain rate for longer specimens.
Specimens tested to failure with a gauge length of 100 mm typically show delamination throughout the entire gauge length of the specimen. Specimens tested to failure with a gauge length of 900 mm, exhibit delamination occurs only in a region (typically near the middle) of the gauge, leaving a sizeable portion of the specimen intact, as could be expected from a chain-of-bundles model.
Grips
The grips should be in capstan style. Rotating capstans provide more ease in loading, and only four locking positions for the capstan helps ensure consistency. Capstan grips that close and clamp on the material can be used on exceedingly high-strength slippery materials. However, the fixed opening capstans used in this study work for both UHMMPE and aramids.
A study was done comparing two different types of capstan grips, using a different material. For the first set, the capstan was fixed, and the specimen was not aligned with the load cell but, instead, offset by half the width of the capstan. The second set consisted of rotating capstans with pins to lock them in place during testing. Furthermore, these capstans were offset to align the specimen with the load cell and, thus, prevent a moment on the load cell during loading. The failure load distributions were very similar for these grips, as shown in Figure 8. The rotating grips may give a marginally weaker distribution than the fixed grips, likely due to their wider radius capstan and, thus, longer load transfer length. Furthermore, the fixed grips may have a marginally larger variance than the rotating grips, as there is a higher likelihood of damaging the specimen during loading when the capstans are fixed due to the difficulties in wrapping the specimen around the capstans. The difference between these grips is evident when comparing load vs. extension plots. The results from ten representative specimens are shown in Figure 9 for the fixed and rotating grips. The curves for the rotating grips are smooth and consistent, while in contrast, the fixed grip curves frequently show that the specimens were slipping. When the capstans are fixed in place, it becomes challenging to tighten down on the material, as several wraps are required to prevent the specimen from slipping through the grips entirely.
Data analysis
There is a certain amount of variability inherent in UD laminate materials. The goal of the cutting/testing procedure presented herein is to minimize the additional variability added in specimen preparation and testing. Outlying data points could either be attributed to the inherent distribution of the UD laminates or could be a cutting/testing artifact. The following paragraphs discuss a few techniques to separate the artifacts from the distributions.
Failure stress as a function of specimen number
A plot of the failure stress as a function of specimen number can show general trends in a group of specimens. Unless the material is variable on the macro scale, the inherent variability of the material should not be observed on such a plot. Figure 2b shows an example of a group of self-consistent specimens, in contrast to Figure 2a.
This lack of consistency amongst specimens may not be evident in other analyses. Returning to the example of the misaligned specimens, the difference in failure stress is clear from Figure 2. However, it is not clear from looking at the data for specimens 1 through 40. This is shown in Figure 3, a Weibull plot with 99% confidence bounds for specimens 1 through 40. There is no obvious indication in Figure 3 that the cutting was inconsistent. Furthermore, the failure strains for these same specimens, plotted in Figure 4 as a function of specimen number, also show no evidence of the misalignment/lack of consistency, while the failure stresses do, as shown in Figure 2a.
Weibull distribution and outliers
Given the nature of this UD laminate material, it is expected to have a Weibull failure stress distribution19–26. This distribution is expected to have a shape parameter that is considerably higher than the associated shape parameter for a single fiber, due to the load-sharing among fibers24–26. Standard statistical tests can be performed to determine if the failure stress of a batch of specimens is well described by a Weibull distribution.
With the Weibull distribution, a certain number of low-strength specimens are expected. This makes the determination of outliers more difficult than if the data were from a normal distribution. For example, in Figure 9c, the specimen giving a datum in the lower left quadrant appears to be an outlier. Figure 9b presents the same data, only without the potential outlier identified in Figure 9a. Suspect data points should be investigated, particularly those that fall outside the 95% maximum likelihood confidence interval.
Ageing
Table 4 presents the ageing results for specimens 30 mm wide with an effective gauge length of 300 mm, tested at a loading rate of 10 mm/min. These results show no effects of ageing. PPTA has previously been shown to be resistant to degradation caused by temperature and humidity1, 2. Thus, it is not particularly surprising that tensile tests at this strain rate, where the matrix does not play a major role, do not show significant degradation over time, for the period allowed for this ageing experiment.
In summary, the cutting technique can play a big role in the effective width of the specimen, so it is important to choose one that gives consistent results with a minimum of specimen damage. A medical scalpel was found to work best in this study. The type of grips can lead to misleading features in the stress-strain curves; thus, based on this study, rotating capstans are recommended. The loading rate, specimen width, and specimen length all affect the final strength value and must be chosen with care. In particular, the specimen width must be wide enough so that any fluctuations in cutting do not have an undue influence on the results, and the specimen length must be long enough that the specimen fails between the grips but not so long as to make it hard to cut. By holding all of the above constant, scientists can identify the effects of ageing.

Figure 1: SEM image of UD material, with red and blue lines following individual surface fibers to highlight nonparallel fibers. Please click here to view a larger version of this figure.

Figure 2: Plots of failure stress for aligned and misaligned specimens. (a and b) Plots of the failure stress of each specimen as a function of its specimen number. Panel a consists of 40 specimens of which group 1, specimens 1–20 and circled in red, are well aligned and group 2, specimens 21–40 and circled in blue, are misaligned with the fiber direction. Panel b consists of 40 well-aligned specimens. (c and d) Plots of the Weibull distributions of the two groups with 99% confidence bounds, showing a minimal overlap of the data points from group 2 with the bounds of group 1. Panel c shows an outlier. Panel d does not show specimen 13, which is an outlier as it is far away from the maximum likelihood estimate for the distribution. The specimens were about 25 mm wide, tested at nominally 40 mm/min, and cut with an electric fabric cutter. Please click here to view a larger version of this figure.

Figure 3: A Weibull plot of both group 1 and 2 (as described in Figure 2) together, showing 99% confidence bounds. Please click here to view a larger version of this figure.

Figure 4: A plot of the failure strain of each specimen as a function of its specimen number, for the same set of specimens as shown in Figure 2 and Figure 3. The specimens were about 25 mm wide, tested at a tensile displacement loading rate of approximately 40 mm/min, and cut with an electric fabric cutter. Please click here to view a larger version of this figure.

Figure 5: A jagged edge, typical of a cut made with the electrically powered fabric cutter. Please click here to view a larger version of this figure.

Figure 6: SEM images of the edges of the cross-cut fibers with insets of stereomicroscope images. The cut was made with (a) an electrically powered fabric cutter, (b) a ceramic knife, (c) a precision ceramic cutter, (d) a rotary blade, (e) a utility knife, and (f) a medical scalpel. Please click here to view a larger version of this figure.

Figure 7: Overview of the cut, produced by SEM images of the corners. SEM images of the corners, giving an overview of the cut produced by (a) an electrically powered fabric cutter, (b) a ceramic knife, (c) a precision ceramic cutter, (d) a rotary blade, (e) a utility knife, and (f) a medical scalpel. Please click here to view a larger version of this figure.

Figure 8: Weibull plot comparing the failure load for two different sets of capstan grips. Please click here to view a larger version of this figure.

Figure 9: Load vs. extension plots of 10 representative specimens. Testing performed using (a) fixed and (b) rotating capstan grips Please click here to view a larger version of this figure.

Figure 10: Failure stress distributions. Failure stress distributions plotted using Weibull scaling, for specimens with a gauge length of 300 mm, a width of 30 mm, loaded at 10 mm/min, and cut along the ‘warp’ direction, (a) including an outlier and (b) without outlier. Please click here to view a larger version of this figure.
| Loading rate (mm/min) | Failure stress (MPa) | Failure strain (%) | Young's Modulus (GPa) |
| 1 | 872 | 2.72 | 32.7 |
| (31) | (0.09) | (0.71) | |
| 10 | 909 | 2.79 | 32.9 |
| (40) | (0.12) | (0.78) | |
| 100 | 913 | 2.67 | 33.7 |
| (45) | (0.13) | (0.67) |
Table 1: Mean values, with standard deviations in parenthesis, showing the effects of varying the loading rate on specimens with a gauge length of 300 mm, 30 mm wide, and cut along the ‘warp’ direction, where each batch is at least 35 specimens.
| Width (mm) | Failure stress (MPa) | Failure strain (%) | Young's Modulus (GPa) |
| 10 | 874 | 2.80 | 32 |
| (53) | (0.13) | (1.30) | |
| 30 | 909 | 2.79 | 32.9 |
| (40) | (0.12) | (0.80) | |
| 70 | 897 | 2.68 | 33.6 |
| (32) | (0.09) | (0.50) |
Table 2: Mean values, with standard deviations in parenthesis, showing the effects of varying the width on specimens with a gauge length of 300 mm, a loading rate of 10 mm/min, and cut along the ‘warp’ direction, where each batch is at least 35 specimens.
| Length (mm) | Failure stress (MPa) | Failure strain (%) | Young's Modulus (GPa) |
| 100 | 920 | 2.86 | 33.0 |
| (25) | (0.09) | (0.7) | |
| 300 | 909 | 2.79 | 32.9 |
| (40) | (0.12) | (0.8) | |
| 900 | 818 | 2.57 | 32.4 |
| (52) | (0.13) | (0.8) |
Table 3: Mean values, with standard deviations in parenthesis, showing the effects of varying the length on specimens with a width of 30 mm, a loading rate of 10 mm/min, and cut along the ‘warp’ direction, where each batch is at least 35 specimens.
| Ageing time (days) | Failure stress (MPa) | Failure strain (%) | Young's Modulus (GPa) |
| 0 | 909 | 2.79 | 32.9 |
| (40) | (0.12) | (0.8) | |
| 30 | 899 | 2.76 | 33.3 |
| (33) | (0.10) | (0.7) | |
| 58 | 898 | 2.76 | 33.1 |
| (46) | (0.08) | (0.9) |
Table 4: Mean values, with standard deviations in parenthesis, showing the effects of ageing at 70 °C with 76% RH on specimens with a gauge length of 300 mm, a width of 30 mm, a loading rate of 10 mm/min, and cut along the ‘warp’ direction, where each batch is at least 35 specimens.
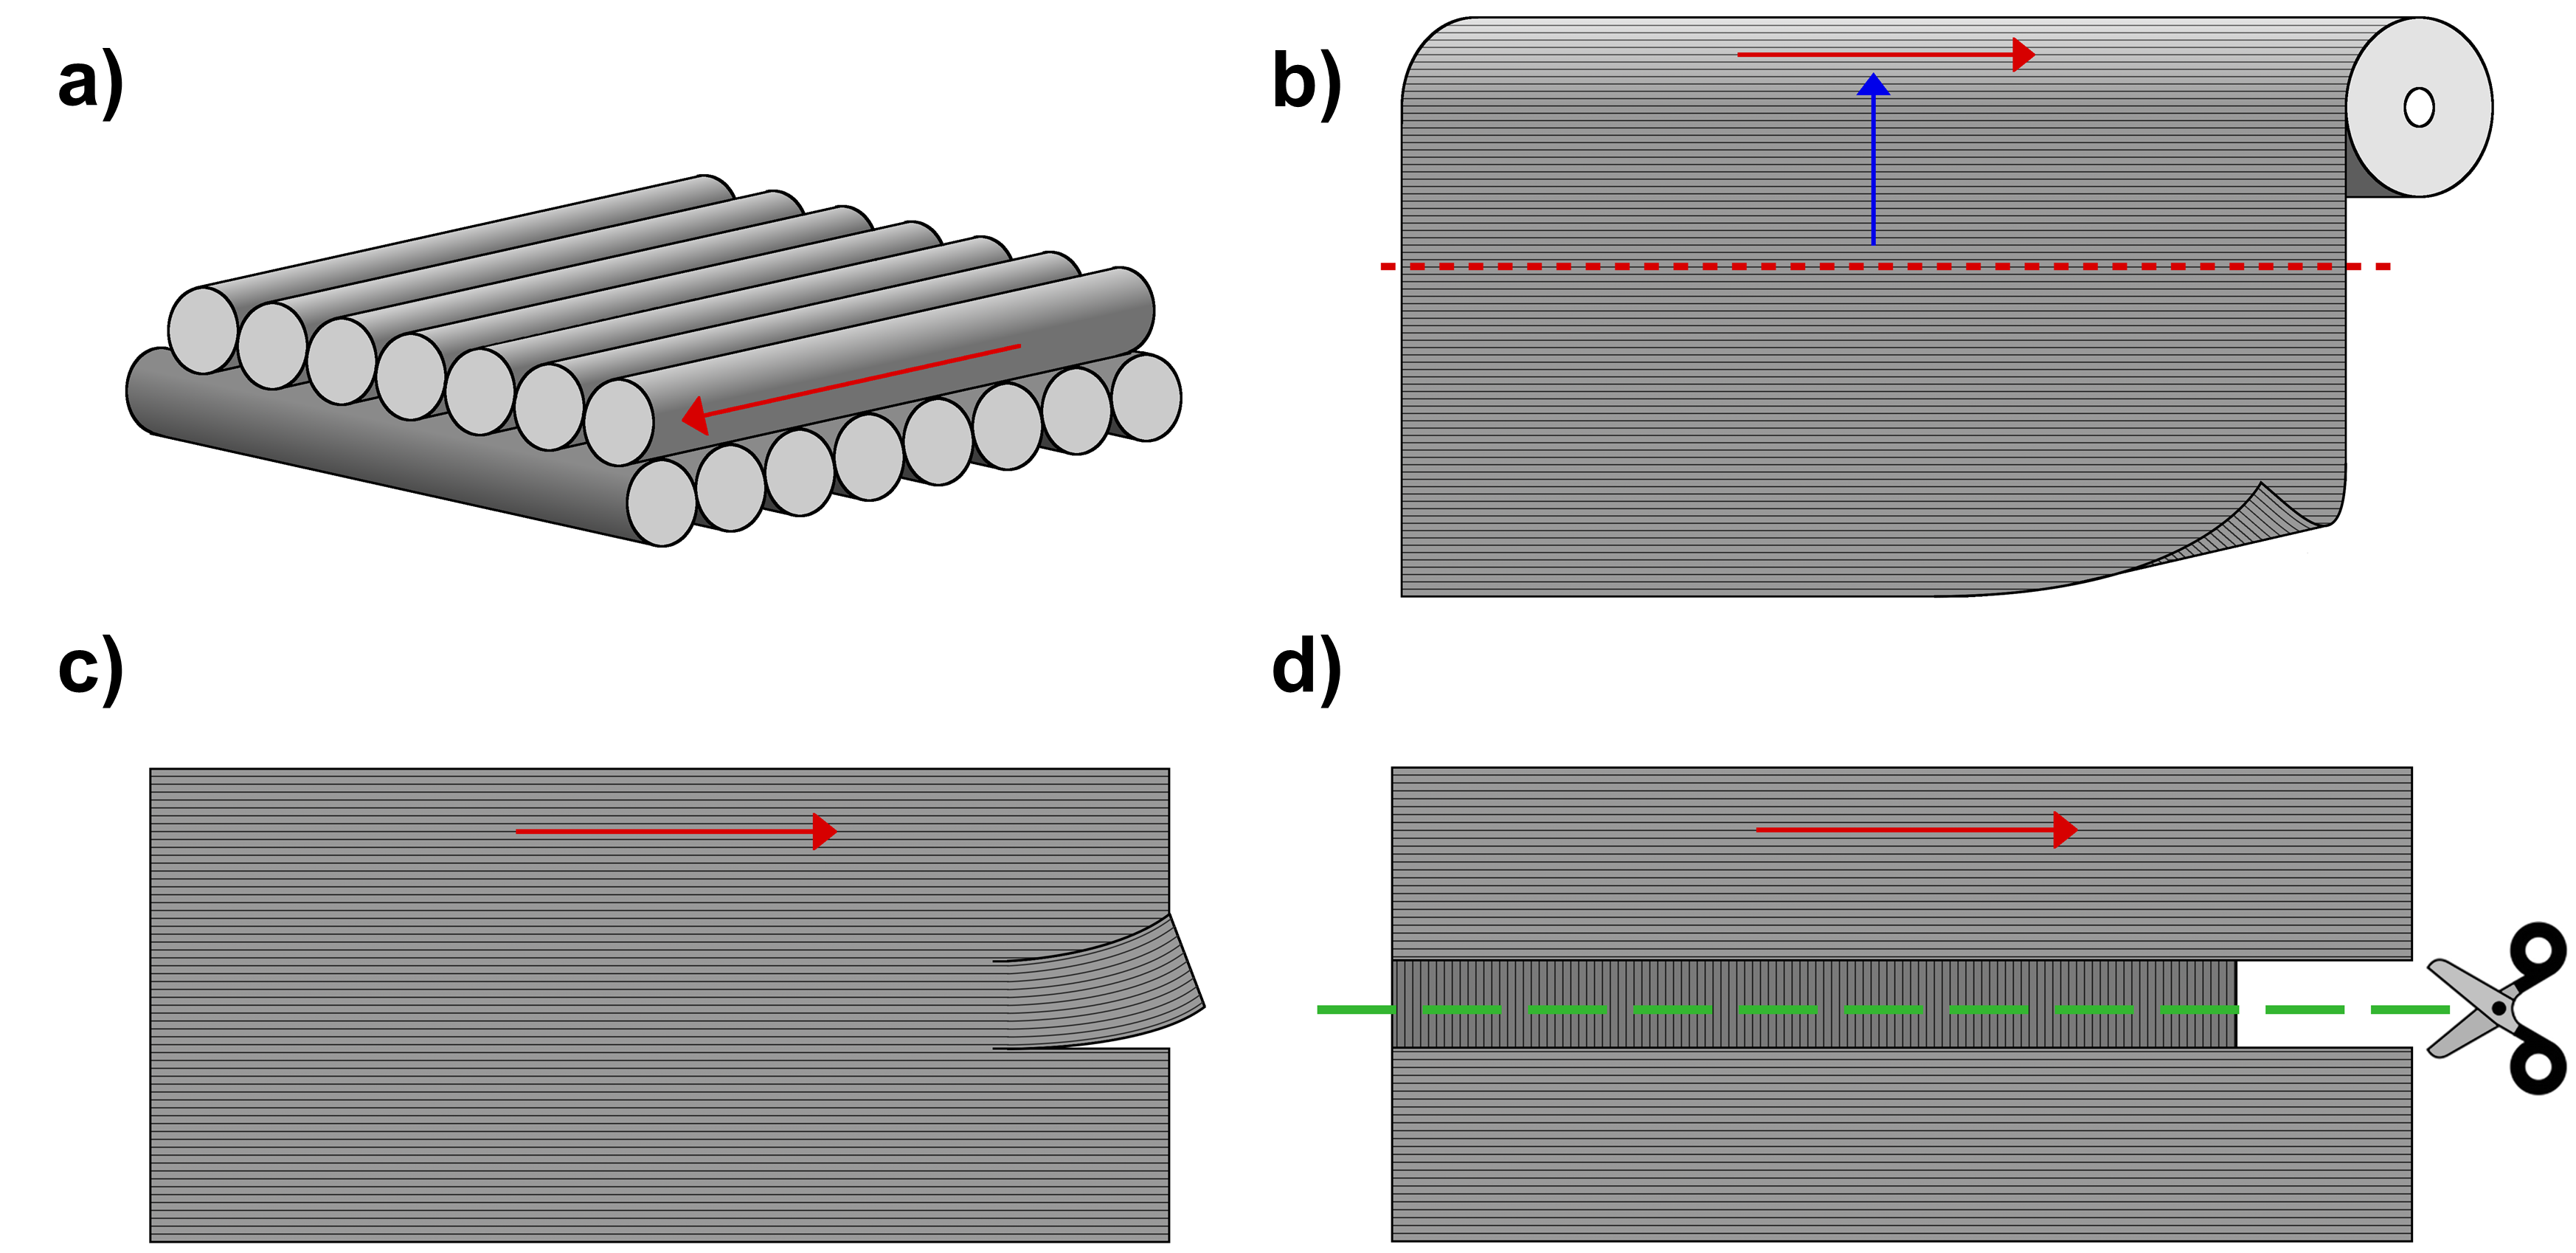
Supplemental Figure 1: Schematic of UD laminates. (a) Fiber (cylinders) orientation in two unidirectional (UD) layers, one with a 0° orientation and the other with a 90° orientation. (b) Schematic for cutting a piece of UD material from its bolt. The bolt’s width is measured along the red dotted line. For the piece of material cut off, the length is measured along the red dotted line, and the width is measured perpendicular to the length. The ‘warp’ direction is indicated by the blue arrow, and the ‘weft’ direction is indicated by the red arrow. The principal fiber direction is defined as the direction of the uppermost layer (i.e., along the red arrow/weft direction). Since the principal fiber direction refers to the layer that is being viewed (the top layer), turning the material over will change the principal fiber direction from weft to warp. Note that there is no warp and weft in the traditional textile sense, as the material used here is not woven. (c) Schematic showing a small tab of material, cut in preparation for separation. (d) UD laminate after separating the top layer from the unidirectional material. The green dashed line indicates where to cut to separate the precursor material from the roll. Please click here to download this file.
Supplemental Figure 2: SEM comparison. SEM comparison was performed between (a) a side view of a new, sharp scalpel blade with an unnotched edge, (b) an edge-on view of a new scalpel blade showing how the blade comes to a fine point, (c) a side view of a used scalpel blade with a defect in the edge and scratches along the edge, and (d) an edge-on view of a used scalpel blade showing that the blade no longer has as fine an edge and is now dull. Arrows mark the blade’s edge. Please click here to download this file.
Supplemental Figure 3: A used scalpel blade, with the arrow pointing to scratches along the length of the blade. Please click here to download this file.
Supplemental Figure 4: Cutting layout. Specimens are cut along the weft direction, where the red arrow indicates both the principal fiber direction and the weft direction, while the blue arrow indicates the warp direction. The terms weft and warp are used to reference standard textile directions, although they are not strictly applicable as the UD material is not woven. Please click here to download this file.
Supplemental Figure 5: Photographs of the specimen at various stages of preparation. (a) Marking video extensometer points using a template. (b) Loading the specimen, specifically positioning the end of the specimen at the grip line. Take care to center the specimen on the capstan grips by aligning the center of the specimen within approximately 1 mm of the center of the capstan grips. (c) Specimens in the environmental chamber. Please click here to download this file.
Supplemental Figure 6: Schematic of characteristic behavior during loading of a misaligned specimen. A horizontal line is drawn across it. (a) Schematic of the unloaded specimen. In (b), the specimen is loaded. (c) Actual misaligned specimen. The red arrows show the direction of the applied stress. Please click here to download this file.
Supplemental Figure 7: SEM images focusing on typical cutting damage on material cut. The cuts were made with (a) a dull utility knife; (b) an electrically powered fabric cutter, showing large amounts of damage parallel to the cut fibers; (c) a ceramic knife, showing how the knife cuts in sections, as well as the large sheared region that extends well into the material; (d) a precision ceramic cutter, showing how the ceramic blade does not cut through the fibers themselves; (e) a rotary blade, showing fiber pullout as well as a wavy cutting edge; (f) a utility knife, showing how a utility knife cuts through the fibers and can have a hairy edge; (g) a medical scalpel, showing how the scalpel can cleanly slice through fibers; (h) a medical scalpel, showing that the damage from the cut is localized with no larger-scale shear, delamination, or fiber pullout. Please click here to download this file.
Supplemental Figure 8: Stereomicroscope images of typical edge defects. The cut was made with (a) an electrically powered fabric cutter, showing large-scale frayed edges; (b) an electrically powered fabric cutter, showing small-scale frayed edges; (c) a ceramic knife, showing uneven cutting; (d) a ceramic knife, showing frequently frayed fibers; (e) a precision ceramic cutter, showing uneven cutting and frayed fibers; (f) a rotary blade, showing a cleaner yet less straight edge; (g) a rotary blade, showing a fairly common defect; (h) a utility knife, (i) a medical scalpel. Please click here to download this file.
Subscription Required. Please recommend JoVE to your librarian.
Discussion
Proper determination of the fiber direction is critical. The advantage of the method described in steps 1.4–1.6 of the protocol is that there is complete control over how many fibers are used to start the separation process. However, this does not mean that there is a complete control over the final separated region’s width, as the fibers are not fully parallel and can cross over each other. In the process of separating one batch of fibers, frequently, fibers neighboring those being separated will also be separated, due to this crossover. Thus, to get a true reading on the fiber direction, loose neighboring fibers must also be removed until there is a clean edge with no protruding fibers.
Consistency between specimens is also critical. In step 1.9 of the protocol, the grip lines are drawn before cutting the specimens so that the specimens will have a common length between grip lines, thus helping to ensure a consistent gauge length across specimens. The ideal distance from the edge of the specimen to the grip line is a function of both the coefficient of friction of the material itself and that of the grips, as well as the physical dimensions of the grips. This distance is an amount best determined experimentally, testing different distances to determine a sufficiently short distance with no slipping occurring during a tensile test. In step 1.12.1 of the protocol, it is important to use the cutting mat as a reference guide for the specimen width to ensure that the specimens, on average, are the desired width. Measuring from the edge of the material can introduce errors and will not guarantee that these errors are such that the average specimen width is the desired width. Refer to Refer to the representative results for further discussion of this point.
Potential modifications to the procedure include adjusting the specimen width, the effective gauge length, the strain rate, the grips, the frequency of changing the blade, the distance from the end of the specimen to the grip line, how often to reorient the material to the fiber direction when cutting, and the preload value when testing. The effects of changing the specimen width, the effective gauge length, the strain rate, and the grips are discussed in the representative results. How often to reorient the material depends on the consistency of the fiber direction in the material and on the ability of the cutter to not move the material during the cutting process and is also best determined experimentally. The cutting distance after which a blade becomes dull will vary, depending on the material and blade type. This should be determined for each different combination of material and blade by examining the edge of the specimen, as well as the edge of the blade, under a microscope. The distance from the end of the specimen to the grip line is a function of how slippery the material is. A slippery material with a low coefficient of friction, such as UHMWPE, will require a longer distance to the grip line. This is experimentally determined by changing this distance until the specimen no longer slips in the grips while testing. The preload value when testing should be sufficiently large to take up the slack, yet not too large. In this study, the 2 N used was at the low end, only barely removing the slack.
Currently, there are no standard test methods for measuring the mechanical properties of such thin (<0.25 mm), flexible UD laminates, and the available literature for the mechanical testing of these materials is focused on UD laminates that have been hot-pressed into a solid composite block11–14, which is not always representative of their end use condition. The methodology presented in this paper allows for the tensile testing of flexible UD laminates, without the need to add additional sources of variability and change their material properties by hot-pressing them prior to testing.
Future applications of this method are for a long-term ageing study on both aramid- and UHMWPE-based laminates. This method will also be proposed as an ASTM standard to test UD soft laminate materials, providing for a mechanism to monitor the failure stress of these materials both after manufacture and, potentially, during use in body armor applications.
Subscription Required. Please recommend JoVE to your librarian.
Disclosures
The full description of the procedures used in this paper requires the identification of certain commercial products and their suppliers. The inclusion of such information should in no way be construed as indicating that such products or suppliers are endorsed by NIST or are recommended by NIST or that they are necessarily the best materials, instruments, software or suppliers for the purposes described.
Acknowledgments
The authors would like to acknowledge Stuart Leigh Phoenix for his helpful discussions, Mike Riley for his assistance with the mechanical test setup, and Honeywell for donating some of the materials. Funding for Amy Engelbrecht-Wiggans was provided under grant 70NANB17H337. Funding for Ajay Krishnamurthy was provided under grant 70NANB15H272. Funding for Amanda L. Forster was provided from the Department of Defense through interagency agreement R17-643-0013.
Materials
| Name | Company | Catalog Number | Comments |
| Capstan Grips | Universal grip company | 20kN wrap grips | Capstan grips used in testing |
| Ceramic knife | Slice | 10558 | |
| Ceramic precision blade | Slice | 00116 | |
| Clamp | Irwin | quick grip mini bar clamp | |
| Confocal Microscope | |||
| Cutting Mat | Rotatrim | A0 metric self healing cutting mat | |
| Denton Desktop sputter coater | sputter coater | ||
| FEI Helios 660 Dual Beam FIB/SEM | FEI Helios | Scanning electron microscope | |
| Motorized rotary cutter | Chickadee | ||
| Rotary Cutter | Fiskars | 49255A84 | |
| Stereo Microscope | National | DC4-456H | |
| Straight edge | McMaster Carr | 1935A74 | |
| Surgical Scalpel Blade | Sklar Instruments | ||
| Surgical Scalpel Handle | Swann Morton | ||
| Universal Test Machine | Instron | 4482 | Universal test machine |
| Utility knife | Stanley | 99E |
References
- Forster, A. L., et al. Hydrolytic stability of polybenzobisoxazole and polyterephthalamide body armor. Polymer Degradation and Stability. 96 (2), 247-254 (2011).
- Forster, A. L., et al. Development of Soft Armor Conditioning Protocols for {NIJ--0101.06}: Analytical Results. NISTIR 7627. , (2009).
- NIJ Standard 0101.06- Ballistic Resistance of Personal Body Armor. , (2008).
- Forster, A. L., Chin, J., Peng, J. -S., Kang, K. -L., Rice, K., Al-Sheikhly, M. Long term stability of UHMWPE fibers. Conference Proceedings of the Society for Experimental Mechanics Series. 7, (2016).
- Pilato, L. A. Ballistic Resistant Laminate. , (1993).
- Park, A. D. Ballistic Laminate Structure in Sheet Form. , (1999).
- Jacobs, M. J. N., Beugels, J. H. M., Blaauw, M. Process for the manufacture of a ballistic-resistant moulded article. , (2006).
- ASTM E3110-18 Standard Test Method for Collection of Ballistic Limit Data for Ballistic-resistant Torso Body Armor and Shoot Packs. , (2018).
- Russell, B. P., Karthikeyan, K., Deshpande, V. S., Fleck, N. A. The high strain rate response of Ultra High Molecular-weight Polyethylene: From fibre to laminate. International Journal of Impact Engineering. 60, 1-9 (2013).
- Czechowski, L., Jankowski, J., Kubiak, T. Experimental tests of a property of composite material assigned for ballistic products. Fibres and Textiles in Eastern Europe. 92 (3), 61-66 (2012).
- Levi-Sasson, A., et al. Experimental determination of linear and nonlinear mechanical properties of laminated soft composite material system. Composites Part B: Engineering. 57, 96-104 (2014).
- ASTM D3039/D3039M-17 Standard Test Method for Tensile Properties of Polymer Matrix Composite Materials. , (2017).
- Hazzard, M. K., Hallett, S., Curtis, P. T., Iannucci, L., Trask, R. S. Effect of fibre orientation on the low velocity impact response of thin Dyneema®composite laminates. International Journal of Impact Engineering. 100, 35-45 (2017).
- ASTM D5034-09. Standard Test Method for Breaking Strength and Elongation of Textile Fabrics. Annual Book of ASTM Standards. , Reapproved 1-8 (2017).
- ASTM D5035-11. Standard Test Method for Breaking Force and Elongation of Textile Fabrics (Strip Method). Annual Book of ASTM Standards. , Reapproved 1-8 (2015).
- ASTM D6775-13 . Standard Test Method for Breaking Strength and Elongation of Textile Webbing, Tape and Braided Material. Tape and Braided Material.” Annual Book of ASTM Standards. (Reapproved). , Reapproved 1-8 (2017).
- ASTM D3950. Standard Specification for Strapping, Nonmetallic (and Joining Methods). Annual Book of ASTM Standards. , (Reapproved) 1-7 (2017).
- Weibull, W. A Statistical Distribution Function of Wide applicability. Journal of applied mechanics. 18 (4), 293-297 (1951).
- Coleman, B. D. Statistics and time dependence of mechanical breakdown in fibers. Journal of Applied Physics. 29 (6), 968-983 (1958).
- Coleman, B. D. Time dependence of mechanical breakdown phenomena. Journal of Applied Physics. 27 (8), 862-866 (1956).
- Coleman, B. D. Time Dependence of Mechanical Breakdown in Bundles of Fibers. III. The Power Law Breakdown Rule. Journal of Rheology. 2 (1), 195 (1958).
- Coleman, B. D. Application of the theory of absolute reaction rates to the creep failure of polymeric filaments. Journal of Polymer Sciences. 20, 447-455 (1956).
- Coleman, B. D. A stochastic process model for mechanical breakdown. Transaction of the Society of Rheology. 1 (1957), 153-168 (1957).
- Phoenix, S. L., Beyerlein, I. J. Statistical Strength Theory for Fibrous Composite Materials. Comprehensive Composite Materials. , 559-639 (2000).
- Newman, W. I., Phoenix, S. L. Time-dependent fiber bundles with local load sharing. Physical Review E - Statistical Physics, Plasmas, Fluids, and Related Interdisciplinary Topics. 63 (2), 20 (2001).
- Phoenix, S. L., Newman, W. I. Time-dependent fiber bundles with local load sharing. II. General Weibull fibers. Physical Review E - Statistical, Nonlinear, and Soft Matter Physics. 80 (6), 1-14 (2009).
