Here we introduce a method for using an intra-ventricle optical catheter in perfused hearts to perform absorbance spectroscopy across the heart wall. The data obtained provides robust information on tissue oxygen tension as well as substrate utilization and membrane potential simultaneously with cardiac performance measures in this ubiquitous preparation.
Method Article
Intra-cardiac Side-Firing Light Catheter for Monitoring Cellular Metabolism using Transmural Absorbance Spectroscopy of Perfused Mammalian Hearts
Opens in a new tab
In This Article
Summary
Loading...
$$\rightleftharpoonup{xx}$$
$$\longleftharp{xx}$$,
$$\longrightharp{xx}$$,
Abstract
Loading...
$$\rightleftharpoonup{xx}$$
$$\longleftharp{xx}$$,
$$\longrightharp{xx}$$,
Absorbance spectroscopy of cardiac muscle provides non-destructive assessment of cytosolic and mitochondrial oxygenation via myoglobin and cytochrome absorbance respectively. In addition, numerous aspects of the mitochondrial metabolic status such as membrane potential and substrate entry can also be estimated. To perform cardiac wall transmission optical spectroscopy, a commercially available side-firing optical fiber catheter is placed in the left ventricle of the isolated perfused heart as a light source. Light passing through the heart wall is collected with an external optical fiber to perform optical spectroscopy of the heart in near real- time. The transmission approach avoids numerous surface scattering interference occurring in widely used reflection approaches. Changes in transmural absorbance spectra were deconvolved using a library of chromophore reference spectra, providing quantitative measures of all the known cardiac chromophores simultaneously. This spectral deconvolution approach eliminated intrinsic errors that may result from using common dual wavelength methods applied to overlapping absorbance spectra, as well as provided a quantitative evaluation of the goodness of fit. A custom program was designed for data acquisition and analysis, which permitted the investigator to monitor the metabolic state of the preparation during the experiment. These relatively simple additions to the standard heart perfusion system provide a unique insight into the metabolic state of the heart wall in addition to conventional measures of contraction, perfusion, and substrate/oxygen extraction.
Introduction
Loading...
$$\rightleftharpoonup{xx}$$
$$\longleftharp{xx}$$,
$$\longrightharp{xx}$$,
Optical absorbance spectroscopy for monitoring intact organ biochemistry is a widely-used approach due to its intrinsic, non-destructive nature1,2,3,4,5,6,7,8,9. Myoglobin absorbance provides a measure of the average cytosolic oxygen tension10,11,12. Mitochondrial cytochromes provide information regarding substrate entry at the level of flavins, membrane potential from cytochrome bL:bH13, and oxygen delivery to the mitochondria in the cell from cytochrome oxidase (COX) redox state14. Glancy et al. demonstrated that the activities of each complexes can be determined by measuring the mitochondrial membrane potential and the metabolic rate15. Hence, using optical spectroscopy, a wealth of information can be obtained without the need of exogenous probes or major modifications of current study systems. The goal of this paper is to present a robust method for collecting transmission optical spectra in conventional perfused heart preparations with the only major modification being performing studies in a darkened environment.
Reflectance absorption spectroscopy has been successfully used to perform optical spectroscopy of the perfused heart3,6,16,17,18,19 as well as the heart in vivo1. Reflectance spectroscopy consists of impinging light on the heart surface and collecting the light scattered through the heart as well as diffuse and specular reflected light. Thus, the collected light in this approach is a composite of multiple scattering mechanisms as well as the tissue chromophore absorbances of interest. Due to the motion and complex surface of the heart, the light reflection off the surface of the heart is particularly problematic, altering the depth of penetration and amount of purely reflected light.
The limitations of reflectance absorption spectroscopy presented above were resolved by introducing an optical catheter into the left ventricle cavity, permitting the collection of transmitted light across the left ventricle free wall20. The benefits of transmission spectroscopy for this type of study was appreciated in early invasive studies by Tamura et al.9 The current implementation provides a very robust transmission absorption spectroscopy analysis of the intact heart with regards to cytosolic oxygenation and mitochondria redox state under a variety of conditions21. These initial studies used a specially fabricated catheter with a powered LED on the tip oriented to generate a side-firing pattern of white light through the myocardium. However, the relatively large LED tipped catheter is only appropriate for use on medium size hearts (rabbit, guinea pig, etc.) and required custom fabrication. In the current study, a method of using a commercially available 200-micron core side-firing optical fiber as a light guide is presented. Instead of a wired LED at the tip, the catheter with the 500-micro tip redirects light from an external source increasing the versatility of the system. This approach allows the use of a wide variety of external light sources including lasers for applications such as Raman scattering spectroscopy. To quantify this data, an online full multicomponent spectral analysis using known reference spectra to improve the accuracy of the spectroscopic determination of cardiac chromophores is presented as previously described20,22. The source code for this analysis will be provided by the authors upon request. Using this approach, information on cardiac biochemistry and mitochondrial function can be obtained simultaneously with the conventional cardiac functional parameters with little or no impact on the heart preparation. As the heart is critically dependent on mitochondrial function and oxygen delivery, this technical addition to the classical perfused heart system will greatly improve the interpretation and utility of this important model of cardiac performance.
Protocol
Loading...
$$\rightleftharpoonup{xx}$$
$$\longleftharp{xx}$$,
$$\longrightharp{xx}$$,
All animal protocols were approved by the National Heart, Lung, and Blood Institute Animal Care and Use Committee and performed in accordance with the guidelines described in the Animal Care and Welfare Act (7 USC 2142 § 13).
1. Isolated Perfused Heart System and Perfusate
NOTE: This preparation is very similar to previous publications23.
- Make 4 liters of modified Krebs-Henseleit perfusate composed of (in mmol/L) 137.0 NaCl, 5.4 KCl, 1.8 CaCl2, 0.5 MgCl2, 1.0 Na2HPO4, 10.0 glucose, 1.0 lactate, and 10.0 HEPES.
- pH the perfusate to 7.4 at 37 °C with NaOH and HCl.
- Filter the perfusate through a 1 µm pore membrane.
- Rinse all tubes and chambers of the perfused heart system by running and draining purified water through the system.
- Transfer the perfusate into the tank and oxygenate with 100% O2 with the bubbler while maintaining the temperature at 37 °C using a heated circulating water bath.
- Add 2 of 12 µm pore membrane filters and prime the system with the perfusate while recirculating in the Langendorff mode.
- Attach a tubing clamp on the tube right above the aortic cannula and adjust the screw so that the aortic flow drops to about 10 mL/min.
2. Rabbit Heart Excision and Perfusion
- Heart excision
- Anesthetize male New Zealand white rabbits (about 3 kg) via a 1.5 mL intramuscular injection of ketamine/acepromazine mixture (10:1).
- Approximately 10–15 minutes later, administer 3% isoflurane via inhalation for a complete anesthetic effect.
- Confirm proper depth of anesthesia by toe pinching and then place a line in the marginal ear vein for administration of subsequent drugs.
- Inject 1,500 units (or 1.5 mL of 1,000 units/mL) of Heparin and let circulate for 3 minutes.
- Double check proper depth of anesthesia and then euthanize with 6 mEq (or 3 mL of 2 mEq/mL) of KCl.
- Rapidly open the chest, locate the heart’s apex and the aorta. Remove the heart by cutting the aorta as far from the heart as possible and cutting the pulmonary veins as close to the lungs as possible.
NOTE: Removal of lungs at this early stage is different than previous publication23 but has not impact on preparation. - Place the heart in a small beaker of perfusate (same perfusate as step 1.3) sitting in a bucket of ice for transportation from surgery to perfusion.
- Heart cannulation
- Cannulate and tie the aorta securely, making sure not to include any bubbles in the aortic line.
- Initiate flow at 70 mmHg perfusion pressure by removing the tubing clamp on the aortic line and maintain this pressure during the remainder of the surgery and vessel cannulation.
- Separate the pulmonary artery from the aorta and other vessels and ligate the vena cavae and pulmonary veins. Remove the fat and connective tissue still present.
- Cannulate the pulmonary artery to provide a measure of coronary sinus flow rate and oxygen tension.
- Discard initial flow out of the heart (for about 10 minutes) during the preparation to eliminate blood and surgical debris. After this period, recirculate the perfusate.
3. Side-Firing Fiber Optic Placement
- Connect the fiber optic catheter to a high-power fiber-coupled LED white light source to help visualization as well as provide the light for spectroscopy once in the heart.
- Cut a small appendage of the left atrium, insert the catheter into the left ventricle via the mitral valve, then rotate it to achieve an illuminated left ventricle free wall.
- Position the pickup fiber optic directly opposite the region of maximum illumination of the left ventricle at about 1 cm from the heart.
- Connect the other end of the pickup fiber to a rapid scanning spectrometer.
4. Optical Spectroscopy
- Turn off the lights in the experimental area to obtain complete darkness.
- Start the custom program, incorporating spectrometer drivers to perform data acquisition and real-time analysis of the transmitted light.
NOTE: An executable version of the consolidated version of the spectral acquisition and analysis program is provided as a Supplemental Coding File. Source code is available by request to the authors. - Navigate through all prompts, selecting options for perfused heart spectroscopy acquisition mode. On the next page, indicate whether auxiliary data collection is occurring. Finally, enter acquisition parameters, including location of both chromophores reference spectra and data to be saved.
- Enter a bandwidth of 490–630 nm.
- Enter a sampling rate of 2 Hz (i.e. 2 samples/sec).
- Collect a dark current, or zero light, spectrum to correct for background signal levels by turning the light source off.
- Click to select the chromophore references desired to be used in the fitting routine.
- In the Acquire Data page, adjust the position of both the catheter and the pickup fiber to maximize the transmitted light displayed on the software with specific attention to the signal amplitude in the 500 nm region, where the oxygenated myoglobin absorbances should be observed.
- Make sure the transmitted light is not saturating the detector in the 600 nm region.
- Ensure no external light sources contribute to the collected spectrum by turning off catheter illumination and confirming no light is now detected.
- Initiate the data collection by clicking on the Save Spectra button.
- Click on Set as Control to view the difference absorbance spectrum from future spectra to the current “control” spectrum.
- Perform any physiological perturbation as desired.
- Protocol 1: Effect of Cyanide on Cardiac Performance and Chromophore Absorption
- Stop recirculating fluid from the heart perfusion.
- Using a syringe pump, inject cyanide (2.5 to 75 mM at pH 7) at different rates into perfusate just before the aortic cannula to achieve desired concentrations of cyanide (0.025 to 1 mM, calculated from aortic flow rate) in the flowing perfusate into the heart while monitoring cardiac function and optical properties.
- Stop the cyanide syringe pump when the effects on coronary flow and heart rate along with the optical transmission through the heart wall are at steady state.
- Protocol 2: Ischemia/Hypoxia
- Stop cyanide infusion.
- After 5 minutes switch the bubbling gas from 100% oxygen to 100% nitrogen to remove oxygen from the system.
- After about 10 minutes, stop the flow to simulate a total ischemic/hypoxic condition.
- Protocol 1: Effect of Cyanide on Cardiac Performance and Chromophore Absorption
5. Spectral data analysis
- Run the program in the perfused heart analysis mode.
- Select appropriate spectrometer.
- Enter the data file path and reference spectra file and select catheter light source, which loads the pre-saved spectrum of the catheter light source.
- Select Read Bin Data.
- Select Set Min and Max Wavelength.
- Enter the bandwidth for the data analysis as 490–630 nm.
- Select Return to Main Menu.
- Select Read References.
- Confirm the reference spectra to use in the analysis.
- Select Return to Main Menu.
- Select Time Points in the main menu.
- Select a T0 time point as control and set the range to 100 points.
- Select a T1 time point as the experimental period at a range of 100 points.
- Observe the raw difference spectrum in the Averaged Abs. Spectrum tab.
- Select Calculate Fit Coefficients and then click on the Fit Coefficients tab to observe the time course of the reference spectra fit.
- Return to the Main Menu and select Calculate Difference Abs.
- Select T0 and ΔT1 at all positions. Observe the fitted spectrum in the Difference Spectrum window and fitting elements in the Reference Weight window.
- Repeat this procedure to compare other time points in the experiment.
- Return to the Main Menu.
- Save data and analysis in a spreadsheet report by typing in a desired name and selecting Save Data for further analysis with other programs.
NOTE: if no name is typed, the report is saved with the same name as the input file. The report is saved in a folder named Excel Analysis Files, located in the same folder as the original input file.
Results
Loading...
$$\rightleftharpoonup{xx}$$
$$\longleftharp{xx}$$,
$$\longrightharp{xx}$$,
The system used is an off the shelf small animal perfusion heart system but was heavily modified for use with a rabbit heart. The modifications were primarily to increase the bore size of all the tubing to assure adequate flow delivery to the rabbit heart. Great care was made to assure, at the perfusion pressures used, the flow rate of the native perfusion system exceeded the flow with heart attached by at least 5-fold. 2–12 µm pore membrane filters were placed in parallel between the fluid pump and the aortic preload bubble trap chamber to remove any debris from the heart.
Transmitted Light from the Rabbit Heart
Figure 1 presents the spectrum of the catheter (Figure 1A) and the raw spectrum of the transmitted light from the rabbit heart free wall (Figure 1B). These data reveal a very large attenuation of light in the blue region of the spectrum, however the bands of absorbance from myoglobin and the mitochondrial cytochromes can be directly observed between 490 and 580 nm in the insert. It is important in these studies to assure enough transmitted light is detected in the region from 490 to 630 nm to obtain information on the metabolically responsive cardiac chromophores. The positioning of the external and internal fibers is adjusted prior to saving data to maximize light intensity but not saturate the detector in the 625 nm region.
Reference Reduced minus Oxidized Spectra of Reference Chromophores in the heart.
Figure 2 presents the reference spectra used to fit the difference spectra collected in these studies. These references include myoglobin, cytochrome aa3 (alternatively cytochrome a605 and cytochrome a607, depending on the type of perturbation22), cytochrome a580, cytochrome bL, cytochrome bH, cytochrome c, cytochrome c1, FAD, an absorbance representation of the incident light (denoted I0, which is used to account for sieved light, that is, photons that went through the tissue without being absorbed), and a line (with varying slope and intercept to account for scattering, not shown in Figure 2). Some spectra are noisy, as the concentration of the pure reference material was very low22.
Time course of reference spectra fits during total experiment
Figure 3 represents the time course of a typical experiment calculated in step 5.15 of the protocol. This consists of a control phase, followed by a cyanide injection phase, followed by a cyanide washout, followed by a deoxygenation phase, and finally ischemia. The changes in the individual chromophores (myoglobin, cytochrome aa3, and cytochrome c) over time are plotted over time along with coronary flow rate. The optical density change of each chromophore is estimated by multiplying the fit coefficient obtained from the linear least squares routine and the representative peak of the chromophore (or the maximum absorbance of said chromophore). For example, for myoglobin, the fit coefficient of the myoglobin reference is multiplied by the value of the myoglobin reference spectrum at 580 nm. Note the rapid oxygenation of myoglobin to the addition of cyanide is matched by the increase in flow but is before the significant reduction of cytochromes. This effect is partially recovered with the washout of cyanide. Finally, full reduction of cytochromes and deoxygenation of myoglobin is obtained with ischemia. These data demonstrate that dynamic data concerning the metabolic status of the heart can easily be obtained with this methodology. The position of the spectra used for the difference spectra are marked on this time course as: C baseline, CN cyanide injection, CNW cyanide Washout, H N2 Hypoxia (nitrogen being bubbled in the perfusate instead of oxygen), and HI No flow ischemia (no perfusate flowing through the heart).
Difference Spectrum of Cyanide Treatment versus Control and Fit of Cyanide Difference Spectrum from Rabbit Heart.
To obtain a difference spectrum, two absolute spectra are subtracted. Each absolute spectrum is obtained by taking an average of many (typically 100) spectra to optimize signal to noise ratio. Figure 4A represents the difference spectrum of the control (C) and cyanide (CN) treated heart. Using the reference spectra outlined in Figure 2, the fit spectrum is calculated. The residual spectrum is the subtraction of the fit from the raw data. The same scheme is used for all the subsequent spectral presentations. Figure 4B presents the spectra amplitudes of the reference spectra (shown in Figure 2) used to fit Figure 4A. Strong increases in absorbance of most of the cytochromes are observed as the flow of electrons down the cytochrome chain was blocked by cyanide in the steady state. In addition, the absorbance of oxygenated myoglobin increased as the consumption of oxygen was eliminated by cyanide. Figure 4C presents the difference spectra and fit of the difference spectrum from CNW and CN, revealing the partial reversal of the cyanide effect. This was accomplished by selecting time points in protocol step 5.18, moving T0 to the CNW and T1 to CN region of the time course. Figure 4D presents the difference spectrum of HI and C, which represents the fully deoxygenated and reduced state of the cytosol and mitochondria versus the control condition. Again, this was performed at protocol step 5.18, moving T0 to C and T1 to HI.
Initial time course of cyanide effects on coronary flow and chromophores
Figure 5A shows an example of the initiation of the cyanide effect on the tissue. The fits for myoglobin, cytochrome a605 and cytochrome c along with the coronary flow are presented for a single heart. These time courses were created at protocol step 5.15 for the cyanide experiment. The individual difference versus the baseline (position 1) are shown in Figure 5B. The spectra were generated from the corresponding position number (1-4) on the time course. This was accomplished at protocol step 5.18, where T0 was always in position 1, and subsequently different spectra (2–4) were created by moving T1 to position 2, 3, and 4 respectively. Somewhat surprising was the observation that flow and myoglobin oxygenation increased before significant changes in cytochrome redox state. The initiation of the changes in flow and chromophore absorbance were estimated by linear extrapolation of the initial rate of change from the baseline. Using this approach, and setting the change in coronary flow as time zero, the increase in myoglobin oxygenation initiated 1.71 min ± 0.39 min after the change in flow, while cytochrome a605 and cytochrome c absorbance were nearly identical but much slower at 4.24 min ± 0.76 min and 4.34 min ± 0.77 min, respectively (n = 8). These data suggest that cyanide relaxes vascular tone24 before a major change in cardiac muscle metabolic state occurs. This effect is likely caused by cyanide encountering the vascular smooth muscle prior to reaching effective dose around the cardiac myocytes.
Estimates of Myoglobin oxygenation in control hearts
Using the cyanide data as an estimate of total myoglobin oxygenation and the ischemia data for fully deoxygenated myoglobin, we estimate that under control conditions myoglobin was only 88.2% ± 1.0% (n = 10) oxygenated, consistent with prior studies20,21,25.
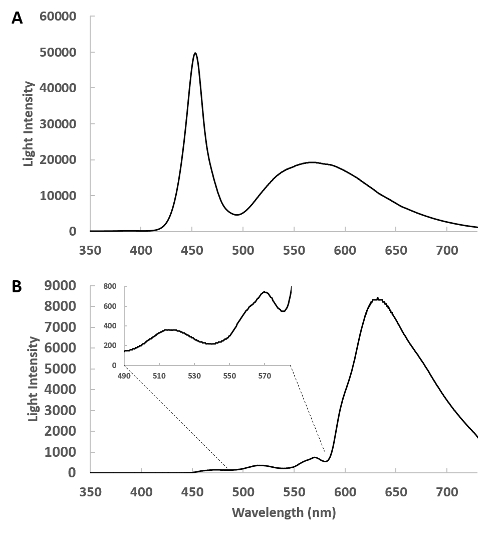
Figure 1: Spectra of the side-firing optical catheter. (A) This is a spectrum of the emitted light from the remote light source through the catheter detected with the pickup fiber at about 1 cm from the catheter. In this geometry, the heart is absent and the intensity of the light source is tuned so that the detector does not saturate. (B) The side-firing catheter is inserted in the left ventricle and the transmitted light from the heart is collected and shown. The insert shows the 400 to 580 nm region expanded, revealing the complex transmission of light from this region. Please click here to view a larger version of this figure.
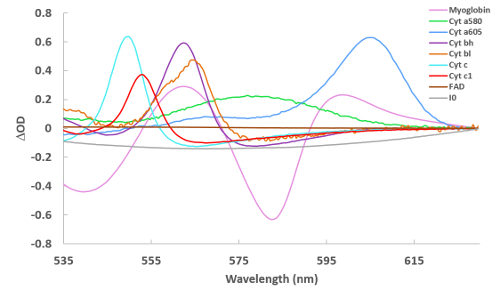
Figure 2: Reference spectra of cardiac chromophores used for spectral fitting. Spectra were collected via a variety of methods22 and are of reduced – oxidized (for the cytochromes) and deoxygenated – oxygenated (for myoglobin). For I0, the spectrum in Figure 1A is simply converted to an absorbance term to make the reference. Please click here to view a larger version of this figure.
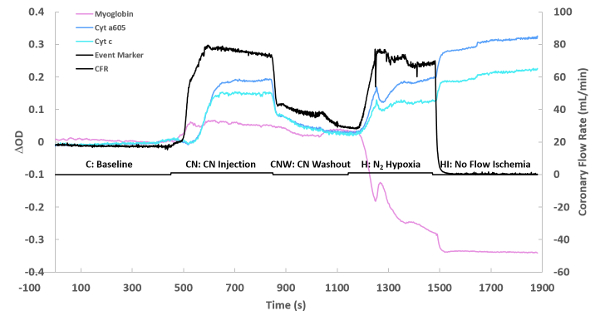
Figure 3: Flow and optical changes over time. The optical density change (ΔOD) of each chromophore is simply the fitted individual chromophore’s spectrum at its maximum absorbance. The maximum absorbance frequencies were as previously described20,26. The presented time course is for one experiment, showing a baseline, followed by cyanide injection (0.10 mM at maximum perfusate flow), cyanide washout, nitrogen hypoxia performed by replacing oxygen with nitrogen, and then complete ischemia. Please click here to view a larger version of this figure.
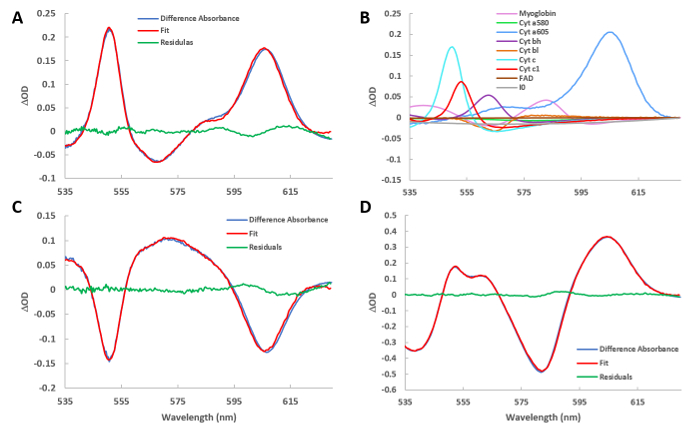
Figure 4: Fitted difference spectra of various conditions. (A) Spectrum of the cyanide injection minus the baseline. The fit spectrum obtained from the least square routine is also plotted. The residual spectrum is the difference between the raw and fit spectra. (B) The reference spectra used to create the fit presented in Figure 4A. The program scales the references in figure 2 to their relative contribution in the current difference spectrum. (C) Same as in A, but showing the difference spectrum of washout versus cyanide injection. (D) Same as in A, but showing the difference spectrum of ischemia versus baseline. Please click here to view a larger version of this figure.
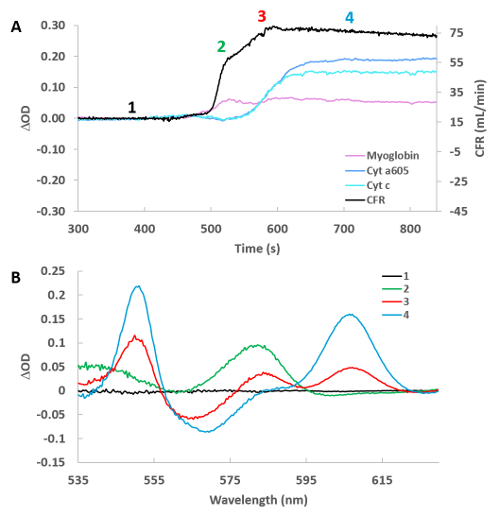
Figure 5: High temporal resolution of cyanide infusion effect on selected cytochromes, myoglobin and cardiac flow. (A) Time course of cardiac flow, deoxymyoglobin, reduced cytochrome a605, and reduced cytochrome c. Numbers refer to the position of the spectra taken relative to baseline in Figure 5B. (B) Difference spectra for the 4 positions labeled in Figure 5A versus control (position 1). Please click here to view a larger version of this figure.
Discussion
Loading...
$$\rightleftharpoonup{xx}$$
$$\longleftharp{xx}$$,
$$\longrightharp{xx}$$,
The isolated retrograde or working perfused heart preparation is a mainstay in the study of cardiac physiology as well as the preclinical investigation of techniques and drugs on the heart. Key to its use has been the ease of preparation, robust functional characteristics and control of experimental parameters as well as the ability to measure many functional parameters of the beating heart. Optical absorbance spectroscopy provides insight into tissue oxygenation as well as mitochondria metabolic activities. Optical spectroscopy has primarily conducted in the isolated perfused heart studies in the reflectance mode that that is difficult to interpret due to motion and light scattering complications.
We have introduced ventricle wall transmission optical spectroscopy (VWTOS) to provide a robust method of monitoring cardiac tissue metabolic chromophores. In a previous publication, we demonstrated that an LED hardwired to the tip of coaxial cable20 makes a unique intracardiac side-firing light source that can be used for VWTOS perfused hearts. The side-firing refers to the projection of light perpendicular to the long axis of the catheter, ideal for illuminating the ventricle free wall. The LED catheter was small enough to not impact cardiac function but required specialized fabrication in the laboratory. The current study presents the use of a 500 micron commercial side-firing catheter that can be coupled to any light source compatible with fiber optics. These side-firing optical catheters were commercially developed for laser ablation perpendicular to the long axis of the fiber. Naturally, we are using light power much lower than required for photoablation. Smaller fibers are available for use on smaller preparations such as the perfused mouse heart27. This fiber optic system provided adequate illumination through the heart wall in the wavelength range where cardiac chromophores absorb (450–630 nm). Using a pickup fiber optic on the outside of the heart, the absorbance of myoglobin and mitochondria cytochromes can be monitored with excellent temporal and spectral resolution (see Figure 5). The side-firing fiber optic approach has several advantages over the LED catheter for VWTOS, including a much smaller cross-sectional profile of the catheter that minimizes the impact of the catheter on the heart, more flexible reducing impact on cardiac valve and ventricle performance, no electrical connections that can short out in the saline perfusate, and finally a catheter that uses an external light source that increases the flexibility of light source selection for VWTOS.
Due to the strong absorbance of the heart below 490 nm, it is difficult to generate much information on the Soret band of the cytochromes in the region of 410–445 nm or NADH at 340 nm. Thus, the broad absorbance of FAD at 450 nm is the lowest frequency absorbance that is observed, though the entire absorption peak of this chromophores is not sampled. Using VWTOS the signal to noise ratio is very high as the entire wall is sampled in contrast to surface reflection spectroscopy, commonly used20, which only samples the surface of the heart with numerous scattering issues. VWTOS sampling the entire heart wall is more analogous to Nuclear Magnetic Resonance Spectroscopy (NMRS) measures of many cardiac metabolites such as 31P detected adenosine triphosphate and creatine phosphate28, 13C detected labeled metabolites29,30 including hyperpolarized labels31,32, and 1H detected metabolites33. As the VWTOS can be conducted using non-magnetic devices, it is completely feasible that NMR and VWTOS could be conducted simultaneously. VWTOS is not limited to endogenous chromophores and could be used to monitor absorption from optical probes for pH, Ca2+, and plasma membrane potential.
We use 2 Hz (i.e. 2 samples/sec) which provides excellent single spectrum signal to noise. Though higher sampling rates can be achieved that permit cardiac cycle analysis, previous studies have demonstrated that there’s no beat to beat variation in the chromophore absorbance, so no effort to selectively collect light as a function of cardiac cycle was made34. Due to the VWTOS geometry, the detection of light is less dependent on tissue motion than reflection methods, since the complex surface scattering events are eliminated. We find that severe motion can disrupt these measures, but the real time spectral analysis quickly reveals spectral transitions inconsistent with tissue chromophore transitions. Again, this only occurs when the heart moves grossly away from the collecting fiber dramatically reducing the amount of collected transmitted light.
The VWTOS data is analyzed using full spectral fitting routine based on a reference library of spectra of cardiac chromophores and the spectrum of the light source as previously described20,22,27,35 with a simple linear least squares approach. This spectral fitting procedure compensated for overlapping absorbance spectrum and does not rely on “isobestic” wavelengths. This full spectrum analysis eliminates artifacts associated with common dual beam (i.e. two wavelength) analysis1,3,6 which has been shown to be problematic20. The added advantage of full spectral analysis is the generation of a goodness of fit from the residuals, not available in dual beam protocols.
In this study, we focused on the effect of cyanide on the optical properties of the heart. As cyanide blocks cytochrome oxidase, it inhibits oxygen consumption and essentially results in a net reduction of all of the cytochromes as the electrons back up in the cytochrome chain. However, the membrane potential apparently remains high, as the redox changes in bL and bH are very small when compared to cytochrome c13. With the cessation of oxygen consumption, the oxygen tension in the tissue should approach the perfusate and we noted an early increase in oxygenated myoglobin with cyanide consistent with the notion that the saline perfused heart, even in retrograde perfusion modes, is not fully oxygenating myoglobin in the cytosol19,20,21,36. Comparing the maximum effect of cyanide on oxygenated myoglobin with the fully deoxygenated spectrum obtained with ischemia reveals a myoglobin oxygenation of only about 88%, consistent with previous studies.
It is important to note in this study that the cyanide effects on myoglobin oxygenation and cytochrome reduction were temporally resolved. It is surprising that the effects of cyanide were first observed on coronary flow and myoglobin before large changes in the heart’s cytochromes redox state was observed. The early marked increase in flow suggests that an effect on arterial smooth muscle24,37 may occur before gross metabolic effects in the heart cells are observed. The increase in flow, potentially with a modest cyanide induced decrease in respiration, likely results in the immediate increase in oxygenated myoglobin caused by the increase in oxygen delivery. With the spread of the cyanide inhibition to the myocytes, a further increase in coronary flow is observed (see the region marked 3 in Figure 5a), likely driven by numerous metabolic factors38. The large early impact of cyanide on flow suggests that the metabolism of the vascular smooth muscle may be more potent in altering vascular tone than the metabolism of the myocytes. These data support the well-established notion that myoglobin has a much lower affinity for oxygen than COX, even in the intact heart, as myoglobin oxygenation occurred well before changes in mitochondria redox state (Figure 5). This high level of deoxygenated myoglobin under control conditions is consistent with prior studies suggesting that the isolated saline perfused heart may be partially hypoxic even under control conditions9,19,20,21,27,36, underscoring the importance of monitoring cardiac tissue oxygenation when using this important model in cardiac physiology.
We present here the experimental details for conducting transmission absorption spectroscopy on the isolated perfused heart. We have successfully adapted this technique for use on the hearts from the rabbit to the mouse by using a thin side-firing intracardiac optical fiber. Utilizing state of the art full spectral fitting routines, the complex optical interaction of the cardiac chromophores can be easily extracted providing, a near real-time measure of critical elements of myocardial metabolism simultaneously with conventional functional measures.
Disclosures
Loading...
$$\rightleftharpoonup{xx}$$
$$\longleftharp{xx}$$,
$$\longrightharp{xx}$$,
No conflicts of interest declared.
Acknowledgements
Loading...
$$\rightleftharpoonup{xx}$$
$$\longleftharp{xx}$$,
$$\longrightharp{xx}$$,
This work was fully supported by the NHLBI intramural program (Project # ZIA HL00460131).
Materials
| Name | Company | Catalog Number | Comments |
|---|---|---|---|
| BIOPAC data acquisition system | BIOPAC | MP150 | Analog to digitial conversion |
| BIOPAC general purpose transducer amplifiers | BIOPAC | DA100C | Pressure monitoring |
| BIOPAC System skin temperature amplifier | BIOPAC | SKT100B | temperature monitoring |
| Compact Universal 1- and 2- Channel LED Controllers | Mightex | SLC-MA02-U | External light source power supply |
| Disposable pressure sensors | BIOPAC | RX104A | Pressure monitoring |
| Dual Syringe, Infusion Pump | KdScientific | KDS 200 / 200P LEGACY SYRINGE PUMP | drug injection |
| Flow-through probes | Transonic | 4PXN | perusate flow monitoring |
| Glass Syringe | FORTUNA Optima | 30 CC | Air tight fluid injection |
| High power fiber-coupled LED white light source | Mightex | Type-A FCS-0000 | External light source |
| Perfused heart system | Radnoti | 120101BEZ | This system was heavily modified to provide adequate flow (see manuscript) |
| Phase fluorimeter | Ocean Optics | NeoFox-GT | oxygen concentration |
| Pickup fiber optic | Thor labs | BF20HSMA01 | Fiber for collecting transmitted light (pick up fiber) |
| PowerLab unit | AD Instruments | PowerLab 8/35 | Analog to digitial conversion |
| Pressure transducers | BIOPAC | TSD104A | pressure monitoring |
| Programming environment | LABViEW | N/A | Software for driving spectrometer, digitiziing data and analysis. Code available on request |
| Rapid scanning spectrophotometer | Ocean Optics | QE65PRO | Rapid scanning spectrometer for spectral analysis |
| Side firing fiber optic | Polymicro Technologies Molex, LLC 18019 North 25th Av, Phoenic AZ 85023-1200 | JTFLH200230500/1.5M | side firing fiber optic 200 microns core |
| Sodium cyanide | Sigma-Aldrich | 380970 | Metabolic inhibitor |
| Temperature probe | BIOPAC | TSD102A | temperature monitoring |
| Tubing flow modules | Transonic | TS410 | perusate flow monitoring |
References
Loading...
$$\rightleftharpoonup{xx}$$
$$\longleftharp{xx}$$,
$$\longrightharp{xx}$$,
- Arai, A. E., Kasserra, C. E., Territo, P. R., Gandjbakhche, A. H., Balaban, R. S. Myocardial oxygenation in vivo: optical spectroscopy of cytoplasmic myoglobin and mitochondrial cytochromes. American Journal of Physiology. 277, 2 Pt 2 683-697 (1999).
- Epstein, F. H., Balaban, R. S., Ross, B. D. Redox state of cytochrome aa3 in isolated perfused rat kidney. American Journal of Physiology. 243 (4), 356-363 (1982).
- Hassinen, I. E., Hiltunen, J. K., Takala, T. E. S. Reflectance spectrophotometric monitoring of the isolated perfused heart as a method of measuring the oxidation-reduction state of cytochromes and oxygenation of myoglobin. Cardiovascular Research. 15, 86-91 (1981).
- Makino, N., Kanaide, H., Yoshimura, R., Nakamura, M. Myoglobin oxygenation remains constant during the cardiac cycle. American Journal of Physiology. 245 (14), 237-243 (1983).
- Takahashi, E., Doi, K. Visualization of oxygen level inside a single cardiac myocyte. American Journal of Physiology. 268, 6 Pt 2 2561-2568 (1995).
- Heineman, F. W., Kupriyanov, V. V., Marshall, R., Fralix, T. A., Balaban, R. S. Myocardial oxygenation in the isolated working rabbit heart as a function of work. American Journal of Physiology. 262, 255-267 (1992).
- Arakaki, L. S., Burns, D. H., Kushmerick, M. J. Accurate myoglobin oxygen saturation by optical spectroscopy measured in blood-perfused rat muscle. Applied Spectroscopy. 61 (9), 978-985 (2007).
- Bose, S., French, S., Evans, F. J., Joubert, F., Balaban, R. S. Metabolic network control of oxidative phosphorylation: multiple roles of inorganic phosphate. Journal of Biological Chemistry. 278 (40), 39155-39165 (2003).
- Tamura, M., Oshino, N., Chance, B., Silver, I. A. Optical measurements of intracellular oxygen concentrations of rat heart in vitro. Archives of Biochemistry and Biophysics. 191, 18-22 (1978).
- Wright, T. J., Davis, R. W. Myoglobin oxygen affinity in aquatic and terrestrial birds and mammals. The Journal of Experimental Biology. 218, Pt 14 2180-2189 (2015).
- Wright, T. J., Davis, R. W. Myoglobin extraction from mammalian skeletal muscle and oxygen affinity determination under physiological conditions. Protein Expression and Purification. 107, 50-55 (2015).
- Shibata, T., et al. Relationship between oxygen affinity and autoxidation of myoglobin. Inorganic Chemistry. 51 (21), 11955-11960 (2012).
- Kim, N., Ripple, M. O., Springett, R. Measurement of the mitochondrial membrane potential and pH gradient from the redox poise of the hemes of the bc1 complex. Biophysical Journal. 102 (5), 1194-1203 (2012).
- Oshino, N., Jamieson, D., Sugano, T., Chance, B. Mitochondrial function under hypoxic conditions: The steady states of cytochrome a,a3 and their relation to mitochondrial energy states. Biochimica et Biophysica Acta. 368, 298-310 (1974).
- Glancy, B., Willis, W. T., Chess, D. J., Balaban, R. S. Effect of calcium on the oxidative phosphorylation cascade in skeletal muscle mitochondria. Biochemistry. 52 (16), 2793-2809 (2013).
- Figulla, H. R., Hoffmann, J., Lubbers, D. W. Evaluation of reflection spectra of the isolated heart by multicomponent spectra analysis in comparison to other evaluating methods. Advances in Experimental Medicine and Biology. 169, 821-830 (1984).
- Hoffmann, J., Lubbers, D. W., Heise, H. M. Applicability of the Kubelka-Munk theory for the evaluation of reflectance spectra demonstrated for haemoglobin-free perfused heart tissue. Physics in Medicine and Biology. 43 (12), 3571-3587 (1998).
- Fabel, H., Lubbers, D. W. Measurements of Reflection Spectra of Beating Rabbit Heart in Situ. Biochemische Zeitschrift. 341 (4), 351(1965).
- Schenkman, K. A., Beard, D. A., Ciesielski, W. A., Feigl, E. O. Comparison of buffer and red blood cell perfusion of guinea pig heart oxygenation. American Journal of Physiology - Heart and Circulatory Physiology. 285 (5), 1819-1825 (2003).
- Femnou, A. N., et al. Intracardiac light catheter for rapid scanning transmural absorbance spectroscopy of perfused myocardium: measurement of myoglobin oxygenation and mitochondria redox state. American Journal of Physiology - Heart and Circulatory Physiology. 313 (6), 1199-1208 (2017).
- Kuzmiak-Glancy, S., et al. Cardiac performance is limited by oxygen delivery to the mitochondria in the crystalloid-perfused working heart. American Journal of Physiology - Heart and Circulatory Physiology. 314 (4), 704-715 (2018).
- Chess, D. J., et al. Optical spectroscopy in turbid media using an integrating sphere: mitochondrial chromophore analysis during metabolic transitions. Analytical Biochemistry. 439 (2), 161-172 (2013).
- Lou, Q., Li, W., Efimov, I. R. Multiparametric optical mapping of the Langendorff-perfused rabbit heart. Journal of Visualized Experiments. (55), (2011).
- Coburn, R. F., Grubb, B., Aronson, R. D. Effect of cyanide on oxygen tension-dependent mechanical tension in rabbit aorta. Circulation Research. 44 (3), 368-378 (1979).
- Schenkman, K. A., Marble, D. R., Burns, D. H., Feigl, E. O. Myoglobin oxygen dissociation by multiwavelength spectroscopy. Journal of Applied Physiology. 82 (1), 86-92 (1997).
- Femnou, A. N., et al. Intracardiac light catheter for rapid scanning transmural absorbance spectroscopy of perfused myocardium: measurement of myoglobin oxygenation and mitochondria redox state. American Journal of Physiology - Heart and Circulatory Physiology. 313 (6), 1199-1208 (2017).
- Giles, A. V., et al. Paradoxical Arteriole Constriction Compromises Cytosolic and Mitochondrial Oxygen Delivery in the Isolated Saline-Perfused Heart. American Journal of Physiology - Heart and Circulatory. , (2018).
- Matthews, P. M., et al. A 31P-NMR study of some metabolic and functional effects of the inotropic agents epinephrine and ouabain, and the ionophore R02- 2985 (X537A) in the isolated, perfused rat heart. Biochimica et Biophysica Acta. 720, 163-171 (1982).
- Lewandowski, E. D., Damico, L. A., White, L. T., Yu, X. Cardiac responses to induced lactate oxidation: NMR analysis of metabolic equilibria. American Journal of Physiology. 269, 1 Pt 2 160-168 (1995).
- Lewandowski, E. D., et al. Multiplet structure of 13C NMR signal from glutamate and direct detection of tricarboxylic acid (TCA) cycle intermediates. Magnetic Resonance in Medicine. 35 (2), 149-154 (1996).
- Ball, D. R., et al. Hyperpolarized butyrate: a metabolic probe of short chain fatty acid metabolism in the heart. Magnetic Resonance in Medicine. 71 (5), 1663-1669 (2014).
- Mariotti, E., et al. Modeling non-linear kinetics of hyperpolarized [1-(13)C] pyruvate in the crystalloid-perfused rat heart. NMR in Biomedicine. 29 (4), 377-386 (2016).
- Pisarenko, O. I., Khlopkov, V. N., Ruuge, E. K. A 1H NMR study of succinate synthesis from exogenous precursors in oxygen-deprived rat heart mitochondria. Biochemistry International. 12 (1), 145-153 (1986).
- Kuzmiak-Glancy, S., et al. Cardiac performance is limited by oxygen delivery to the mitochondria in the crystalloid-perfused working heart. American Journal of Physiology - Heart and Circulatory Physiology. 314 (4), 704-715 (2018).
- Schenkman, K. A., Marble, D. R., Burns, D. H., Feigl, E. O. Myoglobin oxygen dissociation by multiwavelength spectroscopy. American Journal of Physiology. 82 (1), 86-92 (1997).
- Beard, D. A., Schenkman, K. A., Feigl, E. O. Myocardial oxygenation in isolated hearts predicted by an anatomically realistic microvascular transport model. American Journal of Physiology - Heart and Circulatory Physiology. 285 (5), 1826-1836 (2003).
- Paul, R. J. Section II: The Cardiovascular System, Vol II, Vascular Smooth Muscle. Handbook of Physiology. Bohr, D. E., Somlyo, A. P., Sparks, H. V. , American Physiological Society. 201-252 (1980).
- Feigl, E. O. Coronary physiology. Physiological Reviews. 63, 1-205 (1983).
Reprints and Permissions
Request permission to reuse the text or figures of this JoVE article
Request Permission