The in vitro micronucleus assay is a well-established method for evaluating genotoxicity and cytotoxicity but scoring the assay using manual microscopy is laborious and suffers from subjectivity and inter-scorer variability. This paper describes the protocol developed to perform a fully automated version of the assay using multispectral imaging flow cytometry.
Method Article
An Automated Method to Perform The In Vitro Micronucleus Assay using Multispectral Imaging Flow Cytometry
In This Article
Summary
Abstract
The in vitro micronucleus (MN) assay is often used to evaluate cytotoxicity and genotoxicity but scoring the assay via manual microscopy is laborious and introduces uncertainty in results due to variability between scorers. To remedy this, automated slide-scanning microscopy as well as conventional flow cytometry methods have been introduced in an attempt to remove scorer bias and improve throughput. However, these methods have their own inherent limitations such as inability to visualize the cytoplasm of the cell and the lack of visual MN verification or image data storage with flow cytometry. Multispectral Imaging Flow Cytometry (MIFC) has the potential to overcome these limitations. MIFC combines the high resolution fluorescent imagery of microscopy with the statistical robustness and speed of conventional flow cytometry. In addition, all collected imagery can be stored in dose-specific files. This paper describes the protocol developed to perform a fully automated version of the MN assay on MIFC. Human lymphoblastoid TK6 cells were enlarged using a hypotonic solution (75 mM KCl), fixed with 4% formalin and the nuclear content was stained with Hoechst 33342. All samples were run in suspension on the MIFC, permitting acquisition of high resolution images of all key events required for the assay (e.g. binucleated cells with and without MN as well as mononucleated and polynucleated cells). Images were automatically identified, categorized and enumerated in the MIFC data analysis software, allowing for automated scoring of both cytotoxicity and genotoxicity. Results demonstrate that using MIFC to perform the in vitro MN assay allows statistically significant increases in MN frequency to be detected at several different levels of cytotoxicity when compared to solvent controls following exposure of TK6 cells to Mitomycin C and Colchicine, and that no significant increases in MN frequency are observed following exposure to Mannitol.
Introduction
The in vitro micronucleus (MN) assay is a commonly used test to assess cytotoxicity and genotoxicity as a screening tool in several fields of study such as chemical and pharmaceutical development as well as human biomonitoring among individuals exposed to various environmental, occupational or lifestyle factors1,2,3. MN consist of chromosome fragments or whole chromosomes generated during cell division that are not incorporated into one of the two main daughter nuclei. Following telophase, this chromosomal material forms into an individual, rounded body inside the cytoplasm that is separate from either of the main nuclei2. Therefore, MN are representative of DNA damage and have been used for many years as an endpoint in genotoxicity testing4. The most appropriate method to measure MN is the cytokinesis-block micronucleus (CBMN) assay. Using the CBMN assay, the frequency of MN in binucleated cells (BNCs) can be scored by incorporating Cytochalasin B (Cyt-B) into the sample. Cyt-B allows nuclear division but prevents cellular division and thus, restricts scoring of MN to BNCs that have divided only once5.
Protocols using both microscopy and flow cytometry have been developed and validated and are routinely used to perform the in vitro MN assay6,7,8,9,10,11,12,13,14. Microscopy benefits from being able to visually confirm that MN are legitimate but is time consuming and prone to variability between scorers15. To address this, automated microscopy methods were developed to scan slides and capture images of nuclei and MN16,17,18,19, but the cytoplasm cannot be visualized, making it difficult to determine if an MN is actually associated with a specific cell. Furthermore, these methods have difficulties identifying polynucleated (POLY) cells (including tri- and quadranucleated cells) which are required for the calculation of cytotoxicity when using Cyt-B9. Flow cytometry methods developed to perform the MN assay employ fluorescence as well as forward and side scatter intensities to identify populations of both the nuclei and MN that have been liberated from the cell following lysis20,21,22. This allows data to be acquired from several thousand cells in a few minutes and permits automated analysis23; however, the inability to visualize the cells makes it impossible to confirm that scored events are genuine. Additionally, lysing the cell membrane inhibits the use of Cyt-B as well as creating a suspension that contains other debris such as chromosome aggregates or apoptotic bodies and there is no way to differentiate these from MN24.
In light of these limitations, Multispectral Imaging Flow Cytometry (MIFC) is an ideal system to perform the MN assay since it combines the high resolution fluorescent imagery of microscopy with the statistical robustness and speed of conventional flow cytometry. In MIFC, all cells are introduced into a fluidics system and are then hydrodynamically focused into the center of a flow cell cuvette. Orthogonal illumination of all cells is accomplished through the use of a brightfield (BF) light-emitting diode (LED), a side scatter laser and (at least) one fluorescent laser. Fluorescent photons are captured by one of three (20x, 40x or 60x) high numerical aperture objective lenses and then pass through a spectral decomposition element. Photons are then focused onto a charge-coupled device (CCD) camera to obtain high resolution images of all cells that pass through the flow cell. To avoid blurring or streaking, the CCD operates in time delay integration (TDI) mode which tracks objects by transferring pixel content from row to row down the CCD in synchrony with the velocity of the cell in flow. Pixel information is then collected from the last row of pixels. TDI imaging combined with spectral decomposition allows up to 12 images (2 BF, 10 fluorescent) to be captured simultaneously from all cells passing through the flow cell. All captured imagery is stored in sample-specific data files, permitting analysis to be performed at any time using the MIFC data analysis software. Finally, data files retain the link between cellular images and dots on all bivariate plots. This means that any dot on a traditional bivariate plot can be highlighted and its corresponding BF and fluorescent imagery will be displayed25.
Recently, MIFC-based methods have been developed to perform the MN assay for both triage radiation biodosimetry26,27,28,29,30,31 and genetic toxicology32,33 testing. This work has demonstrated that cellular images of main nuclei, MN and the cytoplasm can be imaged with higher throughput than other methods26. All cell types required for analysis, including MONO cells, BNCs (with and without MN), and POLY cells, can be automatically identified in the MIFC data analysis software, and implementation of the scoring criteria developed by Fenech et al. is accomplished through the use of various mathematical algorithms6,34. Results from biodosimetry showed that dose response calibration curves were similar in magnitude to those obtained from other automated methods in the literature when quantifying the rate of MN per BNC29. Additionally, recent work in toxicology demonstrated that images of MONO cells, BNCs (with and without MN) and POLY cells can be automatically captured, identified, classified and enumerated using MIFC. The protocol and data analysis enabled the calculation of cytotoxicity and genotoxicity after exposing TK6 cells to several clastogens and aneugens32.
The protocol presented in this paper describes a method to perform the in vitro MN assay using MIFC. The sample processing technique used in this work requires less than 2 h to process a single sample and is relatively easy to perform in comparison to other methods. The data analysis in the MIFC analysis software is complicated, but creation of the analysis template can be accomplished in a few hours following the steps outlined in this paper. Moreover, once the template has been created, it can be automatically applied to all collected data without any further work. The protocol outlines all steps required to expose TK6 cells to clastogens and aneugens, describes how to culture, process and stain the cells, and demonstrates how to acquire high resolution imagery using MIFC. Furthermore, this paper illustrates the current best practices for analyzing data in MIFC software to automatically identify and score MONO cells, BNCs, and POLY cells for the purposes of calculating both cytotoxicity and genotoxicity.
Protocol
1. Preparation of culture medium and culturing of TK6 cells
NOTE: Some chemicals used in this protocol are toxic. Inhaling, swallowing or contacting skin with Cytochalasin B can be fatal. Wear appropriate personal protective equipment including a laboratory coat and two pairs of nitrile gloves. Wash hands thoroughly after handling. Formalin/formaldehyde is toxic if inhaled or swallowed; is irritating to the eyes, respiratory system, and skin; and may cause sensitization by inhalation or skin contact. There is a risk of serious damage to eyes. It is a potential carcinogen.
- Prepare 565 mL of 1x RPMI culture medium. Add 5 mL of MEM non-essential amino acids (100x), 5 mL of sodium pyruvate (100 mM), 5 mL of penicillin-streptomycin-glutamine (100x), and 50 mL of fetal bovine serum (FBS) to a 500 mL bottle of 1x RPMI 1640 medium. Prepare the medium in a biosafety cabinet and store at 2-8 °C. Heat the medium to 37 °C prior to adding it to the TK6 cells (see Table of Materials).
- Thaw 1 mL of TK6 cells (stored at -80 °C in DMSO) in 10 mL of medium. Centrifuge the cells at 200 x g for 8 min and aspirate the supernatant. Transfer the cells to 50 mL of media and incubate at 37 °C, 5% CO2. The doubling time of TK6 cells varies from ~12-18 h and a few (3 or 4) passages will be required for the cells to reach their maximum proliferation rate (see Table of Materials).
- Culture 100 mL of cells to a concentration of ~7-8 x 10⁵ cells/mL.
2. Preparation of clastogens and/or aneugens and Cytochalasin B
- Prepare appropriate stock concentrations of desired clastogens and aneugens. For example, for Mitomycin C, dissolve a full 2 mg bottle in 10 mL of sterile water to achieve a final stock concentration of 200 µg/mL. Mitomycin C can be stored at 4 °C for three months (see Table of Materials).
- On experiment day, prepare dilutions of the desired chemicals that are either 10-fold or 100-fold higher than the desired exposure concentrations if diluting in sterile water or DMSO, respectively.
- For Mitomycin C, prepare 3 mL dilutions in sterile water of 0.5, 1.0, 2.0, 3.0, 4.0, and 5.0 µg/mL. For Colchicine, prepare 3 mL dilutions in sterile water of 0.05, 0.1, 0.2, 0.3, 0.4, and 0.5 µg/mL. Finally, for Mannitol, prepare 3 mL dilutions in sterile water of 5, 10, 20, 30, 40, and 50 mg/mL.
- Prepare a 200 µg/mL stock concentration of Cytochalasin B by dissolving a 5 mg bottle into 25 mL of DMSO. Cytochalasin B can be stored at -20 °C for several months.
3. Exposure of cells to clastogens and/or aneugens
- Add 1 mL of desired chemical (e.g. Mitomycin C) to 9 mL of cells at ~7-8x10⁵ cells/mL in a T25 flask. For the control samples, add 1 mL of sterile water. Place the flasks in a 37 °C, 5% CO2 incubator for 3 h.
NOTE: If chemicals are diluted in DMSO, add only 100 µL of the chemical to each flask and add 100 µL of DMSO to controls. Each flask should contain 9.900 mL of cells. - After 3 h, remove flasks from the incubator and transfer cells to 15 mL polypropylene tubes. Centrifuge at 200 x g for 8 min, aspirate the supernatant and transfer cells to new T25 flasks containing a total of 10 mL of fresh culture medium. Add 150 µL of the stock concentration (200 µg/mL) of Cytochalasin B to each flask to achieve a final concentration of 3 µg/mL.
- Return the flasks to the 37 °C, 5% CO2 incubator for a recovery time equal to 1.5-2.0 doubling times, as recommended by the OECD guidelines9. For the TK6 cells used in this work, the recovery time was 24 h.
NOTE: The doubling time of the TK6 cells used here was 15 h and a recovery time of 24 h (1.6 doubling times) was used. Recovery times less than 1.5 doubling times will reduce proliferation in samples exposed to higher doses impacting the number of BNCs. Conversely, recovery times of more than 2.0 will produce a disproportionate number of polynucleated cells in control samples, skewing cytotoxicity calculations.
4. Preparation of buffers for fixation and labeling of DNA content (see Table of Materials)
- Prepare 75 mM of potassium chloride (KCl) by adding 2.79 g to 500 mL of ultrapure water. Stir the solution for 5 min using a magnetic stirrer and sterile filter through a 200 µm filter. The 75 mM KCl solution can be stored at 4 °C for several months.
- Prepare a sufficient amount of 4% formalin for the experiment, anticipating that a total of 2.1 mL must be added to each sample. For example, to prepare 10 mL of 4% formalin, add 4 mL of 10% formalin stock to 6 mL of 1x Dulbecco's Phosphate-Buffered Saline solution without Ca2+ or Mg2+ (PBS). This 4% formalin can be stored at room temperature for several weeks.
- Prepare 510 mL of wash buffer (2% FBS in 1X PBS) by adding 10 mL of FBS to a 500 mL bottle of 1x PBS.
- Prepare 10 mL of a 100 µg/mL concentration of Hoechst 33342 by adding 100 µL of the stock concentration (1 mg/mL) to 9,900 µL of 1X PBS. The Hoechst 33342 solution can be stored at 4 °C for several months.
5. Sample processing: hypotonic swelling, fixation, cell counting and labeling DNA content
- At the end of the recovery period, remove all flasks from the incubator and transfer all samples to 15 mL polypropylene tubes. Centrifuge all samples at 200 x g for 8 min.
- Aspirate the supernatant, resuspend the cells and add 5 mL of 75 mM KCl. Mix gently by inversion three times and incubate at 4 °C for 7 min.
- Add 2 mL of 4% formalin to each sample, mix gently by inversion three times and incubate at 4 °C for 10 min. This step acts as a "soft fixation".
- Centrifuge all samples at 200 x g for 8 min. Aspirate the supernatant and resuspend in 100 µL of 4% formalin for 20 min. This step acts as a "hard fixation".
- Add 5 mL of wash buffer and centrifuge at 200 x g for 8 min. Aspirate the supernatant and resuspend in 100 µL of wash buffer.
- Transfer all samples to 1.5 mL microcentrifuge tubes.
- Perform a cell count on each sample to determine the number of cells per sample. Samples will be highly concentrated so a 1:100 dilution in 1x PBS (10 µL of sample in 990 µL of PBS) will likely be required to obtain an accurate count.
NOTE: At this point it is best to perform cell counts using a hemocytometer. Adding KCl gives the cytoplasm a translucent appearance, making it difficult for automated cell counters to recognize them. Also, automated counters have difficulty scoring polynucleated cells due to their size. - If not running the samples on the MIFC immediately, they can be stored at 4 °C for several days. When ready to run samples, add 5 µL of 100 µg/mL per 1x10⁶ cells/mL to each sample. Also add 10 µL of 500 µg/mL of RNase per 100 µL of sample for a final concentration of 50 µg/mL. Incubate the samples at 37 °C, 5% CO2 for 30 min.
- Micro-centrifuge all samples at 200 x g for 8 min and use a pipette to remove the supernatant leaving ~30 μL. Use a pipette to resuspend all samples before running on the MIFC ensuring there are no bubbles in the tube. Do not vortex.
6. Starting and calibrating the MIFC
- Ensure the sheath, system calibration reagent, debubbler, cleanser and sterilizer containers are full and the waste tank is empty. Power up the system and double-click on the MIFC software icon. Click the Startup button and make sure that the Start all calibrations and tests checkbox is checked. This will flush the system, load sheath and system calibration reagents, and calibrate the system (see Table of Materials).
7. Running samples on the MIFC
NOTE: This section assumes the use of a 2 camera MIFC. If using a 1 camera MIFC, please see Supplement 1 - Full Protocol, section 7 for the creation of plots during acquisition
- Launch the MIFC data acquisition software (see Table of Materials). Figure 1 shows the instrument settings. Turn on the 405 nm laser and set the laser power to 10 mW (A). Disable all other lasers (including SSC) and set the BF to channels 1 and 9 (B). Confirm that the magnification slider is set to 60x (C), high-sensitivity mode is selected (D), and that only channels 1, 7, and 9 are showing in the image gallery.
- Click on the Scatterplot icon. Select the All population and select Area M01 on the X-axis and Aspect Ratio M01 on the Y-axis. Click on the Square Region icon and draw a region around the single cells. Name this region Single Cells. Right click on the plot and select Regions. Highlight the Single Cells region and change the x-coordinates to 100 and 900 and change the y-coordinates to 0.75 and 1 (Figure 1I).
- Click on the Scatterplot icon. Select Single Cells as the parent population, select Gradient RMS M01 on the X-axis, and Gradient RMS M07 on the Y-axis. Click on the Square Region icon and draw a region around the majority of the cells. Name this region Focused Cells. Right click on the plot and select Regions. Highlight the Focused Cells region and change the x-coordinates to 55 and 75 and change the y-coordinates to 9.5 and 20 (Figure 1J).
- Click on the Histogram icon. Select the Focused Cells population and select Intensity M07 as the feature. Click on the Linear Region icon and draw a region across the main peak in the histogram. Name this region DNA-positive. Right click on the plot and select Regions. Highlight the DNA-positive region and change the coordinates to 2 x 10⁵ and 2 x 10⁶. The range may have to be adjusted depending on intensity peak on the histogram (Figure 1K).
- Set the acquisition parameters (Figure 1E). Specify the file name and the destination folder, change the number of events to 20,000, and select the DNA-positive population.
- Click Load (Figure 1F) and place the control sample into the MIFC. Click the Acquire button to collect the data (Figure 1G). Once the acquisition is complete, click the Return button to return the sample (Figure 1H). Remove the sample tube from the instrument. Repeat this process for all remaining samples in the experiment.
8. Opening a data file in IDEAS
- Launch the MIFC analysis software package (see the Table of Materials). Click on Start Analysis to start the Open File Wizard. Select a data file by browsing to the desired raw image file (.rif). Click the Open button and click Next.
- Since this is a single color assay, compensation is not necessary so click Next to bypass the compensation step. At this stage there is no analysis template to apply, so click Next again. If the analysis template has been downloaded from the supplementary material, select it now. These templates only work with a 2 camera MIFC with BF set to channels 1 and 9 and nuclear imagery in channel 7 during acquisition.
- By default, the .cif and .daf file names are automatically generated to match the .rif. It is not recommended to change the names of the .cif and .daf. Click Next. Set the image display properties by selecting the 01 and 07. Click Next. There is no wizard for this application, so click Finish. It is very important to save the data analysis file (.daf) and the analysis template (.ast) often during sections 9–14 to avoid loss of progress.
9. Creating masks and features to identify BNCs
- Click on the Image Gallery Properties icon (blue/white icon). In the Display Properties tab click Set Range to Pixel Data then change the color to yellow. Click OK. Hoechst images are now easier to view against the black background.
- Create the non-apoptotic cells plot.
- Click on the Analysis tab, then click Masks. Click New then click Function. Under Function choose Threshold, under Mask choose M07 and set the Intensity Percentage to 50. Click OK then OK again. Click Close.
- Click on the Analysis tab, click Features, then click New. For the Feature Type select Area. For Mask select the Threshold(M07,Ch07,50). Click Set Default Name and click OK. Click Close to start calculating the feature values.
- Click on the Dot Plot icon. Select the All population. For the X-axis feature choose the Contrast_M01_Ch01 feature and for the Y-axis feature choose Area_Threshold(M07,Ch07,50). Click OK.
- Click the Square Region button and draw a region around the majority of the cells. Call this region Non-apoptotic. Right click on the plot and click Regions. Highlight the Non-apoptotic region. Set the x-coordinates to 0 and 15 and set the y-coordinates to 50 and 300. Click Close.
- Create the BNC mask (steps 9.3.1-9.3.5) to identify cells that contain only two nuclei.
- Browse for a BNC in the image gallery and click on it. This is to visualize creation of the mask in the Hoechst channel.
- Click on the Analysis tab, then click Masks. Click New then click Function. Under Function choose LevelSet, under Mask choose M07, select the Middle Level Mask radio button, and set the Contour Detail Scale to 3.00. Click OK then OK again.
- Click New then click Function. Under Function, choose Dilate, and under Mask choose LevelSet(M07,Ch07,Middle,3). Set the image to display to Ch07, and set the Number of Pixels to 2. Click OK then OK again.
- Click New then click Function. Under Function choose Watershed, and under Mask choose Dilate(LevelSet(M07,Ch07,Middle,3)2). Set the image to display to Ch07, and set the Line Thickness to 1. Click OK then OK again.
- Click New then click Function. Under Function choose Range, under Mask choose Watershed(Dilate(LevelSet(M07,Ch07,Middle,3)2)). Set the image to display to Ch07. Set the minimum and maximum area values to 115 and 5000, respectively. Set the minimum and maximum aspect ratio values to 0.4 and 1, respectively. Click OK. In the Name field change the text to read BNC then click OK.
- Create the features and plots to obtain the final BNC population
- Spot Count BNC feature: Click on the Analysis tab, then Features, then New. For the Feature Type select Spot Count. For Mask, select the final BNC mask created in 9.3.5. Set the Connectedness to Four and change the name to Spot Count BNC. Click OK then Close to calculate the feature values.
- Spot Count BNC histogram. Click the Histogram icon. Select Non-apoptotic as the parent population. For the X-axis feature choose the Spot Count BNC feature. Click OK. Click on the Linear Region icon. Draw a region across bin 2. Call this region 2N.
NOTE: Refer to section 9 in Supplement 1 - Full Protocol to create the remaining masks, features and plots to identify the final BNC population
10. Creating masks and features to identify MN within the BNC population
- Create the MN mask. Browse for a BNC that contains an MN in the image gallery and click on it. This is to visualize creation of the MN mask in the Hoechst channel. Click on the Analysis tab, then click Masks.
- Create Spot Identification Mask 1:
- Click New then click Function. Under Function choose Spot and ensure the Bright radio button is selected. Under Mask choose M07, set the Spot to Cell Background Ratio to 2.00. Set the Minimum Radius to 2 and the Maximum Radius to 6. Click OK then OK again.
- Click New then click Function. Under Function choose Range, and under Mask choose LevelSet(M07,Ch07,Middle,3). Set the Image to display to Ch07. Set the Minimum and Maximum Area to 80 and 5000, respectively. Set the Minimum and Maximum Aspect Ratio to 0 and 1, respectively. Click OK then OK again.
- Click New then click Function. Under Function choose Dilate, under Mask choose Range(LevelSet(M07,Ch07,Middle,3),80-5000,0-1). Set the Image to display to Ch07. Set the Number of Pixels to 2. Click OK then OK again.
- Click New. Double Click on the Spot(M07, Ch07, Bright, 2, 6, 2) mask to add it to the mask definition. Click the And operator and then the Not operator. Double click the Dilate(Range(LevelSet(M07, Ch07, Middle, 3), 80-5000, 0-1), 2) mask to add it to the mask definition. Click OK.
- Click New, then Function. Under Function choose Range and under mask choose the mask created in 10.1.1.4:
- Select Spot(M07, Ch07, Bright, 2, 6, 2) And Not Dilate(Range(LevelSet(M07, Ch07, Middle, 3), 80-5000, 0-1), 2).
- Set the Image to Display to Ch07. Set the Minimum and Maximum Area to 10 and 80, respectively. Set the Minimum and Maximum Aspect Ratio to 0.4 and 1, respectively. Click OK then OK again. Spot identification mask 1 is complete.
NOTE: Refer to section 10 in Supplement 1 - Full Protocol to create the masks, features and plots to identify the final MN population
- Create Spot Identification Mask 1:
11. Create masks, features and plots to identify the Mononucleated and Polynucleated populations
- Create the POLY mask. Click Analysis, then Masks, then New then Function. Under Function choose Range, under Mask choose Watershed(Dilate(LevelSet(M07, Ch07, Middle, 3), 2)). Set the image to display to Ch07. Set the Minimum and Maximum Area values to 135 and 5000, respectively. Set the Minimum and Maximum Aspect Ratio values to 0.4 and 1, respectively. Click OK. In the Name field, change the text to read POLY then click OK then Close. The Polynucleated cell mask is complete.
- Create the POLY Component Masks.
- POLY Component Mask 1: Click on the Analysis tab, then Masks, then New, then Function. Under Function select Component, and under Mask select the POLY mask. For Ranking Feature select Area, and for Sorting Order click the Descending radio button. Set Rank to 1. Click OK then OK again.
- POLY Component Masks 2, 3 and 4: Repeat all steps in 11.2.1 except set Rank to 2, 3 and 4 to create the individual component masks.
- Spot Count using POLY mask.
- Click the Analysis tab, then Features, then New. For Feature Type, select Spot Count. For Mask choose the POLY mask and set the Connectedness at 4. Click Set Default Name and click OK then Close to calculate the feature values.
- Click the Histogram icon. Select the Non-apoptotic population. For the X-axis feature choose the Spot Count_POLY_4 feature.
- MONO spot count region. Click on the Linear Region icon. Draw a region across bin 1 on the histogram created in 11.3.2. Call this region 1N.
- TRI spot count region. Click on the Linear Region icon. Draw a region across bin 3 on the histogram created in 11.3.2. Call this region 3N.
- QUAD MONO spot count region. Click on the Linear Region icon. Draw a region across bin 4 on the histogram created in 11.3.2. Call this region 4N.
- Identify the MONO population.
- Create the MONO Aspect Ratio Feature. Click the Analysis tab, then Features, then New. Under Feature Type, select the Aspect Ratio feature and under Mask select Component(1, Area, POLY, Descending). Click Set Default Name then click OK.
- Create the MONO Circularity Feature. With the Feature Manager window still open, click New. Under Feature Type, select the Circularity feature and under Mask select Component(1, Area, POLY, Descending). Click Set Default Name then click OK then click Close to calculate the feature values.
- For the circular MONO cells dot plot, click the Dot Plot icon. Select 1N as the parent population. For the X Axis Feature choose Circularity_Component(1, Area, POLY, Descending) and for the Y Axis Feature choose Aspect Ratio_Component(1, Area, POLY, Descending). Click OK. Click the Square Region button and draw a region around the cell population towards the top right portion of the plot. Name this region Circular_1N. Right click on the plot and click Regions. Highlight the Circular_1N region. Change the X Coordinates to 20 and 55 and change the Y Coordinates to 0.85 and 1.0. Click Close.
- Create the Area POLY/Area_M07 feature. Click the Analysis tab, then Features, then New. Under Feature Type, select the Area feature and under Mask select Component(1, Area, POLY, Descending). Click Set Default Name then click OK.
- With the Feature Manager window still open, click New then under Feature Type click the Combined radio button. From the list of features, highlight the Area_Component(1, Area, POLY, Descending) and click the down arrow to add it to the feature definition. Click the division symbol (/). Select the Area_M07 feature and click the down arrow to add it to the feature definition. Click Set Default Name and click OK. Click Close to start calculating the feature values.
- For the final MONO population dot plot, click the dot plot icon. Select Circular_1N as the parent population. For the X Axis Feature choose Aspect Ratio_M07 and for the Y Axis Feature choose Area_Component(1, Area, POLY, Descending) / Area_M07. Click OK. Click the Square Region button and draw a region around the majority of the cells. Name this region Mononucleated. Right click on the plot and click Regions. Highlight the Mononucleated region. Change the X Coordinates to 0.85 and 1.0 and change the Y Coordinates to 0.55 and 1.0. Click Close.
NOTE: Refer to section 11 in Supplement 1 - Full Protocol to create the masks, features and plots to identify the final trinucleated and polynucleated populations.
12. Create a custom view to examine the BNC and MN masks
- Click on the Image Gallery Properties button then click on the View tab. Click on the Composites tab then click New. Under Name type Ch01/Ch07. Click Add Image. Under Image choose Ch01 and set the Percent to 100. Click Add Image again, under Image choose Ch07 and set the Percent to 100.
- Click New and under Name type BNC and MN masks
- Click Add Column. Under Image Type choose Ch01 and under Mask choose None
- Click Add Column. Under Image Type choose Ch07 and under Mask choose None
- Click Add Column. Under Image Type choose Ch07 and under Mask choose BNC
- Click Add Column. Under Image Type choose Ch07 and under Mask choose MN mask
- Click Add Column. Under Image Type click the Composite radio button. The Ch01/Ch07 composite image should be automatically added to the view. Click OK to close the Image Gallery Properties window.
13. Create a custom view to examine the POLY mask
- Refer to section 13 in Supplement 1 - Full Protocol to create a custom view to examine the POLY mask
14. Create a statistics table to enumerate key events
- Click on the Reports tab then click Define Statistics Report. In the new window, click Add Columns.
- Add the BNC count statistic. Under Statistics select Count and under Selected Population choose the BNCs population. Click Add Statistics to add the statistic to the list.
- Repeat step 14.2 to create separate columns for the MN BNCs, MONO, TRI and POLY populations. Click Close then click OK.
- The data analysis template is complete (Figure 2). Save the template (File, Save as Template). The full mask list can be found in Supplement 2 - Mask List.
15. Batch process experiment files using the data analysis template
- Under the Tools menu click Batch Data Files then click Add Batch in the new window.
- In the new window click Add Files to select the experiment files (.rif) to add to the batch. Under the Select a template or data analysis file (.ast, .daf) option, click the open folder icon to browse to and open the data analysis template (.ast file) that was saved in step 14.4.
- Click the Preview Statistics Report button to preview the statistics table. No values will be displayed here since they have not yet been calculated. However, this step serves as a check to ensure the proper analysis template has been selected prior to running the batch.
- Click OK to close the current window. Then click Submit Batches to start the batch processing of all files.
- When the batch processing has completed, a .txt file will be available in the folder that contains all of the .rif files. Use these statistics to calculate genotoxicity and cytotoxicity.
16. Calculating the genotoxicity and cytotoxicity parameters
- Calculating genotoxicity: To calculate genotoxicity, use the statistics table created in 15.5. Divide the number of cells in the MN BNCs population by the number of cells in the BNCs population then multiply by 100:

- Calculating cytotoxicity: Determine the total number of POLY cells by summing the number of TRI and QUAD cells.
- Calculate the Cytokinesis-Block Proliferation Index (CBPI) by using the number of cells in the MONO, BNCs and POLY as follows:
![Cell proliferation index formula, CBPI=[(MONO)+(2×BNCs)+(3×POLY)]/(MONO+BNCs+POLY), equation.](/files/ftp_upload/59324/59324eq2.jpg "figure-protocol-2")
- Finally, calculate the cytotoxicity of each culture by using the CBPI values from the control cultures (C) and chemically exposed culture (T) as follows:

- Calculate the Cytokinesis-Block Proliferation Index (CBPI) by using the number of cells in the MONO, BNCs and POLY as follows:
Results
The analysis method outlined in this paper allows for the automatic identification and scoring of BNCs, with and without MN, to calculate genotoxicity. In addition, MONO and POLY cells are also automatically identified and scored to calculate cytotoxicity. Published scoring criteria6,34 that must be adhered to when scoring these events are implemented in the MIFC data analysis software. The results presented here indicate that statistically significant increases in MN frequency with increasing cytotoxicity can be detected following exposure of human lymphoblastoid TK6 cells to well-known MN inducing chemicals (Mitomycin C and Colchicine). Similar results for additional chemicals tested have been demonstrated in a separate publication32. In addition, results from the use of Mannitol show that non-MN inducing chemicals can also be correctly identified using the MIFC method outlined here. The parameters described in the protocol to create all masks, features and region boundaries will likely have to be adjusted if different cell types (e.g. Chinese Hamster cells) are used to perform the assay.
Figure 3 shows four selected panels to identify BNCs (Figure 3A-3D). Shown here is a histogram that enables selection of cells with two nuclei (Figure 3A) and bivariate plots that enable the selection of BNCs with similar circularity (Figure 3B), similar areas and intensities (Figure 3C) and BNCs that have well-separated, non-overlapping nuclei (Figure 3D) as per the scoring critieria6,34. Figure 3E shows the BF and Hoechst images as well as the BNC and MN masks indicating that BNCs with single or multiple MN can be identified and enumerated. This allows genotoxicity to be calculated by determining the rate of micronucleated BNCs in the final BNC population. Figure 4 shows the application of the Spot Count feature using the POLY mask to identify MONO, TRI and QUAD cells. The number of TRI and QUAD cells can then be summed to obtain the final number of POLY cells (Table 1). This enables cytotoxicity to be calculated by using the formula shown in the protocol. Therefore, each dose point in the experiment can be evaluated by both genotoxicity and cytotoxicity parameters.
Figure 5 shows genotoxicity and cytotoxicity values for the aneugen Colchicine, the clastogen Mitomycin C and for a negative control, Mannitol. For Colchicine (Figure 5A) the 0.02 through 0.05 μg/mL doses produced statistically significant increases in MN frequency, ranging from 1.28% to 2.44% respectively over the solvent control (Table 1). In the case of Mitomycin C (Figure 5B) the two top doses of 0.4 and 0.5 μg/mL produced statistically significant MN frequencies when compared to solvent controls. These MN frequencies were 0.93% at 0.4 μg/mL and 1.02% at 0.5 μg/mL (Table 2). Finally, for Mannitol (Figure 5C), no doses tested induce a cytotoxicity over 30%, nor did they produce significant increases in MN frequency when compared to solvent controls, as expected (Table 3).

Figure 1: MIFC instrument settings. A screenshot of the MIFC settings as described in section step 7 of the protocol. (A) Setting the 405 nm laser power to 10 mW. (B) Setting the BF channels 1 and 9. (C) Selecting the 60x magnification objective lens. (D) Selecting the slowest flow speed which generates imagery with the highest resolution. (E) Specifying the number of events to be collected to 20,000. (F) Clicking the Load button to begin the sample load process. (G) Clicking the Acquire button to begin acquiring imagery. (H) Clicking the Return button to return any unused sample. (I) Scatterplot of BF Aspect Ratio versus BF Area for the selection of single cells. (J) Scatterplot of Hoechst Gradient RMS versus BF Gradient RMS for the selection of focused cells. (K) Histogram of Hoechst intensity for the selection of DNA positive cells. Please click here to view a larger version of this figure.

Figure 2: Analysis software gating strategy. A screenshot of the gating strategy described in section 9 of the protocol. Regions are shown in sequential order for the identification of binucleated cells (red box), micronuclei (yellow box), and mono- and polynucleated cells (blue box). Please click here to view a larger version of this figure.
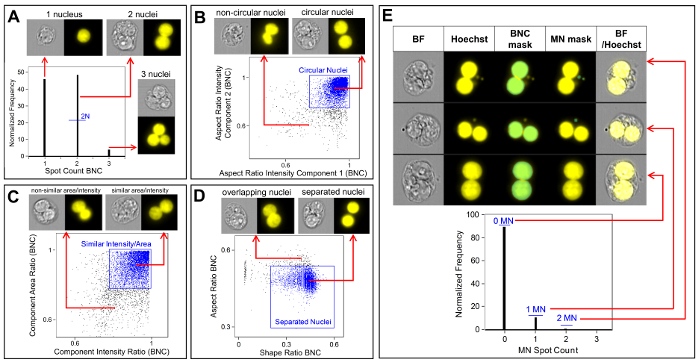
Figure 3: Identification and scoring of BNCs with and without MN. (A) Selection of cells that have two distinct nuclei. (B) Identification of binucleated cells (BNCs) that have two highly circular nuclei through the use of the Aspect Ratio Intensity feature. (C) Selection of BNCs that have nuclei with similar areas and intensities. This is accomplished by calculating the ratio of the area of both nuclei and the ratio of the aspect ratio of both nuclei. (D) Use of the Shape Ratio and Aspect Ratio features to identify BNCs that have two well-separated nuclei. (E) The Spot Count feature using the micronucleus (MN) mask demonstrating that BNCs with single or multiple MN can be identified and enumerated. Please click here to view a larger version of this figure.

Figure 4: Identification and scoring of MONO and POLY cells. Use of the spot count feature to identify and enumerate mono-, tri- and quadranucleated cells. Component mask 1 allows the identification of mononucleated cells (top image). Component masks 1 through 3 allows the identification of trinucleated cells (middle image). Component masks 1 through 4 allows the identification of quadranucleated cells (bottom image). This figure has been modified from Rodrigues 201832. Please click here to view a larger version of this figure.

Figure 5: Quantification of cytotoxicity. Cytotoxicity quantified using the cytokinesis block proliferation index (black circles) and genotoxicity quantified using the percentage of MN (clear bars) following a 3 h exposure and 24 h recovery for (A) Colchicine, (B) Mitomycin C and (C) Mannitol. Statistically significant increases in MN frequency compared to controls are indicated by stars (chi-squared test; *p < 0.05, **p < 0.01, ***p < 0.001). All quantities are the average of two replicates at each dose point. This figure has been modified from Rodrigues 201832. Please click here to view a larger version of this figure.

Table 1: The parameters required to calculate cytotoxicity (the number of mono-, bi- and polynucleated cells) and genotoxicity (the number and percentage of micronucleated binucleated cells) for Colchicine. All calculated quantities are the average of two replicates at each dose point.

Table 2: The parameters required to calculate cytotoxicity (the number of mono-, bi- and polynucleated cells) and genotoxicity (the number and percentage of micronucleated binucleated cells) for Mitomycin C. All calculated quantities are the average of two replicates at each dose point.

Table 3: The parameters required to calculate cytotoxicity (the number of mono-, bi- and polynucleated cells) and genotoxicity (the number and percentage of micronucleated binucleated cells) for Mannitol. All calculated quantities are the average of two replicates at each dose point.
Supplement 1: Full Protocol. Please click here to download this file.
Supplement 2: Mask List. Please click here to download this file.
Discussion
In a recent publication Verma et al. underscored the importance of developing a system that combines the high-throughput advantage of flow cytometry with the data and image storage benefits of image analysis35. The MIFC in vitro MN assay described in this paper satisfies this quotation and has the potential to overcome many of the aforementioned challenges in microscopy and flow cytometry methods. The protocol described here demonstrates that both cytotoxicity and genotoxicity can be evaluated using MIFC. Sample preparation, cellular staining and data collection are straightforward but there are some critical steps in the protocol that should always be implemented. Addition of potassium chloride (KCl) to the cells is critical to swell the cells, generating separation between the main nuclei. This ensures that the masking algorithm can identify all individual nuclei in BNCs and POLY cells (POLY cells) which is necessary for their enumeration. Additionally, KCL provides separation between nuclei and MN, which is essential for accurate MN masking and quantitation. Furthermore, the use of Formalin following the addition of KCl prevents cells from lysing during centrifugation. The addition of Cytochalasin B causes TK6 cells that have undergone more than one nuclear division to be quite large. As a result, the cytoplasm becomes fragile and can lyse if centrifugation is performed immediately after the addition of KCl. Moreover, it is very important to introduce Hoechst to the sample according to number of cells in the sample and not according to a final concentration. For example, a final concentration of 10 µg/mL of Hoechst will uniformly stain a sample of 1 x 10⁶ cells but may not adequately stain a sample containing 5 x 10⁶ cells and can result in many cells with dimly stained nuclei, making analysis difficult. It is also important to note that Hoechst can be replaced with another DNA dye such as DAPI if the MIFC is equipped with the 405 nm excitation laser or DRAQ5 if the MIFC is equipped with the 488 nm and/or 642nm excitation laser(s). If modifying the nuclear stain, it is critical to titrate the stain in order to find the appropriate concentration for the required/desired laser power.
When collecting data on the MIFC it is important to determine the optimal region boundaries for the Gradient RMS features. The boundaries presented in this protocol may require adjustment due to some slight variations between MIFC instruments. The application of this feature during data collection is essential to ensure that highly focused imagery is captured. If data files contain many blurred or unfocused images, it is probable that the masking algorithms in the analysis software will incorrectly highlight staining artifacts in the blurred areas, leading to a high number of false positive artifacts being scored as MN. Although the image processing techniques described here can be difficult, once an analysis template has been developed in the MIFC software, batch processing allows for data files to be automatically analyzed, eliminating user intervention and therefore, scorer bias. Also, if a cell line other than TK6 cells are used to perform the assay, it will be necessary to modify the masks and region boundaries as the morphological properties (e.g., size) of cells will differ from those of TK6 cells.
The results presented here (Figure 5) show statistically significant increases in MN induction when exposing TK6 cells to various doses of Mitomycin C and Colchicine. Statistically significant increases in the frequency of MN when compared to solvent controls were observed for several doses in both chemicals. In addition, no dose of Mannitol induced a cytotoxicity over 30%, nor a statistically significant increase in the frequency of MN when compared to solvent controls, as expected. The protocol described in this paper using MIFC to perform the in vitro MN assay gives expected results from both positive and negative control chemicals. It is very important to perform a number of experiments using both solvent controls and negative control chemicals to develop baseline values of both the frequency of MN as well as the Cytokinesis Block Proliferation Index (CBPI). For genotoxicity, statistically significant increases in MN frequency are determined through comparison to baseline MN frequencies which must be well-known for the cell type being used. In addition all cytotoxicity calculations are based on the CBPI of the control samples and therefore, baseline rates of MONO, BNCs and POLY cells must be well quantified in controls.
Several limitations and advantages of using MIFC in the context of the MN assay have been described in previous work29,32. The main limitations concern lower MN frequencies when compared to microscopy, which probably results from both the lack of flexibility when implementing the scoring criteria in the analysis software as well as the limited depth of field of the MIFC. Well-contoured masks can be created to accurately identify the main nuclei but MN that are touching (or very close to) the main nuclei might be captured within the BNC mask. Additionally, very small MN that can be rather easily scored using microscopy are probably incorrectly missed when using MIFC due the lower limit on the area parameter of the MN mask to avoid scoring small artifacts. In addition to the difficulties present in image-based data analysis, due to its design, MIFC obtains two dimensional projection images of three dimensional cellular objects. This likely causes some MN to be captured at a different depth of focus that the two main MN, making them appear very dim and un-scorable using masking. Moreover, a small fraction of MN could reside behind one of the two main nuclei, making them impossible to visualize and score. Therefore, considering these difficulties, caution should be used when interpreting significant increases in MN frequency at low doses.
Despite these shortcomings, the MIFC method described here offers several advantages over other techniques. Fenech et al. proposed criteria and guidelines that should be considered when developing automated systems and methodologies for MN assays36. These include, but are not limited to, direct visualization of the main nuclei and cytoplasm, determination of the frequency of MN from various doses of the chemical or agent being tested and the ability to quantitate morphology and determine the position of all nuclei and MN to ensure they are within the cytoplasm. This paper shows that the MIFC method developed to perform the in vitro MN assay satisfies (or possesses the potential to satisfy) these criteria. Specifically, images of the nuclei and MN can be captured by the fluorescent lasers while cytoplasmic imagery can be obtained by using the BF LED. Imagery of cells with normal nuclear morphology can be automatically differentiated from those cells with irregular morphology using a combination of advanced masks and features. The results presented for Colchicine and Mitomycin C (Figure 5) show that both genotoxicity and cytotoxicity can be assessed at various doses when compared to solvent controls and that statistically significant MN frequencies are observed where expected. Furthermore, the OECD Test Guideline 487 recommends scoring 2,000 BNCs per test concentration to assess the presence of MN to determine genotoxicity along with at least 500 cells per test concentration to determine cytotoxicity9; this can take over 1 h using manual microscopy. The protocol and results in this paper show that an average of about 6,000 BNCs, 16,000 MONO cells, and 800 POLY cells were captured and scored per test concentration in about 20 min. The rapid rate of data acquisition and the high numbers of candidate cells scored in such a short time highlight another important advantage of employing MIFC to perform the in vitro MN assay.
While the results presented in this paper are encouraging, they are representative of an early proof-of-concept method. This work should be followed up by more thorough investigation of a larger, more diverse chemical set that covers multiple classes and mechanisms of genotoxicity and cytotoxicity such as those suggested by Kirkland et al.37 Conducting such studies are time consuming and labor intensive, and fall outside of the scope of this paper however, these larger scale studies will provide valuable insight into the ability of the method to reliably identify weakly genotoxic agents. The methodology presented here has not yet been miniaturized to a microwell format, which would allow more rapid and efficient screening across a larger dose range. As such, in its current form, the MIFC-based in vitro MN assay presented here may be best suited for labor-intensive follow-up studies or research into good laboratory practices. However, the method will continue to be optimized and validated, and possesses the potential to allow for increased flexibility in detecting chemical specific events related to morphology, such as aneugen exposure that increases the proportion of cells with non-circular nuclei that are still scorable38. Finally, the MIFC method presents an opportunity to introduce additional biomarkers into the MN assay (e.g. kinetochore staining) to provide a more comprehensive view of the mechanism of MN induction.
Disclosures
The author is employed by Luminex Corporation, the maker of the ImageStream multispectral imaging flow cytometer that was used in this work.
Acknowledgements
The author thanks Christine Probst (Luminex Corporation) for her efforts in developing previous forms of the data analysis template, as well as Dr. Haley Pugsley (Luminex Corporation) and Dr. Phil Morrissey (Luminex Corporation) for reviewing and editing the manuscript.
Materials
| Name | Company | Catalog Number | Comments |
|---|---|---|---|
| 15 mL centrifuge tube | Falcon | 352096 | |
| Cleanser - Coulter Clenz | Beckman Coulter | 8546931 | Fill container with 200 mL of Cleanser. https://www.beckmancoulter.com/wsrportal/page/itemDetails?itemNumber=8546931#2/10//0/25/1/0/asc/2/8546931///0/1//0/ |
| Colchicine | MilliporeSigma | 64-86-8 | |
| Corning bottle-top vacuum filter | MilliporeSigma | CLS430769 | 0.22 um filter, 500 mL bottle |
| Cytochalasin B | MilliporeSigma | 14930-96-2 | 5 mg bottle |
| Debubbler - 70% Isopropanol | EMD Millipore | 1.3704 | Fill container with 200 mL of Debubbler. http://www.emdmillipore.com/US/en/product/2-Propanol-70%25-%28V%2FV%29-0.1-%C2%B5m-filtred,MDA_CHEM-137040?ReferrerURL=https%3A%2F%2Fwww.google.com%2F |
| Dimethyl Sulfoxide (DMSO) | MilliporeSigma | 67-68-5 | |
| Dulbecco's Phosphate Buffered Saline 1X | EMD Millipore | BSS-1006-B | PBS Ca++MG++ Free |
| Fetal Bovine Serum | HyClone | SH30071.03 | |
| Formaldehyde, 10%, methanol free, Ultra Pure | Polysciences, Inc. | 04018 | This is what is used for the 4% and 1% Formalin. CAUTION: Formalin/Formaldehyde toxic by inhalation and if swallowed. Irritating to the eyes, respiratory systems and skin. May cause sensitization by inhalation or skin contact. Risk of serious damage to eyes. Potential cancer hazard. http://www.polysciences.com/default/catalog-products/life-sciences/histology-microscopy/fixatives/formaldehydes/formaldehyde-10-methanol-free-pure/ |
| Hoechst 33342 | Thermo Fisher | H3570 | 10 mg/mL solution |
| Mannitol | MilliporeSigma | 69-65-8 | |
| MEM Non-Essential Amino Acids 100X | HyClone | SH30238.01 | |
| MIFC - ImageStreamX Mark II | EMD Millipore | 100220 | A 2 camera ImageStreamX Mark II eqiped with the 405nm, 488nm, and 642nm lasers was used. http://www.emdmillipore.com/US/en/life-science-research/cell-analysis/amnis-imaging-flow-cytometers/imagestreamx-Mark-ii-imaging-flow-cytometer/VaSb.qB.QokAAAFLzRop.zHe,nav?cid=BI-XX-BDS-P-GOOG-FLOW-B325-0006 |
| MIFC analysis software - IDEAS | EMD Millipore | 100220 | The companion software to the MIFC (ImageStreamX MKII) |
| MIFC software - INSPIRE | EMD Millipore | 100220 | This is the software that runs the MIFC (ImageStreamX MKII) |
| Mitomycin C | MilliporeSigma | 50-07-7 | |
| NEAA Mixture 100X | Lonza BioWhittaker | 13-114E | |
| Penicllin/Streptomycin/Glutamine solution 100X | Gibco | 15070063 | |
| Potassium Chloride (KCl) | MilliporeSigma | P9541 | |
| Rinse - Ultrapure water or deionized water | NA | NA | You can use any ultrapure water or deionized water. Fill container with 900 mL of Rinse. |
| RNase | MilliporeSigma | 9001-99-4 | |
| RPMI-1640 Medium 1X | HyClone | SH30027.01 | |
| Sheath - PBS | EMD Millipore | BSS-1006-B | This is the same as Dulbecco's Phosphate Buffered Saline 1X Ca++MG++ free. Fill container with 900mL of Sheath. |
| Sterile water | HyClone | SH30529.01 | |
| Sterilizer - 0.4-0.7% Hypochlorite | VWR | JT9416-1 | This is assentually 10% Clorox bleach that can be made by deluting Clorox bleach with water. Fill container with 200 mL of Sterilzer. |
| System Calibration Reagent - SpeedBead | EMD Millipore | 400041 | Each tube holds ~10 mL. https://www.emdmillipore.com/US/en/life-science-research/cell-analysis/amnis-imaging-flow-cytometers/support-training/XDqb.qB.wQMAAAFLBDUp.zHu,nav |
| T25 flask | Falcon | 353109 | |
| T75 flask | Falcon | 353136 | |
| TK6 cells | MilliporeSigma | 95111735 |
References
- Bonassi, S., et al. An increased micronucleus frequency in peripheral blood lymphocytes predicts the risk of cancer in humans. Carcinogenesis. 28 (3), 625-631 (2007).
- Fenech, M. The in vitro micronucleus technique. Mutation Research - Fundamental and Molecular Mechanisms of Mutagenesis. 455 (1-2), 81-95 (2000).
- Fenech, M. The Lymphocyte Cytokinesis-Block Micronucleus Cytome Assay and its Application in Radiation Biodosimetry. Health Physics. 98 (2), 234-243 (2010).
- Hintzsche, H., et al. Fate of micronuclei and micronucleated cells. Mutation Research - Reviews in Mutation Research. 771, 85-98 (2017).
- Fenech, M. The advantages and disadvantages of the cytokinesis-block micronucleus method. Mutation Research. 392 (1-2), 11-18 (1997).
- Fenech, M. Cytokinesis-block micronucleus cytome assay. Nature Protocols. 2 (5), 1084-1104 (2007).
- Fenech, M., Holland, N., Chang, W. P., Zeiger, E., Bonassi, S. The HUman MicroNucleus Project - An international collaborative study on the use of the micronucleus technique for measuring DNA damage in humans. Mutation Research - Fundamental and Molecular Mechanisms of Mutagenesis. 428 (1-2), 271-283 (1999).
- Kirsch-Volders, M., et al. Report from the in vitro micronucleus assay working group. Mutation Research - Genetic Toxicology and Environmental Mutagenesis. 540 (2), 153-163 (2003).
- OECD Library. Test No. 487: In vitro Mammalian Cell Micronucleus Test. OECD Guidelines for the Testing of Chemicals, Section 4. , (2016).
- Aardema, M. J., et al. SFTG international collaborative study on in vitro micronucleus test. III. Using CHO cells. Mutation Research - Genetic Toxicology and Environmental Mutagenesis. 607 (1), 61-87 (2006).
- Clare, M. G., et al. SFTG international collaborative study on in vitro micronucleus test. II. Using human lymphocytes. Mutation Research - Genetic Toxicology and Environmental Mutagenesis. 607 (1), 37-60 (2006).
- Lorge, E., et al. SFTG international collaborative study on in vitro micronucleus test. I. General conditions and overall conclusions of the study. Mutation Research - Genetic Toxicology and Environmental Mutagenesis. 607 (1), 13-36 (2006).
- Oliver, J., et al. SFTG international collaborative study on in vitro micronucleus test. V. Using L5178Y cells. Mutation Research - Genetic Toxicology and Environmental Mutagenesis. 607 (1), 125-152 (2006).
- Wakata, A., et al. SFTG international collaborative study on in vitro micronucleus test. IV. Using CHL cells. Mutation Research - Genetic Toxicology and Environmental Mutagenesis. 607 (1), 88-124 (2006).
- Fenech, M., et al. Intra- and inter-laboratory variation in the scoring of micronuclei and nucleoplasmic bridges in binucleated human lymphocytes: Results of an international slide-scoring exercise by the HUMN project. Mutation Research - Genetic Toxicology and Environmental Mutagenesis. 534 (1-2), 45-64 (2003).
- Decordier, I., et al. Automated image analysis of cytokinesis-blocked micronuclei: an adapted protocol and a validated scoring procedure for biomonitoring. Mutagenesis. 24 (1), 85-93 (2009).
- Decordier, I., et al. Automated image analysis of micronuclei by IMSTAR for biomonitoring. Mutagenesis. 26 (1), 163-168 (2011).
- Schunck, C., Johannes, T., Varga, D., Lorch, T., Plesch, A. New developments in automated cytogenetic imaging: unattended scoring of dicentric chromosomes, micronuclei, single cell gel electrophoresis, and fluorescence signals. Cytogenetic and Genome Research. 104 (1-4), 383-389 (2004).
- Rossnerova, A., Spatova, M., Schunck, C., Sram, R. J. Automated scoring of lymphocyte micronuclei by the MetaSystems Metafer image cytometry system and its application in studies of human mutagen sensitivity and biodosimetry of genotoxin exposure. Mutagenesis. 26 (1), 169-175 (2011).
- Nüsse, M., Marx, K. Flow cytometric analysis of micronuclei in cell cultures and human lymphocytes: Advantages and disadvantages. Mutation Research - Genetic Toxicology and Environmental Mutagenesis. 392 (1-2), 109-115 (1997).
- Avlasevich, S. L., Bryce, S. M., Cairns, S. E., Dertinger, S. D. In vitro micronucleus scoring by flow cytometry: Differential staining of micronuclei versus apoptotic and necrotic chromatin enhances assay reliability. Environmental and Molecular Mutagenesis. 47 (1), 56-66 (2006).
- Bryce, S. M., Bemis, J. C., Avlasevich, S. L., Dertinger, S. D. In vitro micronucleus assay scored by flow cytometry provides a comprehensive evaluation of cytogenetic damage and cytotoxicity. Mutation Research/Genetic Toxicology and Environmental Mutagenesis. 630 (1-2), 78-91 (2007).
- Bryce, S. M., et al. Flow cytometric 96-well microplate-based in vitro micronucleus assay with human TK6 cells: Protocol optimization and transferability assessment. Environmental and Molecular Mutagenesis. 54 (3), 180-194 (2013).
- Fenech, M. Commentary on the SFTG international collaborative study on the in vitro micronucleus test: to Cyt-B or not to Cyt-B. Mutation Research. 607 (1), 9-12 (2006).
- Basiji, D. A. Methods in Molecular Biology. 1389, 13-21 (2016).
- Rodrigues, M. A., Beaton-Green, L. A., Kutzner, B. C., Wilkins, R. C. Automated analysis of the cytokinesis-block micronucleus assay for radiation biodosimetry using imaging flow cytometry. Radiation and Environmental Biophysics. 53 (2), 273-282 (2014).
- Rodrigues, M. A., Beaton-Green, L. A., Kutzner, B. C., Wilkins, R. C. Multi-parameter dose estimations in radiation biodosimetry using the automated cytokinesis-block micronucleus assay with imaging flow cytometry. Cytometry Part A. 85 (10), 883-893 (2014).
- Rodrigues, M. A., Beaton-Green, L. A., Wilkins, R. C. Validation of the cytokinesis-block micronucleus assay using imaging flow cytometry for high throughput radiation biodosimetry. Health Physics. 110 (1), 29-36 (2016).
- Rodrigues, M. A., Probst, C. E., Beaton-Green, L. A., Wilkins, R. C. Optimized automated data analysis for the cytokinesis-block micronucleus assay using imaging flow cytometry for high throughput radiation biodosimetry. Cytometry Part A. 89 (7), 653-662 (2016).
- Rodrigues, M. A., Probst, C. E., Beaton-Green, L. A., Wilkins, R. C. The effect of an optimized imaging flow cytometry analysis template on sample throughput in the reduced culture cytokinesis-block micronucleus assay. Radiation Protection Dosimetry. 172 (1-3), 223-229 (2016).
- Wang, Q., et al. Automated Triage Radiation Biodosimetry: Integrating Imaging Flow Cytometry with High-Throughput Robotics to Perform the Cytokinesis-Block Micronucleus Assay. Radiation Research. 191 (4), 342-351 (2019).
- Rodrigues, M. A. Automation Of The In vitro Micronucleus Assay Using The ImageStream® Imaging Flow Cytometer. Cytometry Part A. 93, 706-726 (2018).
- Rodrigues, M. A., Beaton-Green, L. A., Wilkins, R. C., Fenech, M. F. The potential for complete automated scoring of the cytokinesis block micronucleus cytome assay using imaging flow cytometry. Mutation Research/Genetic Toxicology and Environmental Mutagenesis. 836, 53-64 (2018).
- Fenech, M., et al. HUMN project: Detailed description of the scoring criteria for the cytokinesis-block micronucleus assay using isolated human lymphocyte cultures. Mutation Research - Genetic Toxicology and Environmental Mutagenesis. 534 (1-2), 65-75 (2003).
- Verma, J. R., et al. Evaluation of the automated MicroFlow® and Metafer™ platforms for high-throughput micronucleus scoring and dose response analysis in human lymphoblastoid TK6 cells. Archives of Toxicology. 91 (7), 2689-2698 (2017).
- Fenech, M., et al. HUMN project initiative and review of validation, quality control and prospects for further development of automated micronucleus assays using image cytometry systems. International Journal of Hygiene and Environmental Health. 216 (5), 541-552 (2013).
- Kirkland, D., et al. Updated recommended lists of genotoxic and non-genotoxic chemicals for assessment of the performance of new or improved genotoxicity tests. Mutation Research/Genetic Toxicology and Environmental Mutagenesis. 795, 7-30 (2016).
- Verma, J. R., et al. Investigating FlowSight® imaging flow cytometry as a platform to assess chemically induced micronuclei using human lymphoblastoid cells in vitro. Mutagenesis. 33 (4), 283-289 (2018).
Reprints and Permissions
