This protocol describes the generation of mixed murine bone marrow chimeras with spontaneous autoimmune germinal centers, in which autoreactive lymphocytes carry a photoactivatable green fluorescent protein (PA-GFP) reporter. This provides the ability to link cellular location in tissues with downstream molecular and functional analyses.
Method Article
Interrogating Individual Autoreactive Germinal Centers by Photoactivation in a Mixed Chimeric Model of Autoimmunity
In This Article
Summary
Abstract
Autoimmune diseases present a significant health burden. Fundamental questions regarding the development and progression of autoimmune disease remain unanswered. One requirement for advancements in our understanding of the underlying disease mechanisms and cellular dynamics is the precise coupling of the microanatomical location of cell subsets with downstream molecular or functional analyses; a goal that has traditionally been difficult to achieve. The development of stable photoactivatable biological fluorophores and their integration into reporter strains has recently enabled precise microanatomical labeling and tracking of cellular subsets in murine models. Here, we describe how the ability to analyze autoreactive lymphocytes from single germinal centers may help to provide novel insights into autoimmunity, using the combination of a novel chimeric model of autoimmunity with a photoactivatable reporter as an example. We demonstrate a procedure for generating mixed chimeras with spontaneous autoreactive germinal centers populated by lymphocytes carrying a photoactivatable green fluorescent protein reporter. Using in vivo labeling strategies, single germinal centers can be visualized in explanted lymphoid tissues and their cellular constituents photoactivated by two-photon microscopy. Photoactivated lymphocytes from single germinal centers can then be analyzed or sorted flow cytometrically, as single cells or in bulk, and may be subjected to additional downstream molecular and functional analyses. This approach may directly be applied to provide renewed insights in the field of autoimmunity, but the procedure for generating bone marrow chimeras and the photoactivation procedure may additionally find broad application in studies of infectious diseases and tumor metastases.
Introduction
The incidence of autoimmune disease has risen rapidly in the past decades, particularly in Western societies. Today, autoimmune disease ranks third on the list of most prevalent causes of morbidity and mortality in the Western world1. Fundamental questions regarding the development and progression of autoimmune disease remain unanswered. One requirement for advancements in our understanding of the underlying disease mechanisms and cellular dynamics is the precise coupling of the microanatomical location of cell subsets with downstream molecular or functional analyses. In the past decade, the development of a number of stable photoconvertible, photoactivatable, or photoswitchable biological fluorophores and their integration into reporter strains has enabled the precise microanatomical labeling and tracking of cellular subsets in murine models.
Kaede, a photoconvertible fluorescent protein originating from a stony coral, undergoes irreversible photoconversion from green fluorescence to red fluorescence upon exposure to violet or ultraviolet light2. Initially employed to follow the dynamic behavior of individual cells in developing organotypic brain slices3, generation of a Kaede knock-in mouse subsequently allowed monitoring cellular movement in vivo, and the system was applied to analyses of immune cell migration to and from lymph nodes4. This approach was subsequently refined with a second-generation reporter5. A similar reporter is Dendra6, which was recently used to track lymph node metastases in vivo7.
The first photoactivatable protein developed was a green fluorescent protein (GFP) engineered with a single point mutation (T203H), leading to a very low absorbance in the wavelength region from 450 to 550 nm8. After photoactivation by violet light, this photoactivatable green fluorescent protein (PA-GFP) switches its absorption maximum from ~400 to ~500 nm, yielding an approximate 100-fold intensity increase when excited with a wavelength of 488 nm. The generation of transgenic mice in which all hematopoietic cells express PA-GFP allowed, for the first time, in-depth analyses of B cell selection in anatomically defined light and dark zones of the germinal center9.
Whereas photoactivation is an irreversible conversion from a non-fluorescent state to a fluorescent state, and photoconversion is a one-way transition from one wavelength to another, photoswitchable proteins are able to shuttle between both conditions10. This latter capacity was recently harnessed to engineer optical control of protein activity11.
Utilizing the PA-GFP reporter, we recently characterized the B cell repertoires of single germinal centers in a novel model of spontaneous lupus-like autoimmunity12. This model is based on mixed chimeras with 1 part bone marrow harboring an autoreactive B cell receptor knock-in with specificity for ribonuclear-protein complexes (564Igi13,14) combined with 2 parts bone marrow from any desired donor. At approximately 6 weeks post reconstitution, homeostatic conditions are achieved in which spontaneous autoreactive germinal centers are present in the spleen and the cutaneous lymph nodes. Notably, the germinal center B cell population is almost exclusively (~95%) composed of cells derived from the non-564Igi compartment, and these wild-type-derived B cells have become autoreactive. Therefore, the model allows a ‘plug-and-play’ approach to analyses of autoreactive germinal center B cells using various transgenes, knock-outs and reporters. Here, we describe the procedure for generating mixed chimeras with spontaneous autoreactive germinal centers populated by lymphocytes carrying the PA-GFP reporter. Using in vivo labeling strategies, single germinal centers can be visualized in explanted lymphoid tissues and their cellular constituents photoactivated using a two-photon microscope. Photoactivated lymphocytes from single germinal centers can subsequently be analyzed by flow cytometry or sorted by fluorochrome-activated cell sorting (FACS) and subjected to additional downstream molecular and functional analyses. The ability to analyze autoreactive lymphocytes from single germinal centers may directly be applied to provide renewed insights in the field of autoimmunity, but the techniques and approaches described may additionally find relevant applications in studies of infectious diseases and tumor metastases.
Protocol
All animal use conformed to the European Community guidelines and was approved by the Danish Animal Research Inspectorate (2017-15-0201-01348).
1. General mouse husbandry and preparation of buffers and tools
- House mouse lines under specific pathogen free (SPF) conditions, with periodic monitoring of health status according to standard guidelines.
- Optional: verify the absence of spontaneous germinal centers in naïve mice due to non-monitored adventitious infections. This can be done either by immunofluorescence microscopy (presence of germinal center structures) or flow cytometry (frequency of germinal center B cells) as previously described12.
NOTE: Either females or males can be used. Generally, it is ideal to sex match donors and recipients, as a mismatch of sex can theoretically lead to alloreactivity towards the male Y-antigen by female recipients/donors15. - Use CD45.1 recipients (B6.SJL-Ptprca Pepcb/BoyJ) at around 6-10 weeks of age. Use 564Igi (B6.Cg-Ightm1(Igh564)TikIgktm1(Igk564)Tik/J) and PA-GFP (B6.Cg-Tg(UBC-PA-GFP)1Mnz/J) donors at 6-12 weeks of age.
- Sterilize the surgical tools (straight fine scissors and Dumont forceps #5 and #7) by autoclaving them according to routine sterilization guidelines.
- Prepare 500 mL of bone marrow (BM) buffer containing phosphate-buffered saline (PBS), 2% Fetal Bovine Serum (FBS), 1 mM ethylenediaminetetraacetic acid (EDTA) at pH 7.4. To prepare BM buffer, add 10 mL of heat-inactivated (1 hour in a 56 °C water bath to inactivate the complement) FBS and 1.25 mL of a 400 mM EDTA solution (adjusted to pH 7.4) to 500 mL of PBS, pH 7.4, and mix well. Filter the buffer using a 0.2 µm filter flask.
- Prepare 10 mL of red blood cell (RBC) lysis buffer (155 mM NH4Cl, 12 mM NaHCO3, 0.1 mM EDTA) by diluting 1 mL of a 10x stock to 10 mL of total volume with reagent grade water. Prepare 50 mL of PBS with 5 mM EDTA, pH 7.4.
2. Establishment of mixed bone marrow chimeras
- Irradiation of recipients (Day 0)
- Place the CD45.1 bone marrow recipients in an appropriate irradiation container and irradiate with 1,100 Rad in a gamma irradiator.
NOTE: Alternative irradiation sources can be used. Regardless of the source, the dose/timing has to be optimized to yield maximal myeloablative effect with minimal collateral tissue damage to the animals. - Place on antibiotic water ad libitum (1 mg of sulfadiazin and 0.2 mg of trimethoprim/mL drinking water).
- Place the CD45.1 bone marrow recipients in an appropriate irradiation container and irradiate with 1,100 Rad in a gamma irradiator.
- Extraction of bones (Day 1)
- Anesthetize the 564Igi bone marrow donors by continuous flow of 4% isoflurane in air, and euthanize by cervical dislocation. Spray down the donors with ethanol and place them on sterile surgical pads in the flow hood. Proceed to work maintaining sterile conditions, using sterile buffers and equipment.
- To extract the femur and tibia, first make an incision around the ankle and extend upwards all the way to the hip using straight fine scissors. Using a heavy-duty forceps or thumb and index fingers, pull the skin up and off the leg towards the body. Similarly pull the skin down and off the foot.
- Pop out the knee and ankle joints by grabbing the leg at the hip and pulling the foot forcefully. Proceed to break the ankle joint and pull the foot towards the body while holding on to the tibia, thereby stripping the tendons and muscles off the tibia.
- Break the knee joint to release the tibia, and similarly pull this towards the body while holding on to the femur, thereby stripping tendons and muscles off the femur. Make an incision at the hip joint and cut the tendons, then pull the femur out from the hip socket. Repeat steps 2.2.2 – 2.2.4 for the contralateral side.
- Clean the bones carefully by rubbing them with a coarse paper towel in order to remove all remaining muscle and connective tissue. Then rinse them in ice-cold BM buffer before finally transferring them to fresh cold BM buffer on ice using a pair of Dumont #7 forceps. Repeat step 2.2 for the PA-GFP donors.
NOTE: The number of bone marrow cells from a single donor varies according to sex and age. Scale the number of donors according to desired input bone marrow ratios and numbers and the desired number of recipients. If donors are scarce, the front limbs can be included for bone marrow extraction. This typically yields an additional 1/3 to ½ of the cells obtained from the hind limbs. Typically, anywhere from 50-200 million cells can be recovered per donor, depending on age, sex, background and whether only hind or both hind and front limbs are included.
- Bone marrow cell extraction
- Prepare the mortar by rinsing in ice-cold BM buffer. Drain the rinse buffer and use an electric pipette controller with a 10 mL serological pipette to add 10 mL of fresh ice-cold BM buffer.
- Transfer the bones from the 564Igi donors to the mortar using a pair of Dumont #7 forceps and use the pestle to crush and grind the bones to release the bone marrow. Aspirate the bone marrow extract with a 10 mL serological pipette and pass it through a 70 µm cell strainer into a 50 mL tube on ice.
- Add an additional 10 mL of fresh ice-cold BM buffer to the mortar and repeat to ensure complete recovery of cells. Remove bone material from the mortar with a paper towel, discard appropriately, and rinse the mortar carefully with 70% ethanol, followed by BM buffer. Repeat step 2.3 for the PA-GFP bone marrow donor group.
- Counting bone marrow cells
- Using a micropipette, place a droplet containing 40 µL of RBC lysis buffer on a piece of plastic paraffin film. Invert the 564Igi bone marrow tube a few times and take out a 10 µL aliquot using a micropipette. Mix it with the 40 µL of RBC lysis buffer drop.
- Subsequently add 50 µL of Trypan blue (0.4% in aqueous solution) to the drop. Immediately load 10 µL of the resulting mix in a Burker-Türk hemocytometer and count under the microscope. Calculate the number of cells per mL, using the 10x total dilution factor. Confirm adequate cell viability >90%. Repeat step 2.4 for the PA-GFP bone marrow donor group.
- Preparing donor suspensions
- Based on the counts obtained in step 2.4 and the desired number of recipients, calculate the volume of donor bone marrow from each of the two donor groups to be mixed in the donor mix tube.
NOTE: For example, for setting up one group of 1:2 mixed 564Igi:PA-GFP chimeras with 6 CD45.1 recipients: each recipient requires 20 x 106 donor cells total, 1 part 564Igi and 2 parts PA-GFP. Thus, this requires 6 x 1/3 x 20 x 106 = 40 x 106 564Igi donor cells and 6 x 2/3 x 20 x 106 = 80 x 106 PA-GFP donor cells. - Mix the appropriate amounts of PA-GFP and 564lgi donor marrow in a 50 mL conical tube. Centrifuge the bone marrow mixture at 200 x g and 4 °C for 10 minutes using a swinging bucket rotor.
- Decant the supernatant and resuspend the cells in ice-cold BM buffer at a density of 1 x 10⁸ cells per mL. Transfer to a precooled 1.5 mL microcentrifuge tube on ice.
- Based on the counts obtained in step 2.4 and the desired number of recipients, calculate the volume of donor bone marrow from each of the two donor groups to be mixed in the donor mix tube.
- Reconstituting bone marrow recipients with donor bone marrow
- Anesthetize recipients using induction with continuous flow of 4% isoflurane in air, followed by maintenance at 3.75%. Verify adequate plane of anesthesia by absence of toe-pinch reflex.
- Carefully flick the tube containing bone marrow mix to ensure adequate resuspension of bone marrow cells, then aspirate 200 µL of bone marrow mix (~20 x 106 cells), in a 0.3 mL, 30 gauge insulin syringe.
- Place the recipient on its side, gently stretch the skin above and below the eye to slightly ‘pop the eye out’, and gently insert the tip of the syringe approximately at a 30° angle into the front of the eye socket, taking care to avoid the eye and the surrounding tissue. When the tip of the needle is felt to touch the bone underlining the eye socket, retract slightly (~0.5 mm) and slowly inject the donor bone marrow using steady pressure.
NOTE: There should be no bleeding, no leakage of fluid and no to very minor bulging of the eye upon injection. - Return the mouse to the cage with ad libitum antibiotic water and verify immediate recovery from the procedure. Repeat step 2.6 for each recipient.
NOTE: Tail-vein injection can be used in lieu of retroorbital injection with similar results, however, in our hands it is considerably slower, which may be a concern when working with large groups of recipients. Recovery of anaesthetized animals directly on small diameter bedding should be avoided as it poses an aspiration and asphyxiation risk
- Removing antibiotic water (Day 14)
- Remove the antibiotic water from the cage(s) and replace with fresh regular drinking water.
3. Checking successful reconstitution and verifying appropriate degree of chimerism (Week 6)
- Retroorbital bleeding of chimeras and controls
- Prepare blood collection tubes by labelling 1.5 mL microcentrifuge tubes according to recipient ear tag numbers and adding 50 µL of PBS containing 5 mM EDTA.
NOTE: Include appropriate controls for PA-GFP, CD45.1 and CD45.2, and 9D11 (idiotype). This can be done by including 1 PA-GFP+ mouse, 1 CD45.1 mouse, 1 B6 mouse and 1 564Igi mouse. - Anesthetize mice and verify adequate plane of anesthesia as in step 2.6.1. Place the chimera on its side, gently stretch the skin above and below the eye to slightly ‘pop the eye out’.
- Gently insert a BoPET-wrapped heparinized capillary tube (60 µL internal volume) approximately at a 40° angle into the front of the eye socket, taking care to avoid damaging the eye and the surrounding tissue. Gently twist/rotate the tube until it begins to fill with blood.
- Allow the blood to passively fill the tube by capillary action, until almost completely full, then retract the tube and place it into the corresponding pre-labelled collection tube, while at the same time immediately relaxing the grip around the eye to allow the eye to settle back into position. Bleeding should stop immediately.
- Ensure that the capillary tube has emptied into the collection tube and discard it in a sharps container. Close the tube and invert three times to ensure complete mixing with the PBS/EDTA.
- Return the mouse to the cage and verify immediate recovery from the procedure. Repeat step 3.1 for each experimental mouse and the appropriate controls.
NOTE: Take caution when using the submandibular vein puncture as this method may pose a greater risk for adventitious infection in irradiated recipients before these are fully reconstituted. Furthermore, in our experience, we find that the volume of blood collected and the amount of blood lost due to excessive bleeding is more variable. Both of these considerations are important, as the bone marrow chimeras are sensitive in the reconstitution phase, before the new bone marrow is fully engrafted and hematopoiesis has resumed normal levels.
- Prepare blood collection tubes by labelling 1.5 mL microcentrifuge tubes according to recipient ear tag numbers and adding 50 µL of PBS containing 5 mM EDTA.
- Peripheral blood mononuclear cell (PBMC) purification
- After completion of blood collection, briefly (10 s) centrifuge the tubes at low speed (<200 x g) to collect the diluted stabilized blood at the bottom of the tubes.
- Fill a 10 mL syringe with lymphocyte separation medium and attach an 18 G needle. Insert the needle to the bottom of the first tube and underlayer the blood sample with 1 mL of lymphocyte separation medium. Carefully withdraw the needle and wipe it with a paper towel to prevent cross-contamination of the next sample.
- Proceed through all the samples, then centrifuge for 25 minutes at 800 x g, at room temperature, in a swinging-bucket centrifuge, with the brakes set to low/off.
- Prepare a set of correspondingly labeled 1.5 mL microcentrifuge tubes containing 1 mL of ice-cold BM buffer each.
- Following centrifugation, for each sample, enter the upper (plasma) layer with a 200 µL micropipette and aspirate the mononuclear cell (MNC) layer just above the interface. Transfer the cells to the correspondingly labeled tube containing 1 mL of BM buffer. Close the lid and invert to mix. Discard the lymphocyte separation medium-containing tube.
- Proceed through all the samples and then centrifuge at 200 x g for 5 min, 4 °C in a swinging bucket rotor. Aspirate and discard the supernatant, and resuspend the pellet in 200 µL of ice-cold BM buffer. The samples are now ready for antibody-staining and flow cytometric analysis.
- Staining for flow cytometric evaluation
NOTE: Suggested panel: CD45.1-FITC, B220-PerCP-Cy5.5, 9D11-A568, CD45.2-APC. Non-activated PA-GFP is detected in the Pacific Orange (or equivalent) channel. No viability dye is required as the lymphocyte separation gets rid of dead cells.- Using a micropipette, add 100 µL of cell suspension per well for each chimera and control sample, to a 96-well plate.
- For the 3 non-PA-GFP control samples, pool the remaining 100 µL of each sample (300 µL total). Add 50 µL of this material for unstained control and single stained control wells. For the PA-GFP single-stained control additionally add 50 µL of unstained PA-GFP sample.
- To each well, add 100 µL of buffer (unstained), single antibody (single-stained compensation controls, except for PA-GFP compensation control) or antibody mix (samples). Incubate on ice for 20 minutes.
- Centrifuge at 200 x g for 5 minutes at 4 °C. Flick out the buffer. Add 200 µL of BM buffer to each well and centrifuge again to wash. Flick out the buffer and resuspend cells in each well in 200 µL of BM buffer. The samples are now ready for analysis on a flow cytometer (Figure 1).
NOTE: Germinal center responses in the chimeras can be analyzed at any point from 6 weeks onwards.
4. In vivo labeling of the marginal zone/subcapsular sinus to aid identification of single germinal centers
NOTE: The present protocol is demonstrated for footpad/hock (popliteal lymph node) and intravenous (i.v., spleen) injections, but can be varied according to target site.
- Bilateral footpad injection for popliteal lymph node labeling
- Anesthetize the mice as in step 2.6.1.
- In a 1.5 mL microcentrifuge tube, dilute 2 µL of PE-labeled rat anti-mouse CD169 antibody in 18 µL of PBS, pH 7.4. Place two droplets of 10 µL each of the mixture on a piece of plastic paraffin film. Aspirate each droplet using a 0.3 mL insulin syringe with a 30 gauge needle.
- Inject the 10 µL of labeling mix in either the footpad (enter with the needle at a 5-10° angle in the central part of the footpad, proximal from the beginning of the toes, and insert the needle approximately halfway toward the heel) or the hock (enter with the needle at a 5-10° angle just above the heel and insert about halfway of its length along the axis of the Achilles tendon in the direction towards the knee). Return the mice to their cages and wait approximately 15 minutes before proceeding with step 5.
- Intravenous injection for spleen labeling
- Anesthetize the mice as in point 2.6.1.
- In a 1.5 mL microcentrifuge tube, dilute 10 µL of PE-labeled rat anti-mouse CD169 antibody in 90 µL of PBS. Aspirate the mixture with a 0.3 mL insulin syringe.
- Perform retroorbital i.v. injection as per step 2.6. Return the mice to their cages and wait approximately 15 minutes before proceeding with step 5.
NOTE: As an alternative to isoflurane, injection anesthetic such as Ketamine/Xylazine mix can be used; however, this typically leads to slower recovery times. Since lymphatic drainage is generally influenced by skeletal muscle movement, this is expected to lead to slower drainage time.
5. Explanting spleen and lymph nodes and preparing for photoactivation
- Preparing a double-sided imaging and photoactivation chamber
- Remove the plunger from a 20 mL syringe and back-load it with vacuum grease by inserting the nozzle of a tube of vacuum grease into it. Then remove the plunger from a 5 mL syringe and use the 20 mL syringe to back-load it with vacuum grease.
- Use the vacuum-grease loaded 5 mL syringe to prepare an imaging and photoactivation chamber by placing a square coverslip on a flat surface and tracing along the edges of the coverslip with vacuum grease (about 1-2 mm in from the edges).
NOTE: Take care to avoid vacuum grease contamination of any and all surfaces that subsequently come into contact with the microscope lens, as microdroplets of vacuum grease emulsified in the immersion water can contaminate the lens. - Fill up the cover-slip vacuum grease chamber with ice-cold BM buffer and place on a cold flat surface.
- Harvesting lymph nodes and spleen
- Euthanize the in vivo labeled chimeric mouse to be analyzed as per step 2.2.1. Spray down the carcass with 70% ethanol.
- To access the popliteal lymph node, use straight fine scissors to make an incision in the skin just below the knee pit, and extend the cut upwards along the hamstring-line almost until the hip joint. Using Dumont #5 or #7 forceps, pull each of the exposed flaps of skin outwards, to expose the tissue in the popliteal fossa (Figure 2A).
- Using a pair of Dumont #5 forceps, carefully enter the popliteal fossa just medial to the popliteal vein and dissect open the fat by inserting and opening and closing the forceps along the axis of the leg, in order to expose the underlying popliteal lymph node.
- Pop the lymph node out of the fossa by pinching the quadriceps muscle from the front side proximal to the knee using the thumb and index finger (Figure 2B). Grab the lymph node from below with the forceps to liberate it from the surrounding tissue (Figure 2C) and then place it in the vacuum grease chamber prepared in step 5.1.
- Repeat steps 5.2.2 – 5.2.4 for the contralateral side. Multiple lymph nodes can be fitted in a single chamber if desired.
- Finally close the chamber by placing a second coverslip on top of the vacuum grease rim and pressing gently down, taking care to extrude all air bubbles.
NOTE: Some of the buffer may be pushed out as well, but the vacuum grease should form a tight seal, preventing leakage of fluid (Figure 2D). The lymph nodes are now in a double-sided imaging chamber. - To access the spleen, using a pair of straight fine scissors make an incision through the abdominal wall on the left side of the mouse, proximal to the anterior medial line, just below the ribcage, and extend it around the body to the posterior axillary line. The tip of the spleen should be visible (Figure 3A).
- Pull out the spleen with a pair of Dumont #7 forceps and cut the adhesions on the underside to release it. Use the pair of straight fine scissors to cut ~2 mm thick, cross-sectional, slices.
- Place the slice in the vacuum grease chamber prepared in step 5.1. Multiple spleen slices can be fitted in a single chamber if desired.
- Finally close the chamber by placing a second coverslip on top of the vacuum grease rim and pressing gently down, taking care to extrude all air bubbles. Keep all imaging chambers on ice at all times, except for during the imaging and photoactivation.
NOTE: Some of the buffer may be pushed out as well, but the vacuum grease should form a tight seal, preventing leakage of fluid. The spleen slices are now in a double-sided imaging chamber (Figure 3B).
6. Photoactivation
- Identifying single germinal centers
NOTE: This protocol is described for the spleen, but is entirely analogous for the lymph nodes.- Place the imaging chamber on the microscope stage. Using a 3.5 mL plastic transfer pipette, place a drop of distilled water on top of the upper coverslip and lower the objective until the point of contact. Focus on the top of the tissue using the transmitted light.
- Switch to dark mode and two-photon excitation, and tune the laser to 940 nm.
NOTE: With the appropriate filter sets, this wavelength permits excitation and detection of second harmonics generation in collagen-containing structures associated with major vessels and structural elements, as well as the CD169-PE injected in step 4.2, which identifies the marginal zone. However, 940 nm excitation does not photoactivate PA-GFP. - Localize individual white-pulp areas (bounded by CD169-PE staining) near the surface of the tissue, and identify the periarteriolar lymphoid sheath (PALS, T cell zone) by the second harmonics generation associated with the central arteriole. In the zone between the PALS and the marginal zone, look for the presence of highly autofluorescent, activated tingible-body macrophages (strong autofluorescent signal in all channels, blob-like appearance with dark vacuoles) (Figure 4A).
NOTE: If necessary, due to undesirable orientation of the tissue, the imaging chamber can be flipped and imaging can be performed from the other direction. - Based on hallmarks identified in step 6.1.3., draw a region of interest identifying a single germinal center area. Set up a Z-stack of around 100-150 µm depth, starting from the surface of the tissue, and using a step size of ~3 µm.
- Switch to 830 nm excitation wavelength. Shut off or dim all channels to prevent photodamage to detectors (as laser power and output fluorescence is typically dramatically higher at this wavelength), and then ‘image’ the stack.
NOTE: Specific settings, such as laser power and pixel dwell time, depend on the depth in the tissue, the specific tissue used, and the imaging system. Each application has to be optimized for the specific imaging system used. While it is essential to get efficient photoactivation throughout the stack, care should be taken not to photodamage the cells. - Switch back to 940 nm excitation wavelength and reopen channels. Scan through the stack to confirm efficient photoactivation throughout (Figure 4B) and absence of photodamage (diffuse, non-cell-bounded PA-GFP signal, dark spots or high-degree autofluorescence in photoactivated area).
- Proceed to photoactivate all relevant tissues in the imaging chamber, then promptly return it to ice until further processing. Proceed with photoactivation of additional imaging chambers.
NOTE: Tissue explanting, mounting and particularly photoactivation are time-consuming processes, but the total turn-around time should be restricted to 4-6 hours, to prevent a dramatic decrease in cell viability.
7. Recovery and analysis of photoactivated cells
- Extraction of lymphocytes from lymph nodes and spleen
- For each photoactivated sample, prepare an accordingly labeled 1.5 mL microcentrifuge tube containing 500 µL of BM buffer on ice. Include samples from a non-PA-GFP control and a non-activated PA-GFP mouse. This can be accomplished by including one B6 control and one PA-GFP control mouse.
- Carefully remove the upper cover slip from the imaging chamber, taking care to maintain the position of the samples (if multiple samples are present in a single chamber), and place each sample into its respective sample tube.
- Using a pestle homogenizer, squeeze the tissue and twist the pestle in the tube to release the lymphocytes. Using a micropipette, aspirate the lysate and filter through a 70 µm cell strainer into a fresh, pre-cooled 1.5 mL microcentrifuge tube. For lymph node samples, skip to step 7.1.5.
- For spleen samples, centrifuge at 200 x g for 5 min at 4 °C in a swinging bucket rotor. Discard the supernatant and resuspend the pellet in 200 µL of RBC lysis buffer. Incubate for 5 min at room temperature, then add 800 µL of ice-cold BM buffer and proceed to step 7.1.5.
- Centrifuge at 200 x g for 5 min at 4 °C in a swinging bucket rotor. Discard the supernatant and resuspend in 200 µL of ice-cold BM buffer. The samples are now ready for staining for flow cytometric evaluation and sorting, if desired.
- Staining for flow cytometric evaluation
NOTE: Suggested panel: CD169-PE, B220-PerCP-Cy5.5, 9D11-A647, CD38-PE-Cy7, Fixable Viability Dye Efluor-780, GL7-Pacific Blue. Non-activated PA-GFP is detected in the Pacific Orange (or equivalent) channel. Photoactivated PA-GFP is detected in the GFP channel. Any co-purified macrophages (which may or may not have been in vivo labeled with CD169-PE) can be excluded by staining with CD169-PE and using this as a dump gate.- Using a micropipette, add 100 µL of cell suspension per well for each chimera and control sample, in a 96-well plate.
- For the B6 control samples, add 50 µL of this material for unstained control and single stained control wells. For the non-activated PA-GFP single-stained control additionally add 50 µL of unstained non-activated PA-GFP sample. For the activated PA-GFP single-stained control, pool the remaining material for all photoactivated samples.
- To each well, add 100 µL of buffer (unstained and PA-GFP compensation controls), single antibody (single-stained compensation controls) or antibody mix (photoactivated samples). Incubate on ice for 20 minutes.
- Centrifuge at 200 x g 5 minutes at 4 °C. Flick out the buffer. Add 200 µL of BM buffer to each well and centrifuge again to wash. Flick out the buffer and resuspend cells in each well in 200 µL of BM buffer. The samples are now ready for analysis on a flow cytometer or sorter (representative results in Figure 5).
Results
Generation of mixed bone marrow chimeras
The present protocol robustly achieves mixed bone marrow chimeras with a near-complete chimerism in the B cell compartment as shown in the representative result in Figure 1 (for statistical significance please refer to 12). The serotyping reveals normalized B cell numbers at 6 weeks post reconstitution (Figure 1A), with a low frequency of 9D11 (idiotype) positive circulating B cells deriving from the 564Igi compartment (Figure 1B). Within the total lymphocyte gate, there is a low frequency of residual recipient-derived cells, ~6% CD45.1 (Q1), indicating an overall degree of chimerism of ~94% (Figure 1C). Within the donor compartment (CD45.1-, Q4+Q3) the ratio of 564Igi (Q4) to PA-GFP (Q3) is around 23% to 77%. This slightly lower than input 33% to 66% ratio is explained by the heavy negative selection of B cells derived from the 564Igi compartment 12. As seen in Figure 1D, there is virtually complete chimerism in the B cell compartment (99.9% CD45.1-) and dominance of PA-GFP bone marrow-derived B cells (Q3), which is a consequence of the heavy negative selection of 564Igi-derived B cells.
Harvest of tissues, processing and flow cytometric evaluation
Figure 2 and Figure 3 demonstrate procedures for and results of explanting freshly isolated lymph nodes and spleen slices. Figure 4 presents a representative result for in vivo labeling and photoactivation of a single germinal center area in an explanted spleen slice. As can be seen (Figure 4A), the in vivo labeling with CD169-PE has robustly labeled the marginal zone (red, indicated by “MZ”). The second harmonics signal is apparent in collagen-containing structural elements and major vessels (blue), including the central arteriole of the periarteriolar lymphoid sheath (PALS). Highly autofluorescent, activated tingible-body macrophages are associated with germinal center activity (arrowheads). Taken together, the identification of the marginal zone, the PALS, and tingible-body macrophages, allows identification of a region of interest which likely contains a single germinal center. The region of interest is photoactivated as illustrated in Figure 4B. As demonstrated, photoactivation is microanatomically precise9, yielding a defined area of activation. The presented results additionally serve as confirmation of a high density of PA-GFP+ lymphocytes in the reconstituted chimeras and presence of spontaneous germinal centers. Downstream flow cytometric evaluation further confirms normalized B cell compartment numbers (Figure 5D), a spontaneous germinal center population (Figure 5E), and the presence of a subset of germinal center B cells which have been photoactivated (Figure 5F).
Thus, the present protocol presents a robust method for generation of mixed bone marrow chimeras with spontaneous autoreactive germinal centers, which are predominantly composed of wild-type derived B cells carrying a photoactivatable reporter. This in turn allows for downstream analyses of individual germinal centers (graphical overview in Figure 6).
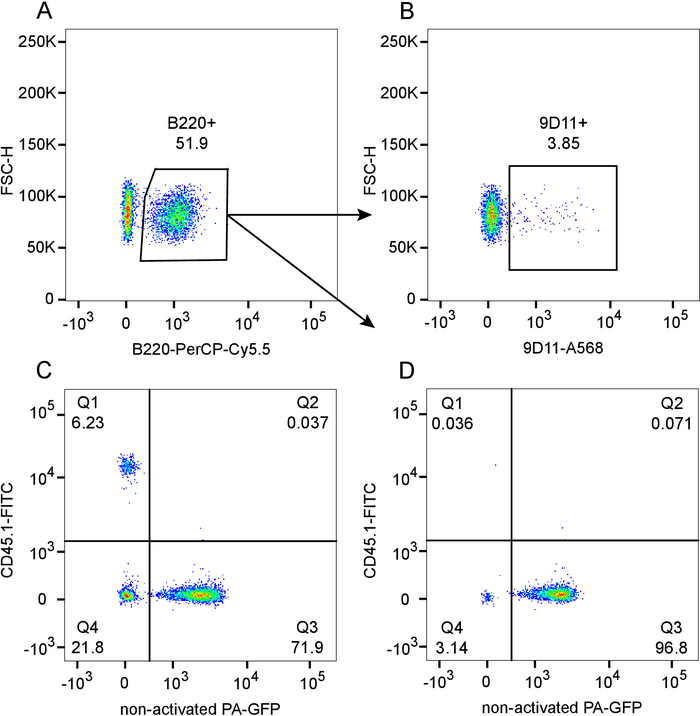
Figure 1: Flow cytometric evaluation of degree of chimerism in blood of 564Igi (CD45.1-, PA-GFP-):PA-GFP (CD45.1-, PA-GFP+) mixed chimeras in lethally irradiated CD45.1 recipients (CD45.1+, PA-GFP-), 6 weeks post reconstitution. A) Plot showing gating of B220+ B cells, pre-gated on singlet lymphocytes. B) Subgate from plot A, showing 9D11+ (idiotype) frequency within the B cell population. C) Plot of PA-GFP versus CD45.1, pre-gated on singlet lymphocytes. D) Plot of PA-GFP versus CD45.1 in the B cell subgate from plot A. Please click here to view a larger version of this figure.
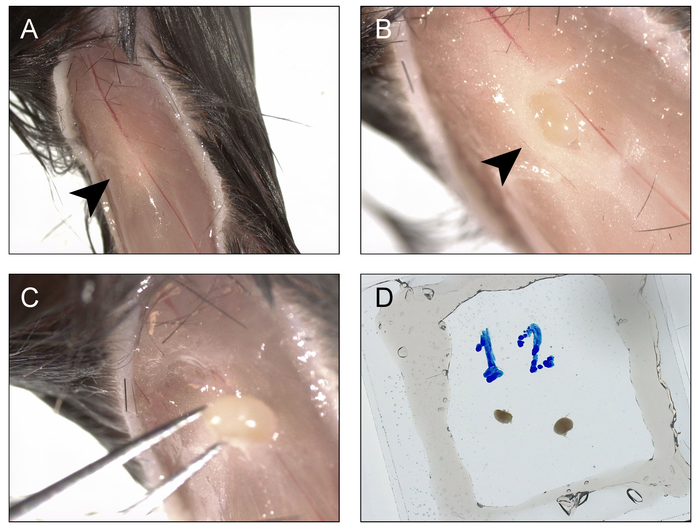
Figure 2: Procedure for harvesting and mounting popliteal lymph nodes for imaging and photoactivation. A) An incision is made below the knee and extended up to the hip joint, and the edges are retracted to the sides, in order to expose the popliteal fossa (arrowhead). B) The overlying fatpad is opened and the popliteal lymph node is exposed (arrowhead). C) The popliteal lymph node is retrieved from the fossa. D) The procedure is repeated for the contralateral side and both nodes are mounted in a double-sided coverslip/vacuum-grease chamber filled with BM buffer. Please click here to view a larger version of this figure.
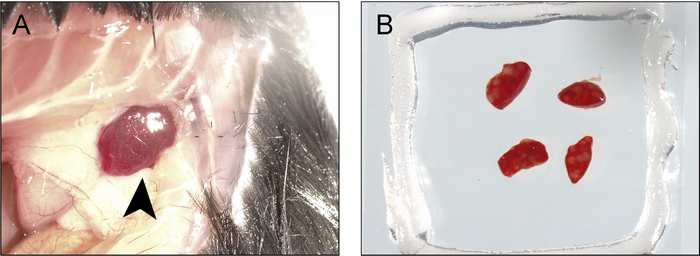
Figure 3: Procedure for harvesting and mounting the spleen for imaging and photoactivation. A) An incision is made at the anterior medial line just below the ribcage and extended around the body to the posterior axillary line, and the edges are retracted to expose the tip of the spleen (arrowhead). B) The spleen is retracted and excised, and cut into thin (1-2 mm) slices, which are mounted in a double-sided coverslip/vacuum-grease chamber filled with BM buffer. Please click here to view a larger version of this figure.
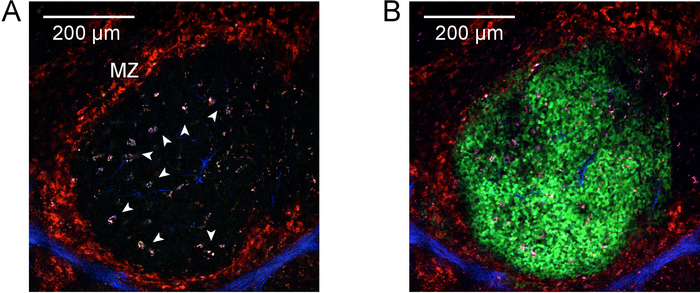
Figure 4: Photoactivation. A) Two-photon micrograph of a germinal center in the spleen before photoactivation. In vivo labeling with anti-CD169-PE was performed before harvest of the spleen to label the marginal zone (red, indicated by “MZ”). The second harmonics signal is apparent in collagen-containing structures associated with the integument and major vessels (blue). Arrowheads identify highly autofluorescent, activated tingible-body macrophages associated with germinal center activity. Imaging was performed at 940 nm excitation. The scale bar in the top left-hand corner indicates 200 µm. B) As for A, but after photoactivation at 830 nm. Photoactivated cells are now visible (green) in a defined region of interest bounded by the marginal zone and encompassing the previously identified tingible-body macrophages. Please click here to view a larger version of this figure.
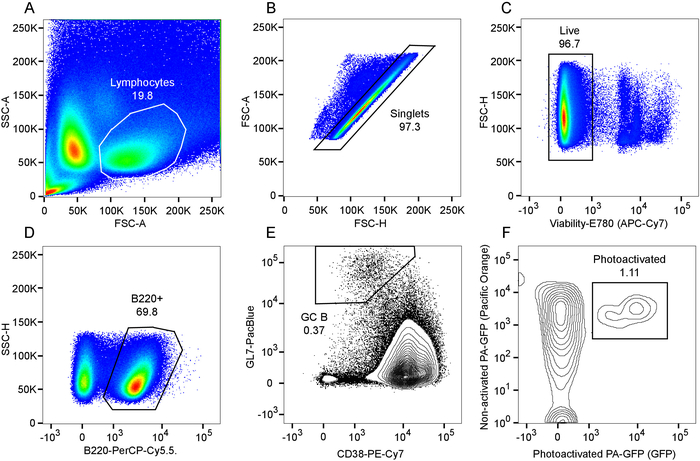
Figure 5: Flow cytometric analysis of photoactivated germinal center B cells. A) Plot of forward versus side scatter and lymphocyte gate. B) Plot of forward scatter area as a function of forward scatter height within the lymphocyte gate, and resulting singlet gate. C) Viability dye exclusion plot within the singlet gate, and resulting live cell gate. D) Gating of B220+ B cells. E) Gating of germinal center B cells, identified as CD38lo GL7hi cells within the B220+ gate. F) Gating of photoactivated cells within the GC B cell population, identified as the subset of cells co-expressing non-activated and photoactivated PA-GFP. Please click here to view a larger version of this figure.
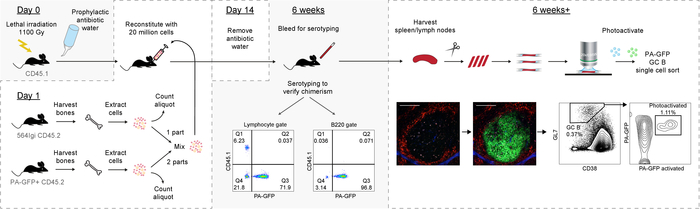
Figure 6: Graphical overview of the protocol. Please click here to view a larger version of this figure.
Discussion
A large number of murine models of autoimmunity are available, many of which present with spontaneous germinal centers16. However, many of the available models harbor complex genetic backgrounds or mutations in central regulators of lymphocyte proliferation or activation, rendering them poorly suited to intercrossing with reporter lines and studies of normal lymphocyte behavior in autoimmunity, respectively. The present model, on the contrary, allows a ‘plug-and-play’ approach to in-depth analyses of autoreactive wild-type-derived germinal center B cells using any desired combination of transgenes, knock-outs and reporters, in the present case represented by photoactivatable GFP. Using in vivo labeling strategies, single germinal centers can be visualized in explanted lymphoid tissues and their cellular constituents photoactivated using a two-photon microscope. Photoactivated lymphocytes from single germinal centers can then be analyzed or sorted flow cytometrically, as single cells or in bulk. These cells may subsequently be subjected to additional downstream molecular and functional analyses to provide renewed insights in the field of autoimmunity.
There are some critical steps for successful performance of this procedure. As demonstrated by the representative results, the irradiation (1,100 Rad) and donor bone marrow reconstitution successfully replace the recipient bone marrow compartment yielding near-complete chimerism in the B cell compartment. This is an important point, as residual recipient-derived B cells would render a subset of the germinal center population ‘dark’. Regardless of the source used for irradiation, the dose/timing of irradiation has to be optimized to yield maximal myeloablative effect with minimal collateral tissue damage to the animals. For reconstitution, the bone-crush protocol and reconstitution with 20 million total donor cells has been found to robustly yield high reconstitution degrees. Working sterile and cold/on ice for the bone marrow extraction ensures high viability of the donor marrow. To reach the desired donor bone marrow ratios, it is essential to exercise great care when counting aliquots of the cells, both for the counting itself and when taking out the subsample of the bone marrow for counting. Mixing and co-pelleting the donor marrows, instead of centrifuging and resuspending separately and then mixing, serves to prevent any skew in donor ratios following the cell counting.
The mixed bone marrow chimera generation of the protocol can stand alone, and it enables generation of chimeras with autoreactive germinal centers with any desired reporter, transgene or knock-out. However, one limitation to this is the need to use histocompatible donors. The 564Igi strain is on a C57Bl/6J congenic background, and as a consequence, the other donor(s) and the recipients should have an H-2b congenic background (or alternatively, the 564Igi strain should be backcrossed to the desired strain and the autoimmune phenotype verified on the new background). The irradiation procedure tends to favor a tolerogenic environment17, and mismatches in some minor histocompatibility antigens may be tolerated. However, this aspect should be thoroughly considered, particularly if mixing male and female donors and/or recipients, due to the potential for female reactivity with male-restricted Y-antigens.
Similarly, the photoactivation aspect of the protocol can stand alone, and may be used in many different contexts. However, the PA-GFP reporter is currently only available with the UBC promotor, which is active in all hematopoietic lineage cells, but not in stromal cells. As mentioned in the Introduction, other photoactivatable, photoswitchable, or photoconvertible reporter strains are available, and may be substituted for PA-GFP, with appropriate adjustment of experimental conditions.
It is important to avoid inadvertent photoactivation of undesirable areas, by maintaining the laser well above 900 nm when imaging, as this wavelength will not photoactivate PA-GFP. For the photoactivation itself, specific settings, such as laser power and pixel dwell time, will depend on the depth in the tissue, the specific tissue used, and the imaging system, and each application has to be optimized for the specific imaging system used. Care should be taken not to photodamage the cells, but it is at the same time essential to get efficient photoactivation throughout the stack, in order to get a sufficient representation of activated cells for downstream analyses. Germinal center B cells generally constitute anywhere from 0.5% to ~2% of splenic or cutaneous lymph node B cells, and as can be seen from the representative results (Figure 5), photoactivated single germinal center B cells may make up ~1% of the total population present in a single spleen slice. Therefore, successful analysis or sorting of a significant number of cells requires processing a large number of events.
Disclosures
The authors have nothing to disclose.
Acknowledgements
SE Degn is a Lundbeckfonden Fellow and a Carlsberg Foundation Distinguished Fellow. This work was in part additionally supported by an NNF Biomedical Grant (SE Degn).
Materials
| Name | Company | Catalog Number | Comments |
|---|---|---|---|
| Antibody, 9D11-A568 | In-house generated | 9D11 hybridoma, kindly provided by MC Carroll, labeled with kit: Biotium 92255 | |
| Antibody, 9D11-A647 | In-house generated | 9D11 hybridoma, kindly provided by MC Carroll, labeled with kit: Nordic Biosite ABD-1031 | |
| Antibody, FITC anti-mouse CD45.1 | Biolegend | 110705 | |
| Antibody, Pacific Blue anti-mouse/human GL7 Antigen (T and B cell Activation Marker) | Biolegend | 144613 | |
| Antibody, PE anti-mouse CD169 (Siglec-1) | Biolegend | 142403 | |
| Antibody, PE/Cy7 anti-mouse CD38 | Biolegend | 102717 | |
| Antibody, PerCP/Cy5.5 anti-mouse/human CD45R/B220 | Biolegend | 103235 | |
| Capillary tube, Mylar-wrapped, heparinized | Fisher Scientific | 211766 | |
| Cell strainer, 70 µm | Falcon | 352350 | |
| Conical tubes, 50 mL | Falcon | 352235 | |
| Cover slip, square, 22x22 mm, 0.13-0.17 mm | Thermo Fisher Scientific | 22X22-1 | |
| EDTA | Merck | 1,084,180,250 | |
| Ethanol, 70% | VWR | 8301.360 | |
| Fetal bovine serum | Life Technologies | 10270106 | |
| Flow cytometer, FACS Canto II | BD Biosciences | 338962 | |
| Flow cytometer, LSRFortessa SORP | BD Biosciences | - | Special order product with 4 lasers (405 nm, 488 nm, 561 nm and 640 nm) |
| Grease, high vacuum, Dow Corning | VWR | DOWC1597418 | |
| Hemocytometer, Burker-Türk | VWR | 630-1544 | |
| Isoflurane, IsoFlo vet. | Orion Pharma | 9658 | |
| Lymphocyte separation medium (Lympholyte-M Cell Separation Media) | Cedarlane | CL5035 | |
| Microcentrifuge tube, 1.5 mL (Eppendorf) | Sarstedt | 72.690.550 | |
| Microscope, Two-photon | Prairie Technologies (now Bruker) | - | Special order Ultima In Vivo Two Photon Microscope |
| Mortar w. lip, unglazed, 75 ml | VWR | 410-0110 | |
| NaHCO3 | Merck | 1063290500 | |
| Needle, 18 gauge | BD Medical | 304622 | |
| NH4Cl | VWR | 87,769,290 | |
| PBS | Sigma | d8537 | |
| Pestle homogenizer | VWR | 47747-358 | |
| Pestle, unglazed, 175 mm | VWR | 410-0122 | |
| Pipette, Serological, 10 ml | VWR | 612-3700 | |
| Pipette, transfer, plastic | Sarstedt | 861,172,001 | |
| Plastic paraffin film (Parafilm M) | Bemis | PM996 | |
| Plate, 96-well | Falcon | 353910 | |
| Surgical forceps, Student Dumont #5 Forceps | FST - Fine Science Tools | 91150-20 | |
| Surgical forceps, Student Dumont #7 Forceps | FST - Fine Science Tools | 91197-00 | |
| Surgical scissors, Student Fine Scissors, Straight | FST - Fine Science Tools | 91460-11 | |
| Syringe, 10 mL | Terumo | SS-10ES1 | |
| Syringe, 20 mL | Terumo | SS-20ES1 | |
| Syringe, 5 mL | Terumo | SS-05S1 | |
| Syringe, Insulin, 0.3 cc | BD Medical | 324827 | |
| Tribrissen vet. 24% inj., containing 200 mg sulfadiazin and 40 mg trimethoprim/ml | MSD Animal health | 431577 | |
| Trypan blue solution, 0.4% | VWR | K940-100ML | |
| Viability dye, eBioscience Fixable Viability Dye eFluor 780 | Thermo Fisher Scientific | 65-0865-14 |
References
- Lerner, A., Jeremias, P., Matthias, T. The World Incidence and Prevalence of Autoimmune Diseases is Increasing. International Journal of Celiac Disease. 3 (4), 151-155 (2015).
- Ando, R., Hama, H., Yamamoto-Hino, M., Mizuno, H., Miyawaki, A. An optical marker based on the UV-induced green-to-red photoconversion of a fluorescent protein. Proceedings of the National Academy of Sciences of the United States of America. 99 (20), 12651-12656 (2002).
- Mutoh, T., Miyata, T., Kashiwagi, S., Miyawaki, A., Ogawa, M. Dynamic behavior of individual cells in developing organotypic brain slices revealed by the photoconvertable protein Kaede. Experimental neurology. 200 (2), 430-437 (2006).
- Tomura, M., et al. Monitoring cellular movement in vivo with photoconvertible fluorescence protein “Kaede” transgenic mice. Proceedings of the National Academy of Sciences. 105 (31), 10871-10876 (2008).
- Tomura, M., et al. Tracking and quantification of dendritic cell migration and antigen trafficking between the skin and lymph nodes. Scientific Reports. 4, 6030(2014).
- Gurskaya, N. G., et al. Engineering of a monomeric green-to-red photoactivatable fluorescent protein induced by blue light. Nature biotechnology. 24 (4), 461-465 (2006).
- Pereira, E. R., et al. Lymph node metastases can invade local blood vessels, exit the node, and colonize distant organs in mice. Science (New York, NY). 359 (6382), 1403-1407 (2018).
- Patterson, G. H., Lippincott-Schwartz, J. A photoactivatable GFP for selective photolabeling of proteins and cells. Science (New York, NY). 297 (5588), 1873-1877 (2002).
- Victora, G. D., et al. Germinal center dynamics revealed by multiphoton microscopy with a photoactivatable fluorescent reporter. Cell. 143 (4), 592-605 (2010).
- Habuchi, S., et al. Reversible single-molecule photoswitching in the GFP-like fluorescent protein Dronpa. Proceedings of the National Academy of Sciences of the United States of America. 102 (27), 9511-9516 (2005).
- Zhou, X. X., Chung, H. K., Lam, A. J., Lin, M. Z. Optical control of protein activity by fluorescent protein domains. Science (New York, NY). 338 (6108), 810-814 (2012).
- Degn, S. E., et al. Clonal Evolution of Autoreactive Germinal Centers. Cell. 170 (5), 913-926 (2017).
- Berland, R., et al. Toll-like receptor 7-dependent loss of B cell tolerance in pathogenic autoantibody knockin mice. Immunity. 25 (3), 429-440 (2006).
- Chatterjee, P., et al. Complement C4 maintains peripheral B-cell tolerance in a myeloid cell dependent manner. European journal of immunology. 43 (9), 2441-2450 (2013).
- Toubai, T., et al. Induction of acute GVHD by sex-mismatched H-Y antigens in the absence of functional radiosensitive host hematopoietic-derived antigen-presenting cells. Blood. 119 (16), 3844-3853 (2012).
- Luzina, I. G., et al. Spontaneous formation of germinal centers in autoimmune mice. Journal of leukocyte biology. 70 (4), 578-584 (2001).
- Sachs, D. H., Kawai, T., Sykes, M. Induction of tolerance through mixed chimerism. Cold Spring Harbor perspectives in medicine. 4 (1), a015529(2014).
Reprints and Permissions
